product measurement, industrial systems, analysis scope. I. INTRODUCTION .... tool (e.g. editor). .... data mining techn
Categories of Source Code in Industrial Systems
Keywords-Categorization, source code, software metrics, product measurement, industrial systems, analysis scope
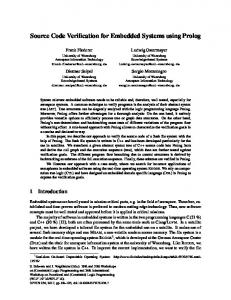
I. I NTRODUCTION An important preparation step to measure software products is the definition of the measurement scope. This scope defines which software artifacts should be taken into account and how they will be measured. For instance, to measure test coverage [1] production and test code must be distinguished. The distinction of these two source code artifacts, commonly done in the build configuration, forms the measurement scope of the test coverage analysis. The tests, recognized in the scope, are executed and if they succeed the production code under test (or a subset of it) is marked as covered. Using the scope, the production code is afterwards analyzed to achieve the final coverage count. An incorrect definition of the scope will, inevitably, lead to variations in the reported coverage: recognizing test as production code may result in a lower coverage and recognizing production as test code results in either a higher or a lower coverage. The correct definition of measurement scope is equally important to other analyses. Figure 1 uses density plots to show the influence of test and generated code on the distribution of the McCabe metric [2] for two of 80 industrial systems belonging to a benchmark of systems analyzed
30 15
McCabe values
20
25
production and generated production generated
0
5
10
20 15 10 5
McCabe values
25
production and test production test
0
Abstract—The categorization of source code artifacts affects how the overall product is measured and consequently how these measurements are interpreted. When measuring complexity, for instance, failing to distinguish test and generated code will affect complexity measurements possibly leading to an erroneous interpretation of the overall product complexity. Although categorization problems are known, there seems to be little attention given to this subject in the literature. In this paper, we introduce a categorization for source code artifacts and present an empirical study providing evidence of each category. Artifacts are divided into production and test code, and then these categories are sub-divided into manuallymaintained, generated, library, and example code. By analyzing 80 Java and C# industrial systems, we have found evidence of the majority of categories. We show that in average production code only accounts for 60% of a product volume. Also, we have found that for some systems the overall percentage of test and generated code, each can account to over 70% and of library code to over 40%. Finally we discuss the difficulties of distinguishing source code artifacts and conclude with directions for further research.
30
Tiago L. Alves Software Improvement Group, Amsterdam, The Netherlands University of Minho, Braga, Portugal Email:
[email protected]
0.0
0.2
0.4
0.6
0.8
% of LOC
(a) Influence of test code
1.0
0.0
0.2
0.4
0.6
0.8
1.0
% of LOC
(b) Influence of generated code
Figure 1. Influence of the Test code and Generated code in the McCabe distribution for two example systems. Distributions are plotted using a cumulative density function. The black full line represents production code. The gray line represents code influencing measurements. The black dashed line represents the result when analyzing everything together. The arrow indicates the impact of non-distinguishing source code.
by the Software Improvement Group (SIG). The x-axis represents the percentage of lines of code (LOC) of a system and in the y-axis the maximum McCabe values (limited to 30 for readability purposes). For more information of using density plots to study metric distributions see [3]. In Figure 1 we use arrows to indicate the effects of not differentiating source code. Figure 1(a) shows the influence of test code on the McCabe distribution of a Java system with overall size over 300K LOC (roughly half is production code and the other half is test code). The gray line shows the metric distribution for test code which is more skewed than production code (black full line), i.e., test code is less complex than production code. Not distinguishing test from production code (black dashed line) results in a distribution shift which hides the overall complexity. Figure 1(b) shows the influence of generated code on the McCabe distribution of a C# system with overall size of near 300K LOC (30% of its size is production code and 70% is generated code). For the C# system, the effect is the opposite as shown for the Java system. Because generated code (gray line) is more complex than production code (black full line), the mix of both will shift the distribution (black dashed line), indicating a more complex system. Also, while the maximum McCabe value for production code is below 30, for generated code it is over 300. The two plots depict two examples of the possible effects on measurement of mis-categorizing software: one where
Source code Production Test Manually-maintained Generated Library Example
Figure 2. Categorization of source code artifacts. Each inner box represents an unique category which can be either production or test, and then subcategorized into manually-maintained, generated, library, or example code.
measurements are understated and one where measurements are exaggerated. Naturally, by affecting measurements this also affects the results of any empirical study based on measurements. This leads to the two following questions: (i) Which artifacts should be distinguished in a software analysis? (ii) What is the relative importance of the different artifacts within a software system? This paper is organized as following. Section II introduces a categorization for source code artifacts. Section III, empirical evidence of this categorization is provided. Section IV discusses the problems of distinguishing the different software artifacts. Finally, conclusion and avenues of future work are presented in Section V. II. S OURCE CODE ARTIFACT CATEGORIZATION Figure 2 depicts a categorization that is meant to be mutually exclusive (the same artifact can only be classified in a single category) and collectively exhaustive (all categories together cover all possible types of source code artifacts). This categorization was designed to be independent of any programming language and was developed based on experience of analyzing software systems [4] by the SIG. Source code artifacts can fall into two major categories, production and test code, which can be sub-categorized into manuallymaintained, generated, library, and example making a total of 8 categories. We first discuss the two major groups before discussing the sub-categories. Production code: We consider production code all artifacts that are directly related with the logic of the software product and are necessary to its compilation and execution. Test code: We consider test code all artifacts whose sole purpose is to directly or indirectly invoke functionality of production code for testing purposes. This includes testing utilities, unit or integration tests, and auxiliary artifacts (e.g. configuration, or initialization artifacts such as mock objects).
Manually-maintained code: We consider manuallymaintained code all artifacts that have been created or modified by a developer either under development or maintenance. This includes all artifacts created using any type of tool (e.g. editor). Configuration, experimental or temporary artifacts, if created or modified by a developer, should also be considered as manually-maintained code. Generated code: We consider generated code all artifacts that are automatically created and modified by a tool using other artifacts as input. Common examples are parsers (generated from grammars), data access layers (generated from different models such as UML, database schemas or web-service specifications), mock objects or test code. Library code: We consider library code all artifacts that are developed and maintained by third-parties but implement features necessary either for the system logic or for testing. This includes contribution code made available by external parties or library code (complete or partial) that was included/copied into the code base. Example code: We consider example code all artifacts that do not implement or test product features, and whose purpose is to execute part of the system (e.g. to demonstrate the functionality of a feature) or to be used as template for developing new code. For instance, APIs normally provide example code to show how certain features are invoked. III. C ATEGORIZATION APPLICABILITY To provide evidence of the categorization introduced in Section II we have analyzed 80 industrial systems. These systems are part of the SIG benchmark, belong to different companies (e.g. banking, insurance, logistics), and have sizes ranging from near 5K to over 1.7M LOC, totaling over 15M LOC. We have only analyzed modern object-oriented languages, Java and C#, and restricted the Benchmark to a maximum of 4 systems of the same company. For all 80 systems, the identification of each category was done by consulting available documentation, manually looking at the folder structure for known naming conventions (e.g. Test and Example code can be commonly found in folders whose names contain the ”test“ and “example” strings, respectively), and using regular expressions (e.g. Generated code can be identified by searching for the “generated by” string, and Library code can be identified by looking for “copyright”, “license” or ”author” strings). These results were validated by discussing the categorization with the product owners, in a workshop, as part of the SIG risk assessment process [4]. No ambiguities arose when categorizing software artifacts for all 80 systems, providing confidence that the used categorization is mutually exclusive and collectively exhaustive. Table I summarizes our findings, showing the number (and percentage) of systems contained in each category. Table II restricts Table I for categories that represent at least 5% of the project’s volume, in order to provide confidence of the
Table I N UMBER ( AND PERCENTAGE ) OF PROJECTS PER CATEGORY
Manually-maintained Generated Library Example
Production 80 (100.0%) 52 (65.0%) 30 (37.5%) 2 (2.5%)
74 15 7 0
Test (92.5%) (18.8%) (8.7%) (0.0%)
Table II N UMBER ( AND PERCENTAGE ) OF PROJECTS PER CATEGORY REPRESENTING 5% OR MORE OF THE OVERALL CODE VOLUME Production 80 (100.0%) 34 (42.5%) 6 (7.5%) 0 (0.0%)
56 3 0 0
Test (70.0%) (3.8%) (0.0%) (0.0%)
1.0
Manually-maintained Generated Library Example
● ●
0.8
● ● ●
●
0.6
● ●
●
0.4
● ● ● ●
0.2
% of volume (LOC)
● ●
●
● ●
0.0
● ● ● ●
M. Prod
Figure 3.
M. Test
Gen. Prod Gen. Test
● ● ● ● ● ● ● ● ● ●
● ●
Lib. Prod
Lib. Test
Variation of the volume percentage per category.
significance of the results. Except for Example test we found evidence for all categories. Generated production code can be found in 65% of systems, having significant volume in 42.5% of systems. Generated test code, on the other hand, was only found in 18.8% of systems but for only 3.8% of the systems there is a significant volume. A striking finding is that library code has been copied into 37.5% of the systems and for 7.5% of all systems this code is higher than 5% of the overall volume (Library production category). Library test code was also found in 8.7% of the systems, but representing a very small percentage of the overall code (< 5%). Example production was found in 3 systems, but also representing a very small percentage of code. Figure 3 shows a box and whiskers plot with the percentages of the overall code each category represents. The bottom, the middle and the top of the box represent the 25th (Q1 ), the 50th (median) and the 75th (Q3 ) quantiles. The whiskers represent the maximum and minimum values
that are not considered outliers. The outliers1 are represented with circles. In the box plot we omitted the Example category as it has only a few observations. For the Manually-maintained production category, the median of the overall volume is 60%, which also indicates that, in median, 40% of the overall system code consists of other software artifacts. For the Manually-maintained test category, the median is around 11% indicating that most modern object-oriented systems have a low overall volume of test code. The number of outliers in the Generated production category is surprising, showing several systems in which generated production code represents over 40% of the overall volume. These systems sizes range from small (with 7K LOC) to very-large systems (1M LOC), although the majority of systems have around 500K LOC. The largest outlier, at 90%, is a system with near 1M LOC. For the Generated test, Library production and Library test the box plot depicts all measurements as outliers. This is because, for many systems there is no code for these categories and, consequently, the interquartile-range (IQR) is zero. For the Generated test category the largest outlier is at 80%, corresponding to a system with a total size of 300K LOC. For the Library production category, it is also worth to note that this category can represent up to 40% of the overall system code. However, the systems having the two largest outliers, at 45% and 17% are of small size (13K and 40K LOC, respectively). The Library test category represents very little code, reaching a maximum of 1%. The same is valid for the Example production category, representing 0.22% and 1.88%. Summarizing, not only were we able to find evidence for all categories defined in Section II, but also each category can represent a substantial percentage of the overall system code. This clarifies the need to differentiate software artifacts when measuring software and interpreting measurement results. IV. D ISCUSSION In this section we discuss the study validity and experienced categorization issues. A. Study validity It is likely that we have failed to identify some categories, mis-categorizing the code as Manually-maintained production. It is also possible that for some systems not all code was made available by their owners (in particular generated code). Hence, the values presented in Section III might be an underestimation of the real values. However, since the findings for each system were validated by system owners we expect errors to be small. Nevertheless, the results 1 A value x is considered an outlier if: x > Q + 1.5 × IQR or x < 3 Q1 − 1.5 × IQR where IQR = Q3 − Q1 .
presented are conservative, i.e., the percentages for each category can be higher but not lower. B. Categorization issues Manually-modified code: It is possible that artifacts initially categorized as Generated or Library are afterwards manually modified. Under this circumstance, we considered the code as Manually-maintained since it is likely that all future modifications will be also done manually. In cases that it is known that a library is replaced by a newer version or generated code is automatically re-generated we maintain the initial categorization. In cases of doubt that the code was not replaced but manually-modified (e.g. in legacy systems where knowledge is lost), we follow a conservative approach categorizing that code as Manually-modified. Unused, Temporary and Extraneous code: We have found in practice that some code should simply be ignored from the analysis. Unused code was found in a system where a module was renovated but the original was still available for reference. Temporary code was found in a system for migrating data between revisions, which was later thrown away. Extraneous code was found in a system where multiple branches or projects were mistakenly together. For these cases, code was simply ignored from the analysis. However, this should be validated or, in case of doubt, a conservative approach should be followed when including this code in the analysis. Decompiled code: We have found in practice a system with decompiled code, both in Library and Manuallymaintained Production categories, where the original sources were lost and later retrieved automatically from binary form. In this case, the categorization presented in this paper is still applicable, but code could be additionally tagged to reveal that code as decompiled. Granularity of the analysis: In this study, we used filelevel granularity. However, the use of a finer granularity would improve the results accuracy in particular for C# where two categories can co-exist within the same file (e.g. blocks of generated code with blocks of manuallymaintained code). For simplicity we opted for file-level granularity, and used a conservative approach considering files with both generated and manually-maintained code as Manually-maintained. V. C ONCLUSION Contributions: We introduced a categorization to distinguish source code artifacts and, by analyzing 80 industrial Java and C# systems provided evidence of its frequency and relevance. The study revealed that 7 of the 8 categories defined in Section II were found in those industrial systems. Also, in average only 60% of the system code is Manuallymaintained production code. However, for some systems, Generated and Library code can represent up to 80% and 40% of the overall system code, respectively. These findings
provide evidence that the mis-categorization of software artifacts can impact measurements, stressing the importance of a more rigorous approach when measuring software products. Future work: In short-term, we want to formally describe the scope information (e.g. using an XML schema) and propose an interchange format. This includes investigation on how to enable finer or coarser granularity levels (e.g. method or folder), taking into account programminglanguage independence, without increasing the effort to define a scope. As mid-term future, we envision exploring support for software evolution, i.e., how to provide means to record new/removed artifacts, or artifacts for which its categorization changes. This is relevant when analyzing several revisions of a software systems, since these changes can influence results. We also would like to extend the scope definition with validation rules (e.g. to check if a software artifact can be identified in more than one category or if there was a classification change). Tools for automatically inferring and validating the scope information are also envisioned (initially using heuristics and later attempting data mining techniques or learning algorithms). Finally, as long-term future we would like to promote and support the standardization of the scope definition to describe software artifacts. This information is complementary, for instance, to build information which defines how those artifacts are built. Developers could support and maintain scope information as means to describe the different artifacts and check for changes during the development/maintenance process. Also, the standardization of scope information could lead the its adoption by analysis tools, enabling minimal (or zero) configuration to analyze software systems. ACKNOWLEDGMENTS Thanks to Cathal Boogerd, Eric Bouwers, and Joost Visser of the SIG for providing comments to earlier versions of this work. The author is supported by the Fundac¸a˜ o para a Ciˆencia e a Tecnologia (FCT), grant SFRH/BD/30215/2006, and SSaaPP project, FCT contract no. PTDC/EIA-CCO/ 108613/2008. R EFERENCES [1] H. Zhu, P. A. V. Hall, and J. H. R. May, “Software unit test coverage and adequacy,” ACM Computing Surveys, vol. 29, pp. 366–427, December 1997. [2] T. McCabe, “A complexity measure,” IEEE Transactions on Software Engineering, vol. 2, pp. 308–320, 1976. [3] T. L. Alves, C. Ypma, and J. Visser, “Deriving metric thresholds from benchmark data,” IEEE International Conference on Software Maintenance (ICSM), pp. 1–10, 2010. [4] A. van Deursen, “Source-based software risk assessment,” IEEE International Conference on Software Maintenance (ICSM), p. 385, 2003.