CATS Benchmark Time Series Prediction by Kalman Smoother with Cross-Validated Noise Density Simo S¨arkk¨a ∗ , Aki Vehtari, Jouko Lampinen Helsinki University of Technology, P.O. Box 9203. FIN-02015 HUT, Finland.
Abstract This article presents the winning solution to the CATS time series prediction competition. The solution is based on classical optimal linear estimation theory. The proposed method models the long and short term dynamics of the time series as stochastic linear models. The computation is based on a Kalman smoother, in which the noise densities are estimated by cross-validation. In time series prediction the Kalman smoother is applied three times in different stages of the method. Key words: CATS benchmark, Bayesian filtering, optimal filtering, Kalman filter, Kalman smoother
1
Introduction
This article 1 presents the winning solution to the time series prediction competition, the CATS benchmark [2], which was organized as a special session of the IJCNN 2004 conference. The solution is based on the classical Kalman smoother with cross-validated process noise variances. In addition to presenting the winning solution, this article also discusses the connection of optimal filtering to Bayesian inference, and to the Gaussian process regression models used in Bayesian neural network literature. ∗ The corresponding author Email address:
[email protected] (Simo S¨arkk¨a). 1 This article is an extended version of the article [1]
Preprint submitted to Elsevier Science
25 August 2005
1.1 CATS Benchmark
The goal of the CATS competition [2] was to provide a new benchmark for the problem of time series prediction and to compare different methods and models that can be used for the prediction. The proposed time series is the CATS benchmark (Competition on Artificial Time Series). This artificial time series with 5,000 data was given. Within those 100 values were missing. These missing values were divided in 5 blocks: • • • • •
elements elements elements elements elements
981 to 1,000; 1,981 to 2,000; 2,981 to 3,000; 3,981 to 4,000; 4,981 to 5,000;
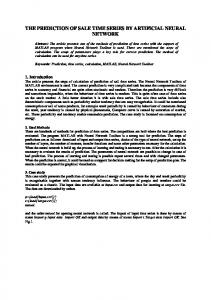
The purpose was to predict the 100 missing values based on the other data. The performance criterion was the mean square error, which was computed on the 100 missing values. The time series is shown in Figure 1.
800
600
400
Signal
200
0
−200
−400
−600
0
500
1000
1500
2000
2500 Time
3000
3500
4000
4500
5000
Fig. 1. The CATS benchmark time series. The purpose of the competition was to predict the missing data (marked with arrows) such that the mean squared error is minimized.
2
1.2 Optimal Linear Filtering
The success of optimal linear filtering is mostly due to the seminal article of Kalman [3], which describes a recursive solution to the optimal discrete linear filtering problem. Although the original derivation of the Kalman filter was based on the least squares approach, the same equations can be derived from pure probabilistic Bayesian analysis. The Bayesian analysis of Kalman filtering is well covered in the classic book by Jazwinski [4] and more recently in the book by Bar-Shalom et al. [5]. Kalman filtering, mostly because of its least squares interpretation, has been widely used in stochastic optimal control. A practical reason to this is that the inventor of Kalman filter, Rudolph E. Kalman, has also made several contributions [6] to the theory of linear quadratic Gaussian (LQG) regulators, which are fundamental tools of stochastic optimal control [7,8]. As discussed in the book by West and Harrison [9], in the sixties, Kalman filter like recursive estimators were used also in the Bayesian community and it is not clear whether the theory of Kalman filtering or the theory of dynamic linear models (DLM) was the first. Although these theories were originally derived from slightly different starting points, they are equivalent. Because of its useful connection to the theory and history of stochastic optimal control, this article approaches the Bayesian filtering problem from the Kalman filtering point of view. In the early stages of its history, the Kalman filter was soon discovered to belong to the class of Bayesian estimators [10], with the resulting generalized theory called non-linear filtering theory [4]. An interesting historical detail is that while Kalman and Bucy were formulating the linear theory in the United States, Stratonovich was doing the pioneering work on the probabilistic (Bayesian) approach in Russia [11,4]. An optimal discrete filter, such as the Kalman filter, solves the discrete-time filtering problem, which means that the underlying physical phenomenon is modeled as a discrete-time process. However, because Nature is continuous, a physically more realistic approach is continuousdiscrete filtering [4], where state dynamics are modeled as continuous-time stochastic processes, that is, stochastic differential equations [12,13] and measurements are assumed to be obtained at discrete time steps. The dynamic model in this paper is also first designed as a continuous-time process and then discretized to allow for consistent prediction over intervals of varying length, that is, for non-uniform sampling of measurements.
2
Optimal Estimation
In this section we review the formulation of optimal filtering and smoothing as recursive Bayesian estimation and introduce the notation used in this article. The equivalent formulation is used in classical estimation theory and optimal filtering literature (e.g., [4]). 3
Optimal non-linear discrete-time estimation considers generic state space models of the form xk ∼ p(xk | xk−1 ) yk ∼ p(yk | xk ),
(1)
where xk ∈ Rn is the unknown hidden state and yk ∈ Rm is the measurement at time step k. The dynamic model p(xk | xk−1 ) defines the Markov model for state transitions. The measurement model p(yk | xk ) defines the distribution of measurements for given state configurations. At the initial time step k = 0, the state is assumed to have the prior distribution p(x0 ). 2.1 The Optimal Filtering Equations The goal of filtering is to compute the posterior distribution of the state xk at time step k given the history of the measurements up to time step k p(xk | y1 , . . . , yk ) = p(xk | y1:k ).
(2)
The recursive equations for computing the posterior state distribution above are called the optimal filtering equations: • The prediction step uses the Chapman-Kolmogorov equation for propagating the posterior distribution of the previous time step p(xk−1 | y1:k−1 ) to current time step taking into account the uncertainties induced by the dynamic model p(xk | xk−1 ): p(xk | y1:k−1 ) =
Z
p(xk | xk−1 ) p(xk−1 | y1:k−1 ) dxk−1 .
(3)
• The update step fuses the information in the predicted distribution and the measurement likelihood p(yk | xk ) by using the Bayes rule: p(xk | y1:k ) = R
p(yk | xk ) p(xk | y1:k−1 ) . p(yk | xk ) p(xk | y1:k−1 ) dxk
(4)
2.2 The Optimal Smoothing Equations The purpose of (fixed-interval) smoothing is to compute the posterior distribution of the state xk at time step k after receiving the measurements up to time step T , where T > k p(xk | y1 , . . . , yT ) = p(xk | y1:T ).
(5)
The difference between filters and smoothers is that the filter computes its estimates using only the measurements obtained before and at time step k, but the smoother uses also the 4
measurements obtained after time step k. After obtaining the filtered posterior state distributions, the following optimal smoothing equations can be used for computing the posterior distribution for each time step conditional on all measurements up to time step T : p(xk+1 | y1:k ) = p(xk | y1:T ) =
Z
Z
p(xk+1 | xk ) p(xk | y1:k ) dxk
p(xk+1 | xk ) p(xk | y1:k ) p(xk+1 | y1:T ) dxk+1 . p(xk+1 | y1:k )
(6) (7)
2.3 Continuous-Discrete Filtering and Smoothing In continuous-discrete filtering the dynamics of the state are modeled as Itˆo stochastic differential equations (SDE) of the form [4,12,13] dx = f (x, t)dt + L(x, t)dβ(t),
(8)
where x(t) is the state, f (x, t) is the drift function, L(x, t) is the dispersion matrix, and β(t) is n-dimensional Brownian motion (Wiener process) with known diffusion matrix Q c (t). In estimation context [14,5,15] and also in this article the SDE is often stated in terms of a white noise process w(t) as x˙ = f (x, t) + L(x, t)w(t), (9) where the white noise is defined as the formal derivative of the Brownian motion w(t) = dβ/dt and x˙ = dx/dt. The theoretical problem in this white noise formulation is that white noise as a stochastic process cannot exists in the mathematical sense, because Brownian motion is nowhere differentiable. For this reason the integral equation formulation (8) of the SDE is often used in mathematical analysis. In practice, models are much easier to formulate in terms of white noise and for this reason it is often used engineering and physics applications. Fortunately, all sensible models involving white noise can be interpreted also in terms of Brownian motion. In continuous-discrete filtering the measurements yk are obtained discretely at time instances t1 , t2 , ... as in the discrete model (1). To emphasize that the measurement model is function of state at time tk , not time index k, it is written as p(yk | x(tk )). For example, in linear Gaussian filtering model we would have a measurement model p(yk | x(tk )) = N(yk | Hx(tk ), R).
(10)
The advantage of the continuous-discrete model over discrete model is that the case of nonuniform sampling (i.e., varying sampling interval) is naturally included in the model. In theory, any continuous-discrete filtering model can be reduced into an equivalent discrete model by solving the transition densities p(x(tk ) | x(tk−1 )) from the Kolmogorov forward partial differential equation (also called the Fokker-Planck equation) [4,12,13]. Sometimes it 5
is possible to solve the transition density explicitly, and the most common special cases of this kind are the Kalman-Bucy filters [3,16], but in general numerical approximations are required. Because in principle a continuous-discrete filtering model can be always reduced into an equivalent discrete model, also the optimal discrete filtering and smoothing equations apply as such. The explicit conversion into an equivalent discrete model is not the only possible way to go, but it is particularly useful in Kalman filtering models, which are used in this article.
2.4 The Kalman Filter
The Kalman filter (see, e.g. [4,14,5]), which originally appeared in [3], considers discrete filtering models, where the dynamic and measurements models are linear Gaussian xk = Ak−1 xk−1 + qk−1 yk = Hk xk + rk ,
(11)
where qk−1 ∼ N(0, Qk−1 ) and rk ∼ N(0, Rk ). If the prior distribution is Gaussian, x0 ∼ N(m0 , P0 ), then the optimal filtering equations can be evaluated in closed form and the resulting distributions are Gaussian − p(xk | y1:k−1 ) = N(xk | m− k , Pk ) p(xk | y1:k ) = N(xk | mk , Pk ) p(yk | y1:k−1 ) = N(yk | Hk m− k , Sk ).
(12)
The parameters of the distributions above can be computed with the Kalman filter prediction and update steps: • The prediction step is m− k = Ak−1 mk−1 T P− k = Ak−1 Pk−1 Ak−1 + Qk−1 .
(13) (14)
• The update step is vk Sk Kk mk Pk
= y k − H k m− k T = H k P− H + Rk k k T −1 = P− k Hk S k = m− k + K k vk − = Pk − Kk Sk KTk . 6
(15) (16) (17) (18) (19)
2.5 The Kalman Smoother The Kalman smoother (see, e.g., [14,5]), which is also called the Rauch-Tung-Striebel smoother [17] computes the state posterior distributions p(xk | y1:T ) = N(xk | msk , Psk ),
(20)
for the linear filtering model (11) recursively. The difference to the posterior distributions computed by the Kalman filter is that the smoothed distributions are conditional on the whole measurement data y1:T , while the filtered distributions are conditional only on the measurements obtained before and at time step k, that is, on the measurements y1:k . In the fixed interval Kalman smoother which is used in this article, the smoothed distributions are computed from the Kalman filter results with recursions P− k+1 Ck msk Psk
= Ak Pk ATk + Qk −1 = Pk ATk [P− k+1 ] = mk + Ck [msk+1 − Ak mk ] T = Pk + Ck [Psk+1 − P− k+1 ]Ck ,
(21)
starting from the last time step T , with msT = mT and PsT = PT . 2.6 The Continuous-Discrete Kalman Filter In the continuous-discrete Kalman filter [4,14,5] the discrete-time dynamic model is replaced with a continuous-time linear stochastic differential equation [12,13] model of the form ˙ x(t) = F(t)x(t) + L(t)w(t),
(22)
x(0) ∼ N(m(0), P(0)).
(23)
E[w(t)] = 0 E[w(t) w(t + τ )T ] = Qc (t)δ(τ ).
(24) (25)
with the initial conditions F(t) and L(t) are time dependent matrices, and w(t) is a Gaussian white noise process with moments
The solution x(t) is a Gaussian process with its mean and covariance given by the differential equations ˙ m(t) = F(t)m(t) ˙ P(t) = F(t)P(t) + P(t)FT (t) + L(t)Qc (t)LT (t).
7
(26) (27)
These equations are the classical optimal prediction equations of the Kalman-Bucy filter [16]. In continuous-discrete filtering the measurements are obtained at discrete instances of time and we are only interested in the state distribution at these time steps. Thus, we are interested in forming a model that jumps from time instance t0 to the first measurement at t1 , then from t1 to the second measurement at t2 and so on. The continuous-time linear model (22) can be converted into the equivalent discrete model, which is of the same form as the dynamic model of the Kalman filter (11). The solutions to Equations (26) and (27) can be integrated exactly from measurement to measurement using equations of the form mk = Ak−1 mk−1 Pk = Ak−1 Pk−1 ATk−1 + Qk−1 .
(28) (29)
where mk = m(tk ), Pk = P(tk ). This is equivalent to using the discrete dynamic model (11) with a transition matrix Ak−1 and process noise covariance Qk−1 . These equivalent discrete-time matrices Ak = A(tk ), Qk = Q(tk ) can be solved from the differential equations ˙ A(t) = F(t)A(t) ˙ Q(t) = F(t)Q(t) + Q(t)FT (t) + L(t)Qc (t)LT (t).
(30) (31)
with initial conditions A(tk−1 ) = I and Q(tk−1 ) = 0. If the model is linear and time invariant (LTI), that is, the matrices F and L do not depend on time, the discrete model matrices will depend only on the time difference ∆tk = tk − tk−1 , Ak = A(∆tk ), Qk = Q(∆tk ). Furthermore, if also the sampling period ∆tk is independent of the time step index k, the discrete model matrices will be constant. 2.7 Gaussian Processes The continuous-discrete Kalman filter described in the previous section uses Gaussian processes as its dynamic models. Gaussian processes are the most common signal models in classical continuous-time signal processing, especially in communications applications. The theory of Wiener filtering [18], which is the theoretical basis for optimal signal detection and demodulation [19] deals with signals that can be modeled as stationary Gaussian processes. Kalman filtering [3] and Kalman-Bucy filtering [16] can be considered as extensions to Wiener filtering theory, in which also non-stationary Gaussian process models can be used. Stochastic control theory [8] builds on the grounds of Kalman-Bucy filtering by including a controller aside with the optimal state estimator. Gaussian processes, or Gaussian random fields are also used in spatial and spatio-temporal modeling [20,21], and in general regression and classification problems [22–26]. Furthermore, the functional prior implied by an MLP neural network model converges to a Gaussian 8
process as the number of hidden units increases, provided that the MLP weight priors are chosen suitably [27]. The relationship between the Gaussian processes used in regression and the Gaussian processes used in filtering is that continuous-discrete filtering can be thought of as regression from time t to partially observed states x(t), which we observe through the measurements y(t). The Gaussian process dynamic model is the prior for the functions t 7→ x(t). The optimal filter solves the state estimates recursively at each time instance, and it can be considered the on-line learning solution to the Gaussian process regression problem. However, the filter provides the on-line estimates only forward in time, not at arbitrary time instances, and to compute the state estimates at arbitrary time instances the smoothing step is required. The Gaussian processes used in regression have multidimensional time-variables (i.e., regressors) and for this reason they are often called Gaussian random fields.
3
Description of the Model
3.1 The Long Term Model For long term prediction, a linear dynamic model is likely to be a good approximate model because if we ignore the short term periodicity of the data, the data could be well generated by a locally linear Gaussian process with Gaussian measurement noise. The data seems to consist of lines with suddenly changing derivatives. Thus, it would be reasonable to model the derivative as Brownian noise process, which leads to a white noise model for the second derivative. Using higher derivatives does not seem useful, because the curve consists of a set of straight lines rather than parabolas or other higher order curves. The dynamic model is formulated as a continuous time model, and then discretized to allow for a varying sampling rate, that is, prediction over the missing measurements. The selected dynamic linear model for the long term prediction is the stochastic differential equation model d2 x(t) = w(t), (32) dt2 where w(t) is a continuous-time Gaussian white noise process with moments E[w(t)] = 0 E[w(t) w(t + τ )] = q x δ(τ ).
(33)
This can be written in equivalent discrete form as
x q1,k−1
xk 1 ∆t xk−1 = +
x˙ k
0 1
9
x˙ k−1
x q2,k−1
,
(34)
x x where the process noise, qxk = (q1,k−1 q2,k−1 )T , has zero mean and covariance
Qk−1 =
3
2
∆t /3 ∆t /2 x q , ∆t2 /2 ∆t
(35)
and where ∆t is the time period between samples and q x defines the strength (spectral density) of the process noise. The measurement model is yk = xk + rkx ,
rkx ∼ N(0, σx2 ).
(36)
A quick testing of the long term model produces a smooth curve as shown in Figure 2. It can be seen that the locally linear dynamic model may be a bit too simple, because the residual signal still seems to contain noticeable periodicity. This periodicity can be best seen from the residual autocorrelation in Figure 3. −200
−250
−300
−350
−400
−450 400
410
420
430
440
450
460
470
480
490
500
Fig. 2. Data 400–500 (black) and the result of prediction with the long term model (gray).
3.2 The Short Term Model The short term periodicity of the residual time series {ek : k = 1, ..., N } can be modeled with a time varying autoregressive (TVAR) model [9], in which as an extension to conventional AR models [28], the weights are allowed to vary according to a Gaussian random walk model wk = wk−1 + vkar ek =
X
wi,k ek−i + rkar .
i
10
(37)
1.2
1
0.8
0.6
0.4
0.2
0
−0.2
−0.4 0
10
20
30
40
50
60
70
80
90
100
Fig. 3. Autocorrelation in the residual of the long term prediction model.
The process noise vkar has zero mean and covariance Q = q ar I. The weight vector wk is estimated from the known part of the residual time series. The measurement noise has a 2 ). In this article, we chose to use a second order ARGaussian distribution rkar ∼ N(0, σar model such that the weight vector was two dimensional,
wk =
w1,k w2,k
.
(38)
After the TVAR-model has been estimated from the residual time series data, the final estimation solution is obtained from dk =
X
wi,k dk−i + vkp
i
ek = dk + rkp ,
rkp ∼ N(0, σp2 ),
(39)
where the process noise vkp has variance q p . The final signal estimate is then given as yˆk = xˆk + dˆk , where xˆk is the estimate produced by applying Kalman smoother to the long term model, and dˆk is produced by the short term model. In practice only the distributions of weight vectors wk are known, not their actual values, and in order to use the model (39) we would have to integrate over these distributions at every time step. In this article we have used a common approach, where this integration is approximated by using the most likely estimate of the weight vector time series with this single estimate regarded as being known in advance. In classical statistical signal processing 11
this estimate is calculated by linear least squares (see, e.g., [28]). Because our weight vector is allowed to vary in time, in this case the corresponding estimate is produced by applying the Kalman smoother to the model (37).
3.3 The Prediction Method The long term prediction is done in two steps: (1) Run the Kalman filter over the data sequence and store the estimated means and covariances. Predict the missing measurements such that the filtering result contains estimates also for the missing steps. (2) Run the Kalman smoother over the Kalman filter estimation result, which results in the smoothed (MAP) estimate of the time series including the missing parts. The short term prediction consists of four steps: (1) Run the Kalman filter over the residual sequence with the model (37) in order to produce a filtering estimate of the TVAR weight vectors. Predict the weights over the missing parts. (2) Run the Kalman smoother over the Kalman filter estimation result above, which results in a smoothed (MAP) estimate of the weight time series including the missing parts. (3) Run the Kalman filter over the residual sequence with the model (39) in order to produce a filtering estimate of the short term periodicity. The periodicity is also predicted over the missing parts. (4) Run the Kalman smoother over the Kalman filter estimation result above, which results in a smoothed (MAP) estimate of the periodicity time series including the missing parts. Due to the Gaussian random walk model of the weights the short term model potentially has a large effective number of parameters. A simple error minimization procedure with respect to the noise parameters (e.g., Maximum Likelihood) would lead to a badly overfitted estimation solution. By applying cross-validation we can maximize the predictive performance and avoid the overfitting.
4
The Original Results
4.1 Selection of Measurement Noises The long term measurement noise strength can be approximated by looking at a short time period of the curve. If we assume that we would approximate it with a dynamic linear model, we can approximate the standard deviation of the model’s measurement noise by looking at 12
the strengths of the residuals. The selected variance of the noise was σx2 = 102 , which fits to the observed residual as can be seen in the Figure 2 quite well. The choices of the measurement noises both in the long and the short term models can be done, for example, by visual inspection, because the exact choice of the noise strengths is not crucial. In fact, the choice does not matter at all when the cost function of the CATS competition is considered, because in this case the selection of measurement noise strength is dependent on the selection of the process noise strength in all the models. The process noise strength is selected based on cross-validation, which implicitly corrects also the choice of the measurement noise strength. By visual inspection the suitable measurement noise for 2 the TVAR-estimation model (37) was σar = 12 . Because we are only interested in the missing parts of data in prediction with the model (39), the best way to do this is to follow the measurements exactly whenever there are measurements and use the TVAR-model for prediction only when there are no measurements. This happens when the measurement noise level is set to as low as possible and the process noise is set to a moderate value. Our choice for the measurement noise level in model (39) was σp2 = 10−9 .
4.2 Cross-Validation of The Process Noises
The process noise parameters q x and q ar were selected using a decision theoretic approach by minimizing the expected cost, where the cost function was the target error criterion. The expected cost can easily be computed by cross-validation, which approximates the formal Bayes procedure of computing the expected costs. Cross-validation methods for model selection have been proposed by several authors: for early accounts see [29,30] and for a more recent review see [31,32]. [33] and [34] discuss how cross-validation approximates the formal Bayes procedure of computing the expected utility of using a model for predictions. Based on the cross-validation, the best process noises were q x = 0.14 q ar = 0.0005.
(40)
These values were based on cross-validation over a range of values, which was selected in advance. However, it later turned out that this range could have been selected better (see next Section). As discussed in the previous section, the only requirement for the selection of the process noise q p is that it should be high enough. Because the measurement noise was chosen to be very low, our choice was q p = 1. 13
4.3 The Original Prediction Results
Figure 4 shows the estimated TVAR-coefficients for each time instance. It can be seen that the weights vary a bit over time, but the periodic short term process seems to be quite stationary.
1.5 w1 w2 1
0.5
0
−0.5
−1
0
500
1000
1500
2000
2500
3000
3500
4000
4500
5000
Fig. 4. Estimated filter coefficients for the TVAR-model.
Figures 5, 6, 7, 8 and 9 show the results of predicting over the missing intervals. It can be seen that on the missing intervals the short term model differs from the long term model only near the measurements and the combined estimate is closest to the long term prediction in the middle of the prediction period. The result is intuitively sensible, because when we are going away from the measurements, we have less information about the phase of the local periodicity, and it is best just to guess the mean given by the long term model. 14
The following mean squared errors were obtained by the method:
3000 2000 X X X 1 1000 2 2 (yt − yˆt )2 (yt − yˆt ) + (yt − yˆt ) + E1 = 100 t=981 t=2981 t=1981
+
4000 X
t=3981
(yt − yˆt )2 +
5000 X
t=4981
(yt − yˆt )2 = 408
2000 X X 1 1000 E2 = (yt − yˆt )2 (yt − yˆt )2 + 80 t=981 t=1981
+
3000 X
t=2981
(yt − yˆt )2 +
4000 X
t=3981
(41)
(yt − yˆt )2 = 346.
The error E1 was the actual CATS competition objective, and the approach described in this section gave the lowest error in the competition [2]. The second error criterion was used in further analysis on the different methods in [2].
160
140
120
100
80
60
40
20
0 950
960
970
980
990
1000
1010
1020
1030
1040
1050
Fig. 5. The original prediction over missing data at 981 – 1000. The gray line is the true signal, the dashed line is the long term prediction result, and the black line is the combined long and short term prediction result.
15
500
450
400
350
300
250 1950
1960
1970
1980
1990
2000
2010
2020
2030
2040
2050
Fig. 6. The original prediction over missing data at 1981 – 2000. The gray line is the true signal, the dashed line is the long term prediction result, and the black line is the combined long and short term prediction result.
5
Improved Results
5.1 Extended Cross-Validation of Process Noises Further analysis of the cross-validation results of the original prediction competition indicated that if we had used a larger range of possible noise levels in the cross-validation, we would have obtained a better prediction result. Extending the cross-validation to zero noise levels reveals that based on the cross-validation the following parameters are better than the original ones used in the competition: q x = 0.14 q ar = 0.
(42)
The difference to the original parameters is that the TVAR model process noise level is exactly zero, not only almost zero as in the original model. This means that it is better to use a stationary AR-model, not a time-varying AR model in prediction. Fitting the AR model to the data with the cross-validated noise parameters resulted in the following ARparameters: w1 = 0.6089 w2 = −0.1517. 16
(43)
140 120 100 80 60 40 20 0 −20 −40 −60 2950
2960
2970
2980
2990
3000
3010
3020
3030
3040
3050
Fig. 7. The original prediction over missing data at 2981 – 3000. The gray line is the true signal, the dashed line is the long term prediction result, and the black line is the combined long and short term prediction result.
The error criteria are also better than in the original prediction:
2000 3000 X X X 1 1000 E1 = (yt − yˆt )2 + (yt − yˆt )2 + (yt − yˆt )2 100 t=981 t=1981 t=2981
+
4000 X
t=3981
(yt − yˆt )2 +
5000 X
t=4981
(yt − yˆt )2 = 381
2000 X X 1 1000 (yt − yˆt )2 (yt − yˆt )2 + E2 = 80 t=981 t=1981
+
3000 X
t=2981
(yt − yˆt )2 +
4000 X
t=3981
(44)
(yt − yˆt )2 = 312.
5.2 The Improved Prediction Results
Figures 10, 11, 12, 13 and 14 show the results of predicting over the missing intervals with the improved method. The difference in the result is that in the improved prediction the AR model seems to get slightly less weight and the long term prediction dominates more. 17
350
300
250
200
150
100
50 3950
3960
3970
3980
3990
4000
4010
4020
4030
4040
4050
Fig. 8. The original prediction over missing data at 3981 – 4000. The gray line is the true signal, the dashed line is the long term prediction result, and the black line is the combined long and short term prediction result.
6
Conclusions
6.1 Summary of the Results
In this article we have described the winning solution to the CATS time series prediction competition. The solution is based on applying the classical Kalman smoother method to estimating the long term and short term statistical models for the CATS benchmark time series. The good prediction performance is likely due to that the long term prediction gives a very good overall approximation of the signal and the short term prediction catches the local periodicity ignored by the long term model. We also showed that the original prediction results can improved by simplifying the model, namely by removing the time-dependence from the AR model. This model choice would have turned out also in the original cross-validation if we had used a bit larger parameter range in the cross-validation. Although all the used models were linear (and dynamic) in nature they seem to model this non-linear time series well. The good performance is not surprising, because the long term Gaussian process model is very much related to the Gaussian processes which have obtained good results in Bayesian non-linear regression. The short term prediction model is also a Gaussian process model, but of the type which is more common in the signal processing 18
60 40 20 0 −20 −40 −60 −80 −100 −120 4900
4910
4920
4930
4940
4950
4960
4970
4980
4990
5000
Fig. 9. The original prediction over missing data at 4981 – 5000. The gray line is the true signal, the dashed line is the long term prediction result, and the black line is the combined long and short term prediction result. 160
140
120
100
80
60
40
20
0 950
960
970
980
990
1000
1010
1020
1030
1040
1050
Fig. 10. The improved prediction over missing data at 981 – 1000.
context. It could be possible that by using some kind of non-linear state space models (filtering 19
500
450
400
350
300
250 1950
1960
1970
1980
1990
2000
2010
2020
2030
2040
2050
Fig. 11. The improved prediction over missing data at 1981 – 2000. 140 120 100 80 60 40 20 0 −20 −40 −60 2950
2960
2970
2980
2990
3000
3010
3020
3030
3040
3050
Fig. 12. The improved prediction over missing data at 2981 – 3000.
models) the prediction results would be better, but it is very hard to judge what kind of model really is the best. Using more complex models would restrict the generality of the approach and even though some specific models could improve the results with this particular time series, finding generally better models than the classical Gaussian process 20
350
300
250
200
150
100
50 3950
3960
3970
3980
3990
4000
4010
4020
4030
4040
4050
Fig. 13. The improved prediction over missing data at 3981 – 4000.
60 40 20 0 −20 −40 −60 −80 −100 −120 4900
4910
4920
4930
4940
4950
4960
4970
4980
4990
5000
Fig. 14. The improved prediction over missing data at 4981 – 5000.
models is difficult. 21
Acknowledgments The authors would like to thank Toni Tamminen for helpful comments.
References [1] S. S¨arkk¨a, A. Vehtari, J. Lampinen, Time series prediction by Kalman smoother with cross validated noise density, in: Proceedings of the International Joint Conference on Neural Networks, 2004, pp. 1653–1658. [2] A. Lendasse, E. Oja, O. Simula, Time series prediction competition: The CATS benchmark, in: Proceedings of IJCNN 2004, 2004. [3] R. E. Kalman, A new approach to linear filtering and prediction problems, Transactions of the ASME, Journal of Basic Engineering 82 (1960) 34–45. [4] A. H. Jazwinski, Stochastic Processes and Filtering Theory, Academic Press, 1970. [5] Y. Bar-Shalom, X.-R. Li, T. Kirubarajan, Estimation with Applications to Tracking and Navigation, Wiley Interscience, 2001. [6] R. E. Kalman, Contributions to the theory of optimal control, Boletin de la Sociedad Matematica Mexicana 5(1) (1960) 102–119. [7] R. F. Stengel, Optimal Control and Estimation, Dover Publications, Inc., 1994. [8] P. Maybeck, Stochastic Models, Estimation and Control, Volume 3, Academic Press, 1982. [9] M. West, J. Harrison, Bayesian Forecasting and Dynamic Models, Springer-Verlag, 1997. [10] Y. C. Ho, R. C. K. Lee, A Bayesian approach to problems in stochastic estimation and control, IEEE Transactions on Automatic Control 9 (1964) 333–339. [11] R. L. Stratonovich, Conditional Markov Processes and Their Application to the Theory of Optimal Control, American Elsevier Publishing Company, Inc., 1968. [12] I. Karatzas, S. E. Shreve, Brownian Motion and Stochastic Calculus, Springer, 1991. [13] B. Øksendal, Stochastic Differential Equations: An Introduction with Applications, Springer, 2003. [14] A. Gelb (Ed.), Applied Optimal Estimation, The MIT Press, 1974. [15] M. S. Grewal, A. P. Andrews, Kalman Filtering, Theory and Practice Using MATLAB, Wiley Interscience, 2001. [16] R. E. Kalman, R. S. Bucy, New results in linear filtering and prediction theory, Transactions of the ASME, Journal of Basic Engineering 83 (1961) 95–108.
22
[17] H. E. Rauch, F. Tung, C. T. Striebel, Maximum likelihood estimates of linear dynamic systems, AIAA Journal 3(8) (1965) 1445–1450. [18] N. Wiener, Extrapolation, Interpolation and Smoothing of Stationary Time Series with Engineering Applications, John Wiley & Sons, Inc., New York, 1950. [19] H. L. Van Trees, Detection, Estimation, and Modulation Theory Part I, John Wiley & Sons, New York, 1968. [20] G. Christakos, Random Field Models in Earth Sciences, Academic Press, 1992. [21] S. Banerjee, B. P. Carlin, A. E. Gelfand, Hierarchical Modelling and Analysis for Spatial Data, Chapman Hall/CRC, 2004. [22] A. O’Hagan, Curve fitting and optimal design for prediction (with discussion), Journal of the Royal Statistical Society. Series B (Methodological) 40(1) (1978) 1–42. [23] C. K. I. Williams, C. E. Rasmussen, Gaussian processes for regression, in: D. S. Touretzky, M. C. Mozer, M. E. Hasselmo (Eds.), Advances in Neural Information Processing Systems 8, MIT Press, 1996. [24] D. Barber, C. K. I. Williams, Gaussian process for Bayesian classification via hybrid Monte Carlo, in: M. C. Mozer, M. I. Jordan, T. Petsche (Eds.), Advances in Neural Information Processing Systems 9, MIT Press, 1997. [25] D. J. C. MacKay, Introduction to Gaussian processes, in: C. M. Bishop (Ed.), Neural Networks and Machine Learning, Springer-Verlag, 1998, pp. 133–165. [26] R. M. Neal, Regression and classification using Gaussian process priors (with discussion), in: J. M. Bernardo, J. O. Berger, A. P. Dawid, A. F. M. Smith (Eds.), Bayesian Statistics 6, Oxford University Press, 1999, pp. 475–501. [27] R. M. Neal, Bayesian Learning for Neural Networks, Springer, 1996. [28] M. H. Hayes, Statistical Digital Signal Processing and Modeling, John Wiley & Sons, Inc., 1996. [29] M. Stone, Cross-validatory choice and assessment of statistical predictions (with discussion), Journal of the Royal Statistical Society. Series B (Methodological) 36(2) (1974) 111–147. [30] S. Geisser, The predictive sample reuse method with applications, Journal of the American Statistical Association 70(350) (1975) 320–328. [31] A. E. Gelfand, D. K. Dey, H. Chang, Model determination using predictive distributions with implementation via sampling-based methods (with discussion), in: J. M. Bernardo, J. O. Berger, A. P. Dawid, A. F. M. Smith (Eds.), Bayesian Statistics 4, Oxford University Press, 1992, pp. 147–167. [32] J. Shao, Linear model selection by cross-validation, Journal of the American Statistical Association 88(422) (1993) 486–494. [33] J. M. Bernardo, A. F. M. Smith, Bayesian Theory, John Wiley & Sons, 1994.
23
[34] A. Vehtari, J. Lampinen, Bayesian model assessment and comparison using cross-validation predictive densities, Neural Computation 14(10) (2002) 2439–2468.
Simo S¨ arkk¨ a received the M.Sc. degree from Helsinki University of Technology, Espoo, Finland, in 2000. Currently, he is pursuing the D.Sc. degree with Laboratory of Computational Engineering, Helsinki University of Technology. His research interests are in the area of Bayesian methods in signal processing.
Aki Vehtari received the M.Sc. and D.Sc. degrees from Helsinki University of Technology, Espoo, Finland, in 1997 and 2001 respectively. Currently, he is a senior researcher with Laboratory of Computational Engineering, Helsinki University of Technology. His research interest is Bayesian modeling.
Jouko Lampinen received M.Sc. degree in physics from University of Kuopio, Finland, in 1988 and Ph.D. in information technology from Lappeenranta University of Technology, Finland, in 1993. In 1996 he joined the Laboratory on Computational Engineering, Helsinki University of Technology, where he is now a professor in computational information technology. His current research interests include machine vision and statistical learning, especially Bayesian methods and MCMC techniques.
24