Thus, we think of the con guration as a node in a graph, ..... 2Americans of a certain generation may think of \Cap'n Crunch Secret Decoder Rings". 10 ...
Cellular Automata and the Sciences of Complexity (part II) Howard Gutowitz Laboratoire d'Electronique Ecole Sup�erieure de Physique et Chimie Industrielles 10 rue Vauquelin 75005 Paris and The Santa Fe Institute 1399 Hyde Park Road Santa Fe, NM 87501 November 1995 Abstract
This is the nal half of a review of selected problems in the theory of cellular automata.
1
Contents 1 State Transition Graphs 2 Cryptography 3 Suggested Reading
3 9 17
2
1
State Transition Graphs
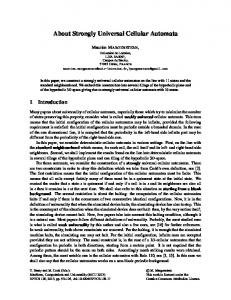
In the rst half of this article, we looked at the behavior of cellular automata on in nite lattices. In this nal half we will examine some of the properties of CA acting on nite systems, and trace their relationships with properties of in nite-sized systems. Consider a one-dimensional cellular automaton operating on periodic lattices of cells each having two states. If the size of the periodic lattice is s, then there are 2s possible con gurations of cell states on the lattice. Each con guration maps to a new con guration under the action of the cellular automaton rule. Thus, we think of the con guration as a node in a graph, with an out-going arc leading to its successor con guration. As the number of possible con gurations is nite, any initial con guration must map eventually to a temporally periodic cycle. Most cellular automata are irreversible. That is, some con gurations have more than one possible ancestor, so the evolution cannot be run deterministically backward in time. For these rules the state space (the set of con gurations on the lattice) is thus organized into a collection sheets, each containing a forest of trees rooted on a cycle. The leaves of the trees are the con gurations which have no preimages, the so-called Gardens of Eden. In the opposite extreme, con gurations on cycles have preimages in nitely far back in time. Con gurations on the branches of the trees have intermediate length histories. One way to characterize cellular automata, then, is by the shape of their transient trees. To make a connection back to in nite systems, one can study how these shapes in the limit of size tending to in nity. For small systems, the state-transition graphs of cellular automata can be represented by a diagram ( gure 1). To produce these diagrams, a random initial condition is chosen and iterated until it entered a temporal cycle. Each con guration is represented as a point, and the temporal cycle is show as a ring of points in the center of the diagram. In the next largest concentric ring are show the preimages of the con gurations on the cycle, connected to their image by a line segment. The preimages of these are shown in the next concentric circle, and so on. It is di�cult to draw conclusions concerning the ultimate shape of statetransition graphs from diagrams such as shown in gure 1. The structure of small systems tends to be dominated by features which result from the interaction of number-theoretic properties of the system size with properties 3
Figure 1: State Transition Diagrams State transition diagrams of nearest-neighbor rules 30, 22, and 54. These are partially linear, chaotic, and critical (complex) respectively. The system size is 20. These diagrams were generated using a program of A. Wuensche [20, 21]. of the rule table. Large systems, on the other hand, contain too many states to be conveniently displayed in a single image. Nonetheless, gure 1 clearly shows that some rules produce structures which are composed of long, bare trees, while others are composed almost exclusively of leaves. Most have some intermediate structure.
Transients and cycles. The most evident feature of a state transition
graph is the size of its base cycle and transient trees. A number of studies have aimed to discover laws describing how the size of these features scales with the size of the lattice on which the cellular automaton operates. It appears generally that transient and cycle lengths are constant for simple rules, exponential for chaotic rules, and power-law (or some more exotic scaling) for complex rules. Some evidence [7] suggests that transients and cycles for a given chaotic rule normally scale following the same law, while complex rules may exhibit features which scale in di�erent ways. One way to understand the origin of these scaling laws is to look at the distribution of transient or cycle lengths for a xed system size. Figure 2 shows a space-time diagram for two rules, 1) a chaotic rule, nearest-neighbor rule 22, and 2) a complex rule, next-nearest neighbor rule 20. Below each diagram is a plot of the distribution of transient times. The chaotic rule produces a single-peak distribution. The shape of the distribution does not change as the system size increases, so the all statistics of the distribution: average, median, maximum and so on, scale in the same way with system 4
size. By contrast, the long tails characteristic of the rule 20 transient time distribution lead to di�erent scaling behaviors depending on which statistic is chosen. The maximum transient time scales linearly with respect to system size. This time is controlled by the time taken for information, in the form of gliders, to ow across the entire system. The median transient time, on the other hand, grows only logarithmically with system size. Most initial con gurations tend rapidly to the 0 con guration, or to a con guration which contains but a single glider. In these cases, there is e�ectively no information
ow across the system during the transient. The average transient time re ects a melange of these e�ects. On small systems (