in the downtown area, is characterized by its full of intersections. ..... In addition to three lines of Metro Rapid Transit (MRT) rail system, there are more than 400.
10 Cellular Automata for Bus Dynamics Ding-wei Huang1 and Wei-neng Huang2 Department of Physics, Chung Yuan Christian University Taiwan
1. Introduction Recently, traffic dynamics has attracted much attention from physicists (Maerivoet & De Moor, 2005; Chowdhury et al., 2000; Helbing, 2001). From 2005 to 2006, more than fifty articles on various topics of traffic research had been published in the physics journal Physica A alone. With a keyword search in the journal Physica A, there were only 7 papers related to traffic dynamics in the publication of 2004. In 2005, the number increased to 17; the number further advanced to 36 in both 2006 and 2007. One of the research interests concerns the intrinsic fluctuations of the dynamics. For the highway system, the dynamics could be simple and deterministic; each vehicle is supposed to follow its preceder moving smoothly down the road. As vehicular density increases, however, a small fluctuation in one of the headways will lead to instability of the whole system. The congestion emerges inevitably without any specific causes, such as accidents or bottlenecks. One of the research interests in highway traffic is to provide a better understanding of the so–called phantom jam (Treiterer, 1975). In contrast to the highway traffic, the city traffic is much more dynamic and complicated. Further considerations such as intersections and pedestrians should be included, e.g., traffic from different directions (Biham et al., 1992), operation of traffic lights (Huang & Huang, 2003b), and the interaction with pedestrians (Jiang et.al, 2006). It is interesting to note that the fluctuations can be nontrivial even in the case of a single vehicle (Nagatani, 2001b; Nagatani & Yoshimura, 2002; Nagatani, 2002c). The limited roadways are shared by more vehicles with all different itineraries. Within the city, vehicles are not expected to move smoothly down the road. At each intersection, pedestrians and vehicles from different directions would have to take turns to use the roadway or to yield to others. And the city layout, especially in the downtown area, is characterized by its full of intersections. Quite obviously, the bus transportation to replace numerous passenger cars and the traffic lights to regulate traffic at intersections are two vital ingredients to the city traffic. We present a simple cellular automaton model to study the typical bus dynamics in a modern city. At the first stage, the nontrivial fluctuations are prescribed by the stochastic moving of bus interacted with the stochastic arrival of passengers. As passengers increase, the bus schedule shows a clear transition. Both numerical and analytical results are presented. The divergence of bus schedule can be taken as an analogy to the gridlock of 4-way traffic. We also comment on the strategy to keep a stable schedule. At the second stage, we examine the bus schedule interrupted by the traffic lights. We analyse the city buses time headway distribution and compare to the real time headway measurements. Since experimental data shows neither a smooth nor a random distribution,
220
Cellular Automata - Simplicity Behind Complexity
a mean–field theory with effects of traffic lights is developed to explain the peculiarity. It is shown that a smooth distribution can be modified significantly by the operation of traffic lights, and matches the experimental data characteristics well. It is therefore concluded that the posted average time-headway is of not much help for the passengers expecting the next bus at the bus stop.
2. Dynamics of a cyclic bus First, we focus on an interesting case where a cycling bus moves along a closed route and interacts with the passengers waiting to get on the bus. We propose a cellular automaton model to study the fluctuations of the dynamics. Traffic dynamics does not involve fundamental forces of nature. Rather, the emergent phenomena can be taken as the collective behaviors involving human decisions. The basic researches of traffic dynamics are not aimed to reveal the fundamental interactions behind the dynamics, but to have an effective theory to capture the essence of phenomena. As a result, the same phenomena might be described in different theories by different languages. It would be interesting to compare these different theories and see how they are complementary for each other. There are various types of models being proposed in recent years. Judging by intuitions, the optimal velocity models (Bando et al., 1995) and the cellular automaton models (Schreckenberg et al., 1995) are most easily understood. These models are built on the microscopic behavior of each individual vehicle, which is governed either by ordinary differential equations or by operational rules. To the other end, one can also have a macroscopic theory, where the individual vehicles become irrelevant. The most popular one use the analogy to hydrodynamics described by partial differential equations (Kerner & Konhäuser, 1993). The details of each trajectory are smeared to have a macroscopic density and velocity field. More recently, a new approach was proposed. The schedule of an urban bus is taken as the basic variable. The recurrence schedule is described as a piecewise nonlinear map (Nagatani, 2001b; Nagatani, 2002c). In statistical physics, the correspondence between microscopic and macroscopic descriptions is always fascinating. The relationship between optimal velocity model and hydrodynamic model had been reported (Berg et al., 2000). In this section, we will explore the correspondence between cellular automata and nonlinear map. We study the dynamics of a recurrent bus by a cellular automata. The model will be introduced in the following. Both numerical and analytical results are presented. We compare the results with previous findings from nonlinear map. The abrupt divergence can be reproduced and understood. However, we find that the critical value was overestimated in the nonlinear map. We also comment on a misleading strategy to stabilize the bus schedule. 2.1 Bus route model
We investigate the dynamics of a cycling bus with a cellular automata. The traveling bus is taken as a particle hopping along a discrete lattice periodically. Consider a cyclic bus route consists of M stops; at each bus stop, the passengers arrive at a rate γ. As a bus hops along the route, the hopping rate p is strongly influenced by the number of passengers N waiting at each stop. When N increases, p decreases accordingly to prescribe a delayed bus. In the original bus route model (O’Loan et al., 2000), there was no such a dependence. Later, a linear dependence was considered (Nagatani, 2002b). Subsequently, a much stronger dependence
221
Cellular Automata for Bus Dynamics
was proposed (Nagatani, 2002c). Here, we adopt a simple quadratic form, p=
1 . 1 + aN 2
(1)
As a naive scaling of ( a · γ2 ) is expected, we assume a = 1 without loss of generality. In the model, there are only two parameters M and γ. When there is no passenger to delay the hopping, γ = 0, the bus completes the route at a fixed schedule ΔT = M. The schedule ΔT is understood as the recurrence time of a cyclic bus on the route. As γ increases, ΔT is expected to increase accordingly. When a bus is delayed, there would be more passengers waiting at the bus stop; and as more passengers are accumulated, the bus would be further delayed. Thus, an instability can be expected as γ increases. When γ is larger than the critical value, ΔT diverges, i.e., the bus would never complete the route. With naive thinking, the divergence seems to be unrealistic. One would argue that the bus shall always arrive if you wait long enough. In the mean-field approximation, the stochasticity is suppressed. With a schedule of ΔTi , the average number of passengers waiting at each bus stop is (γ · ΔTi ) and the next recurrence bus would spend an average time [1 + (γ · ΔTi )2 ] there. Thus we obtain the following nonlinear map of a single variable ΔT, � � (2) ΔTi+1 = M 1 + (γ · ΔTi )2 , where the subscripts of ΔT denote the recurrence index. In this mean-field theory, ΔT diverges as γ increases. The critical value can be obtained as γ>
1 . 2M
With a small γ, the stable bus schedule is as following � 1 − 1 − 4γ2 M2 . ΔT = 2γ2 M
(3)
(4)
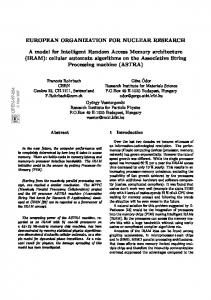
A scaling of ( M · γ ) is also observed. In the limit of γ → 0, the above analytic formula reproduces the fixed point of ΔT = M; in the other limit of γ → 1/(2M ), ΔT approaches its maximum of (2M ). In between these two limits, ΔT increases smoothly with the increase of γ. In the cellular automaton simulations, the averaged ΔT increases with the increase of γ much faster than the prediction of mean-field theory. Obviously, the maximum at ΔT = 2M cannot be confirmed by numerical simulations. The critical value appears to be much less than the mean-field prediction at γ = 1/(2M ), see Fig. 1. With the microscopic simulations, the fluctuations can be easily observed. The typical results are shown in Fig. 2. For each recurrence i, wide fluctuations of ΔTi can be noticed. In some cases, ΔTi diverges and the bus will be delayed indefinitely. In Fig. 3, we plot the probability for a bus to have a stable schedule. A transition in between γ = 0.01 and γ = 0.015 can be observed. With a smaller γ, the bus recurs stably; with a larger γ, the schedule diverges easily. To look into more details, we plot the probability distributions of ΔT at various γ, see Fig. 4. With the above mean-filed results, we would naively expect a simple distribution prescribing
222
Cellular Automata - Simplicity Behind Complexity
an increasing ΔT with an increase γ. In stead, we observe an interesting distribution still dominated by the fixed schedule of ΔT = M. As γ increases, the probability to keep the schedule decreases exponentially. Only when the dominant peak at ΔT = M subsides, the secondary distribution at ΔT > M becomes obvious. For the broad distribution of the secondary structure, the mean of ΔT shifts toward larger values as γ increases. The exponential decay at the fixed schedule ΔT = M can be argued as following. The probability to keep the schedule can be expressed as �
M
∑
N =0
M CN (1 − γ ) M − N γ N
1 · 1 + N2
�M
� � M2 ∼ exp − γ . 2
(5)
The binomial distribution represents the probability of N passengers waiting at a bus stop in a time span of M. With these passengers, the bus has a finite probability to keep the schedule as prescribed in Eq. (1); and the same factor for each bus stop results in the power M. For a large M, the above analytic expression can be well approximated by a single exponential distribution. The numerical simulations can be fairly reproduced, especially for small γ, see Fig. 5. For the secondary structure, the same probability considerations can also be applied to the delay of bus. For example, in a schedule of ΔT = M + 1, the bus must be delayed in one of the M bus stops. The following expression can be obtained, �
� M −1 1 · ∑ 1 + N2 N =0 � �
� M 1 1−γ γ M M− N N × M ∑ C N (1 − γ ) γ · 1− · + , 1 + N2 1 + ( N + 1)2 1 + N2 N =1 M +1
M +1 CN (1 − γ ) M +1− N γ N
(6)
where the first summation represents the probability of no delay in ( M − 1) bus stops, and the delay in one of the bus stop is prescribed by the second summation. The factors in the square brackets ensure that the delay is only for one time step, i.e., the bus moves forward in the next time step, whether new passenger arrives or not. In the former case, we have a probability γ and the passenger number increases to ( N + 1); in the latter case, we have a probability (1 − γ ) and the passenger number remains at N. The above expression gives a simple profile peaked at γ = 0.004, see Fig. 6. Similar combinational probabilities can be applied to the further delay of bus. The numerical simulations can be reproduced. For the further delayed schedule, the peak shifts toward a larger value of γ. 2.2 Discussions
In this section, we propose a cellular automaton model to study the dynamics of a cycling bus. The intrinsic fluctuations in the traffic dynamics are prescribed by the stochastic moving of bus (along the route) coupled with the stochastic arrival of passengers (at the bus stops). We observe the wide fluctuations of the recurrent schedule. When the passengers increase, the schedule diverges suddenly, i.e., the bus was delayed indefinitely and unexpectedly. In reality, such phenomena can be found in the situations where the number of passengers waiting to get on the bus far surpasses the capacity of transportation. Some passengers would eagerly try to push themselves through the bus door but cannot, and the bus will not be able to drive
223
Cellular Automata for Bus Dynamics 100
80
60
ΔT 40
20
0 0
0.005
0.01
0.015
0.02
0.025
0.03
γ Fig. 1. Averaged recurrence schedule ΔT as a function of γ, where M = 20. The dotted line shows the mean-field prediction, which terminates at γ = 1/(2M ) with a maximum ΔT = 2M. 200
Simulation 1 Simulation 2 Simulation 3
150
ΔT 100 i
50
0 0
20
40
60
80
100
i
Fig. 2. Typical fluctuations of schedule ΔTi at each recurrence i, where M = 20 and γ = 0.013. In the simulation 1, the schedule is stable; in the simulation 2, the schedule diverges at i = 69; in the simulation 3, the schedule diverges at i = 39.
224
Cellular Automata - Simplicity Behind Complexity 1.25
1
Ratio
0.75
0.5
0.25
0 0
0.005
0.01
0.015
0.02
0.025
γ
Fig. 3. Ratio of stable schedule as a function of γ, where M = 20. A stable schedule is defined as being able to recur at i = 100 (as simulation 1 in Fig. 2), where the divergence is taken as ΔTi > 10M (as simulations 2 and 3 in Fig. 2).
1
5 Prob. 0.5
0 0.005 0.01
g
30
0.015 0.02 0
40
50
20 10
DT
Fig. 4. Probability distributions of ΔT at various γ, where M = 20. A dominant peak at ΔT = M superimposes on the secondary structure at ΔT > M.
225
Cellular Automata for Bus Dynamics
1
ΔT=M 0.8
Prob.
0.6
0.4
0.2
0 0
0.005
0.01
0.015
0.02
γ Fig. 5. Decay of the primary peak at ΔT = M. The solid line shows the analytical result of a simple exponential distribution, Eq. (5).
0.2
ΔT=M+1 ΔT=M+2 ΔT=M+3 ΔT=M+4
Prob.
0.15
0.1
0.05
0 0
0.005
0.01
0.015
0.02
γ Fig. 6. Profile of the secondary bump at ΔT > M. The solid lines show the analytical results from combinational probabilities.
226
Cellular Automata - Simplicity Behind Complexity
away without properly closing its door. As a result, the indefinite delay emerges inevitably. The situation can be analogy to the gridlock appeared in an intersection where a few vehicles from different directions block each other and all the traffic is stopped indefinitely. We also compare the results with previous finding based on the nonlinear maps, which prescribes an abrupt transition at γ = 1/(2M ). In the cellular automaton simulations, where the fluctuations were properly taken care of, we observe a smoother transition at a much small critical value. In the deterministic mean-field theory, the critical value was overestimated by a factor of two. As the fluctuations play an important role in traffic phenomena, the conjectures based on deterministic theory can be misleading sometimes. For example, a strategy was proposed to avoid the divergent schedule: by skipping a few stops, the bus will be able to keep a stable schedule (Nagatani, 2002c). As shown in this study, the stable schedule can only be reached by limiting the value ( M · γ ). With a fixed γ, i.e., fixed passenger arrival rate, the only option is to reduce the number of stops M. We point out that the conclusion in the above Reference was based on a unrealistic presumption: when the bus skips a stop, those passengers waiting at the bus stop disappear. Thus such an effectively reducing M presumes an effectively reducing γ. The problem remains unsolved, unless we assume that those passengers would all leave the bus stop disappointedly to find other means of transportation whenever the bus skips the stop. Otherwise, there would be more passengers accumulated when the bus recurs later. We find that at a fixed γ, the only feasible strategy to stabilize the recurrent schedule is to add more buses to the route. It is well known that the same instability will lead these buses to bunch together as the passengers increase (O’Loan et al., 1998; Nagatani, 2002a). By instructing the bus drivers to skip a few stops will now keep these buses more or less equal distanced, which would provide an effectively reduced M without presuming a reduced γ. Thus the stable scheme can be restored by the strategy of adding more buses adjoined with skipping a few stops when necessary.
3. Time headway distribution of city buses Public transportation and traffic signal are two important issues of city traffic. In most previous studies, these two issues were often addressed separately. In references (Brockfeld et al., 2001; Huang & Huang, 2003a; Huang & Huang, 2003b; Tan et al., 2004; Toledo et al., 2004; Jiang & Wu, 2005; Nagatani, 2005a; Nagatani, 2005b; Nagatani, 2005c; Jiang & Wu, 2006; Nagatani, 2006a; Nagatani, 2006b; Toledo et al., 2007; Nagatani, 2007a; Nagatani, 2007b; Nagatani, 2007d; Nagatani, 2007e; Nagatani, 2008), the impacts of traffic lights have been studied in some details. Yet the main concern is on the passenger cars, not the public transportation. In references (O’Loan et al., 1998; Desai & Chowdhury, 2000; Nagatani, 2000; Nagatani, 2001a; Nagatani, 2001c; Huijberts, 2002; Nagatani, 2002d; Hill, 2003; Nagatani, 2003a; Nagatani, 2003b; Nagatani, 2003c; Nagatani, 2003d; Nagatani, 2003e; Nagatani, 2006c; Yuan et al., 2007; Nagatani, 2007c), various models for bus transportation have been proposed. Again, most of the research focus on the interactions between bus and passengers, with the operation of traffic lights neglected. In this section, we address these two issues in a framework. We study the bus dynamics influenced by the operation of traffic lights. The public transportation and the passenger vehicles are distinctly different in dynamics. Basically, a passenger car would prefer to have a non–stop journey from its origin to destination, while a bus has to stop at every bus stop to load and unload passengers. To provide a reliable service of public transportation, keeping
227
Cellular Automata for Bus Dynamics
schedule is all important. On every bus stop, the most needed information should be the schedule. From our daily experiences, however, the buses never seem to keep the schedule. For a bus stop posting a 5–minute regular schedule, all too often you would have to wait much longer than 5 minutes for a bus to arrive. And when the buses do arrive, quite often they come in abundance, i.e., arriving one after another. For a passenger expecting a bus every 5 minutes, one might wonder why the buses like to bunch all together. And if it weren’t a strict 5 minutes interval, one might reason that it should at least be a Gaussian–like distribution centered at 5 minutes. But the experience seems to indicate that neither a smooth distribution nor a purely random distribution is the case. In the following, we will attempt to answer this question. We will explore the intrinsic instability of bus schedule and the statistical meaning of this 5–minute interval. Both theoretical analysis and experimental data are presented. Although the traffic phenomena can be observed everywhere, concrete data are limited in the literature. Even the experimental data for the above mentioned phantom jam were only reported very recently (Sugiyama et al., 2008). To our knowledge, we are only aware of the data from Mexican buses (Krbálek & Šeba, 2000; Krbálek & Šeba, 2003). In the following, we present a mean–field theory for the bus schedule interfered by the traffic lights. The experimental data and theoretical analysis are also presented. We reinterpret the data in references (Krbálek & Šeba, 2000; Krbálek & Šeba, 2003) to demonstrate the validity of our theory. 3.1 Mean–field theory
In an ideal world, the buses should keep a perfect schedule. The distribution of time headway can be represented by a Dirac delta function as P (t) = δ(t − T0 ) ,
(7)
where T0 denotes the regular schedule or the time headway, which is understood as the interval between two consecutive buses passing the same location. On the other hand, in a chaotic world, buses are not aware of their mutual positions, i.e., there is no correlation, and the distribution of time headway becomes Poissonian as � � 1 t P (t) = . (8) exp − T0 T0 It describes a high possibility of buses bunching together, because the leading bus tends to take more time to collect more passengers and the following bus gradually catches up. In between these two limits, the Wigner distribution has been proposed to describe the time headway as (Krbálek & Šeba, 2000; Krbálek & Šeba, 2003)
� 32 2 4t2 P (t) = 2 3 t exp − , (9) πT02 π T0 which is normalized to give an expectation value of T0 . This is the case that there is correlation between buses, and their mutual awareness keep them away from bunching together. The three typical distributions are shown in Fig. 7. Now we consider the influence from the operation of a traffic light, which is simply taken as a signal switching periodically between green and red. We denote the duration of green phase and red phase respectively as TG and TR . Basically the traffic light cycle and the bus schedule are of the same order of magnitude, i.e., a few minutes. If it arrived at the intersection in the
228
Cellular Automata - Simplicity Behind Complexity 0.3
Dirac
0.25
Poisson
Probability Density
Wigner 0.2
0.15
0.1
0.05
0
0
2
4
6
8
10
12
14
Time Headway
Fig. 7. Three typical time headway distributions: Dirac delta distribution for a perfect schedule, Poisson distribution for a chaotic schedule, and Wigner distribution in between these two limits. green phase, the bus will move forward uninterruptedly. If it arrived in the red phase, the bus will have to stop at the intersection waiting for the signal to turn green. Accordingly the time headway to the preceding bus is lengthened and the time headway to the following bus is shortened. In such ways, the operation of a traffic light can change the headway distribution significantly. In the following, we derive this changed distribution P � (t) in a mean–field theory. The probability for two buses to bunch together, i.e., a zero time headway, can be written as
� T G 1 P � (0) = dt1 P (0) ( TG + TR ) 0 � � TR � TR (10) dt1 dt2 P (t2 − t1 ) , + 0
t1
where the first and second terms represent the contributions from a bus arriving in the green and red phases, respectively. In the green phase, buses are uninterrupted. The probability of bunching together can be retrospected to P (0), which prescribes the probability of bunching together when the traffic light is absent. In the red phase, the bunching probability can be further enhanced. Two buses are forced to bunch together when they both arrive in the same red phase. In the second term of above formulation, the arriving times of these two buses are denoted by t1 and t2 . The two integrations with the same upper limit at TR ensure that the two buses arrive in the same red phase. Obviously, the buses in an ideal world will not bunch together when the red phase is shorter than the schedule, i.e., TR < T0 . With a Wigner distribution, the buses begin to bunch together noticeably by the operation of a traffic light,
229
Cellular Automata for Bus Dynamics
i.e., P � (0) > 0 while P (0) = 0. In the chaotic world prescribed by the Poisson distribution, the bunching probability is significantly enhanced by the traffic lights. By similar approaches, the distribution for a small time headway t can be written as
� T −t G 1 � P (t) = dt1 P (t) ( TG + TR ) 0 � � TR (11) dt1 P (t + TR − t1 ) , + 0
where again the first and the second terms represent the contributions from buses arriving in the green and the red phases respectively. In the green phase, a bus arrives at t1 ; the following bus is separated by an interval t. The two buses will have no trouble keeping the time headway t if they both arrive in the same green phase. The integration has an upper limit at t1 = ( TG − t) to ensure that the following bus will not be interrupted by the traffic light. In the red phase, a bus arriving at t1 will be delayed by ( TR − t1 ) until the traffic light switches from red to green. Thus a following bus separated by an internal (t + TR − t1 ) originally will be catching up and has a time headway t finally. We note that the limit t → 0 in Eq. (11) does not reproduce the result of Eq. (10). Extra contributions from two buses arriving within the same red phase are taken into account by the double integration in Eq. (10). While to maintain a finite time headway in Eq. (11), the following bus must arrive in the green phase. In the limit t → 0, Eq. (11) only takes into account the contribution from a following bus arriving right at the switching of traffic light. The validity of Eq. (11) is limited by t < TG , which is obvious from the upper limit of the first integration. If the time headway is larger than TG , these two buses cannot pass the intersection within the same green phase. When the traffic light has a long red phase, some of the time headways cannot be observed. Specifically, in the cases of TG < TR , we have P (t) = 0 for TG < t < TR . With the operation of traffic lights, a smooth distribution P (t) will be changed to a discontinuous one P � (t). As the time headway t further increases, the distribution P � (t) is shaped by different mechanisms. For t > TR , the distribution can be written as
� T G 1 P � (t) = dt P (t) ( TG + TR ) TG + TR −t 1 � � TR (12) + dt1 P (t − TR + t1 ) , 0
where both terms are for a bus arriving in the green phase; the first and the second integrations take into account the contributions when the following bus arrives in the green phase and in the red phase respectively. As can be seen, in the first integration, the distribution P (t) has not been modified. With a bus arriving at t1 in the green phase, the following bus separated by a time headway t will pass the same intersection smoothly in the next green phase. Obviously, t1 is lower bounded. If the bus arrived too early in the green phase, a separation of interval t will result in the following bus arriving in the red phase. The validity of Eq. (12) is then set by the lower limit of this integration, i.e., t < ( TG + TR ). In the second integration, the distribution P (t) has been modified. A time headway t is the result when a bus arrives at ( TG + TR − t) in the green phase and the following bus arrives at t1 in the subsequent red phase. As the following bus is delayed by ( TR − t1 ), the time headway is lengthened from (t − TR + t1 ) to t. To have a time headway within the range TR < t < ( TG + TR ), the bus cannot arrive in the
230
Cellular Automata - Simplicity Behind Complexity
red phase. If a bus arrived in the red phase and the following bus arrived in the subsequent green phase, the time headway is too short, as prescribed in Eq. (11), while if the following bus arrived in the next red phase, the time headway will become ( TG + TR ), which is the limit of applying Eq. (12). As the traffic light switches periodically, the modification of P (t) also goes through the same cycle. At the time headway ( TG + TR ), the distribution can be written as
� T G 1 dt1 P ( TG + TR ) P � ( TG + TR ) = ( TG + TR ) 0 � � TR � TR (13) + dt1 dt2 P ( TG + TR + t2 − t1 ) , 0
0
which is basically the extension of Eq. (10) to the next cycle. In the first term, a bus arrives in the green phase and the following bus arrives in the next green phase. In the second term, a bus arrives in the red phase and the following bus arrives in the next red phase. The distribution for an even larger time headway can be obtained similarly. The typical results for the modified Wigner distribution are shown in Fig. 8. The 0.3
Wigner ( T0 = 4 ) 0.25
TG = 2 , TR = 3
Probability Density
TG = 3 , TR = 2 0.2
0.15
0.1
0.05
0
0
2
4
6
8
10
12
14
Time Headway
Fig. 8. Interference of a Wigner distribution by the traffic light. discontinuities at t = TG and t = TR are obvious. In the cases of TG < TR , the distribution is depleted in the range TG < t < TR ; in the opposite cases of TG > TR , the distribution is enhanced for TR < t < TG . The spikes at a multitude of t = ( TG + TR ) are the results of two consecutive buses being both stopped by the red light. This can be taken as a kind of condensation where a small adjustment in the arriving time will make no difference. Similar modifications to the Poisson distribution are shown in Fig. 9. In the following, we will present some experimental data to support these peculiar distributions.
231
Cellular Automata for Bus Dynamics
3.2 Experiment and analysis
In addition to three lines of Metro Rapid Transit (MRT) rail system, there are more than 400 city bus lines in the Taipei metropolitan area, serving 6 million people living in Taipei County and Taipei City, the capital of Taiwan. Most buses operate from early morning to late night, an unusually long day among major cities of the world. This provides an excellent opportunity to observe and analyse all the traffic phenomena. To better observe the effect of traffic lights on time headway distribution, we pick a busy bus line with short schedule interval in the order of traffic light period. The observation was carried out near a typical bus stop on the route 307 of Taipei City Bus. As there are designated bus lanes in most major avenues of Taipei, see Fig. 10, the interactions between buses and passenger vehicles are minimized. As one of the most popular buses, 307 runs between Taipei County and Taipei City separated by Tamsui River, transporting people living on both sides of the river. The whole route takes between 3 and 4 hours to complete, with more than 50 stops along the way. The observation point is about one third from the starting stop on Taipei City side. The departure time for each bus was recorded; the arrival time is unregistered. The data are then converted into the so–called time headway, i.e., the time interval between the departure of two consecutive buses. There are 3210 data points collected during December 2005. Partly owing to the popularity of this bus route, only a slight difference in the weekday rush hours is observed, and all the data are included in the following analysis. The distribution of time headway is shown in Fig. 11. With an average time headway of 4 minutes, the longest interval observed is 25 minutes. The distribution is far from a single peak centered at the averaged time headway. Nor does the distribution resemble a monotonically decreasing curve, which has been proposed by considering the interactions between consecutive buses. The oscillatory behavior is obvious. Such oscillatory patterns can be attributed to the interference from a nearby traffic light. When the traffic light turns red, buses are stopped and accumulated, resulting in the prominent peak 0.3
Poisson ( T0 = 4 )
0.25
TG = 2 , TR = 3
Probability Density
TG = 3 , TR = 2 0.2
0.15
0.1
0.05
0
0
2
4
6
8
10
Time Headway
Fig. 9. Interference of a Poisson distribution by the traffic light.
12
14
232
Cellular Automata - Simplicity Behind Complexity
Fig. 10. Typical Taipei City bus lanes.
0.3
Probability Density
0.25
0.2
0.15
0.1
0.05
0
0
2
4
6
8
10
12
14
Time Headway
Fig. 11. Typical time headway distribution for the route 307 of Taipei City Bus.
233
Cellular Automata for Bus Dynamics
near the zero time headway. As the traffic light switches between green and red alternatively, it acts as a periodic chopper. Certain intervals will not be able to pass through the chopper easily, which results in the several dips in the distribution. A quantitative description from the simple formulation of the last section is shown in Fig. 12. 1
Probability Density
0.1
0.01
0.001
0.0001
0
5
10
15
20
25
Time Headway
Fig. 12. The data of Fig. 11 described by a modified Poisson distribution on a semi-logarithmic scale. The parameters are TG = 1.5, TR = 1.8 and T0 = 3.6 min. With the number of data points, the fluctuations are averaged out, and the distribution represents true behavior, as can be seen more clearly on a semi-logarithmic scale. We do not expect such a naive mean–field approximation to provide an accurate description to the empirical data, yet the characteristic features are well captured. The narrow spikes are the artifact of a continuous theory. With more refined treatment, multiple peaks with a finite width can be expected. We find that such peculiar peaks and dips can also be discerned from the existing data. In references (Krbálek & Šeba, 2000; Krbálek & Šeba, 2003), the time headway distributions are described by smooth curves, a Poisson distribution and a Wigner distribution respectively. The deviations from the smooth curves might be attributed to random fluctuations. On the other hand, it is interesting to note that such deviations can be produced by taking into account of the influences of traffic lights. The results are shown in Figs. 13 and 14. We do not attempt to provide a better fitting. The point is just to emphasize that the drastic highs and lows in the distribution can be attributed to the influences of traffic lights. 3.3 Conclusion
In this section, we study the bus schedule interfered by the operation of traffic lights. The city traffic is often contrasted with the highway traffic. However, they both share a characteristic feature of intrinsic instability. The highway congestion may emerge out of nowhere. Similarly
234
Cellular Automata - Simplicity Behind Complexity 1
Probability Density
0.8
0.6
0.4
0.2
0
0
1
2
3
4
5
Time Headway
Fig. 13. The data of the buses in Puebla (Krbálek & Šeba, 2000; Krbálek & Šeba, 2003). The dotted line shows the Poisson distribution. The parameters are TG = 1, TR = 0.4 and T0 = 1 for the solid line. 1.2
Probability Density
1
0.8
0.6
0.4
0.2
0
0
0.5
1
1.5
2
2.5
3
Time Headway
Fig. 14. The data of the buses in Cuernavaca (Krbálek & Šeba, 2000; Krbálek & Šeba, 2003). The dotted line shows the Wigner distribution. The parameters are TG = 0.9, TR = 0.2 and T0 = 1 for the solid line.
Cellular Automata for Bus Dynamics
235
the city buses may bunch together without obvious cause. The bus schedule can be influenced by all sorts of possibilities. With a simple mean–filed approximation and preliminary measurements, we show that the time headway distribution can be modified significantly by a nearby traffic light. For most public transportation, the buses on a given route are dispatched with a fixed time headway, and this fixed time headway is often provided at every bus stop as the most important information to passengers. However, as buses maneuver around the city, the headways will be modified drastically. The local influences, especially from a nearby traffic light, can be prominent. Thus the headway distribution can be very different for different stop. With this observation, we conclude that the posted time headway conveys little information to the passengers waiting by the bus stop. In most Taipei City bus stops, an intelligent transportation system has been implemented, displaying the location of each bus on the route and the estimated time of arrival. For providing a more useful and reliable information to the passengers, this is the way to go.
4. References Bando, M., Hasebe, K., Nakayama, A., & Shibata, A., & Sugiyama, Y. (1995) Phys. Rev. E51, pp.1035. Berg, P., Mason, A., & Woods, A. (2000) Phys. Rev. E61, pp.1056. Biham, O., Middleton, A. A., & Levine, D. (1992) Phys. Rev. A46, pp.R6124. Brockfeld, E., Barlovic, R., Schadschneider, A., & Schreckenberg, M. (2001) Phys. Rev. E64, pp.056132. Chowdhury, D., Santen, L. & Schadschneider, A. (2000) Phys. Rep. 329, pp.199. Desai, R. C. & Chowdhury, D. (2000) Eur. Phys. J. B15, pp.375. Helbing, D. (2001) Rev. Mod. Phys. 73, pp.1067. Hill, S. A. (2003) Physica A328, pp.261. Huijberts, H. J. C. (2002) Physica A308, pp.489. Huang, D. W. & Huang, W. N. (2003a) Int. J. Mod. Phys. C14, pp.539. Huang, D. W. & Huang, W. N. (2003b) Phys. Rev. E67, pp.056124. Jiang, R., Helbing, D., Shukla, P. K., & Wu, Q. S. (2006) Physica A368, pp.568. Jiang, R. & Wu, Q. S. (2005) Physica A355, pp.551. Jiang, R. & Wu, Q. S. (2006) Physica A364, pp.493. Kerner, B. S. & Konhäuser, P. (1993) Phys. Rev. E48, pp.R2335. Krbálek, M. & Šeba, P. (2000) J. Phys. A 33, pp.L229. Krbálek, M. & Šeba, P. (2003) J. Phys. A 36, pp.L7. Maerivoet, S. & De Moor, B. (2005) Phys. Rep. 419, pp.1. Nagatani, T. (2000) Physica A287, pp.302. Nagatani, T. (2001a) Physica A296, pp.320. Nagatani, T. (2001b) Physica A297, pp.260. Nagatani, T. (2001c) Phys. Rev. E63, pp.036115. Nagatani, T. (2002a) Physica A305, pp.629. Nagatani, T. (2002b) Physica A312, pp.251. Nagatani, T. (2002c) Physica A316, pp.637. Nagatani, T. (2002d) Phys. Rev. E66, pp.046103. Nagatani, T. (2003a) Physica A321, pp.641. Nagatani, T. (2003b) Physica A322, pp.685.
236
Cellular Automata - Simplicity Behind Complexity
Nagatani, T. (2003c) Physica A323, pp.686. Nagatani, T. (2003d) Physica A327, pp.570. Nagatani, T. (2003e) Phys. Rev. E68, pp.036107. Nagatani, T. (2005a) Physica A347, pp.673. Nagatani, T. (2005b) Physica A348, pp.561. Nagatani, T. (2005c) Physica A350, pp.577. Nagatani, T. (2006a) Physica A361, pp.619. Nagatani, T. (2006b) Physica A368, pp.560. Nagatani, T. (2006c) Physica A371, pp.683. Nagatani, T. (2007a) Physica A374, pp.419. Nagatani, T. (2007b) Physica A377, pp.651. Nagatani, T. (2007c) Physica A377, pp.661. Nagatani, T. (2007d) Physica A380, pp.503. Nagatani, T. (2007e) Physica A386, pp.381. Nagatani, T. (2008) Physica A387, pp.1637. Nagatani, T. & Yoshimura, J. (2002) Physica A316, pp.629. O’Loan, O. J., Evans, M. R., & Cates, M. E. (1998) Phys. Rev. E58, pp.1404. Schreckenberg, M., Schadschneider, A., Nagel, K., & Ito, N. (1995) Phys. Rev. E51, pp.2939. Sugiyama, Y., Fukui, M., Kikuchi, M., Hasebe, K., Nakayama, A., Nishinari, K., Tadaki, S., & Yukawa, S. (2008) New. J. Phys. 10, 033001. Tan, H. L., Zhang, C. Y., Kong, L. J., & and Liu, M. R. (2004) Int. J. Mod. Phys. B18, pp.2658. Toledo, B. A., Munoz, V., Rogan, J., Tenreiro, C., & Valdivia, J. A. (2004) Phys. Rev. E70, pp.016107. Toledo, B. A., Cerda, E., Rogan, J., Munoz, V., Tenreiro, C., Zarama, R., & Valdivia, J. A. (2007) Phys. Rev. E75, pp.026108. Treiterer, J. (1975) Ohio State Technical Report No. PB 246 094. Yuan, Y. M., Juan, R., Wu, Q. S., & Wang, R. L. (2007) Int. J. Mod. Phys. C18, pp.1925.