Socio-economic and complex physical systems share several important features. ... (2007). In this chapter we provide an overview of cellular automata modeling ...
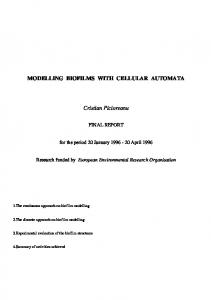
16 Cellular Automata Modelling of the Diffusion of Innovations Gergely Kocsis and Ferenc Kun Department of Theoretical Physics, University of Debrecen H-4010 Debrecen, P.O.Box: 5 Hungary
1. Introduction Socio-economic and complex physical systems share several important features. Both are composed of a large number of interacting components where in most of the cases the precise form of the interaction is not known. In spite of this microscopic complexity, on the macro level such a state emerges which can be described in terms of a few parameters. Due to the collective behavior of the constituents of the system a universal macroscopic behavior emerges which does not depend anymore on the microscopic details of the system Helbing (2009). Technological development of socio-economic systems exhibits such universal aspects: irrespective of the field of economy, type of industry, technologies always evolve through cycles of birth, selection, disappearance and birth of the successor technology. The selection is made by the market which tests the capabilities of a technology and when it proves to be insufficient under the new circumstances, it is substituted by a newly born technology. The cyclic development of technologies gives rise to a logistic growth which can be described by only two parameters. Specific features of a given technology determine solely the value of the two parameters Rogers (1962). During the last three decades efficient theories and models have been developed in statistical physics to describe the emergent behavior of complex systems. Methods have been worked out which can grasp the transition from microscopic complexity to the universal macroscopic behavior Helbing (2009); Sornette (2000). The theory of phase transitions, the renormalization group theory, the concept of self-organized criticality, dynamic critical phenomena and stochastic processes, and the theory of networks have been proven to be successful for complex system resulting in multitude of application in socio-dynamics as well Castellano et al. (2009); Gilbert (2008); Mahajan & Peterson (1985). Cellular automata (CA) have been introduced in the field of socio-dynamics as an efficient approach for bottom-up models where individuals (agents) are the basic units of the system. Agents are described by a set of attributes, furthermore, they interact with each other and their social environment. For the diffusion of innovations the most important feature is that agents make decisions based on the influence they receive through word-of-mouth communications with their social partners and through some external information source (mass media). Recent investigations have shown that decision making in agent based models can be well described
338
Cellular Automata - Simplicity Behind Complexity
by a set of rules and can be efficiently implemented in the framework of cellular automata Gilbert (2008); Kocsis & Kun (2008); Kun et al. (2007). In this chapter we provide an overview of cellular automata modeling approaches to socio-economic systems with emphasis on the spreading of innovations. After summarizing the basic ingredients of CA we focus on the recent developments in the computer modeling of socio-economic systems. We outline the philosophy of bottom-up approaches of agent based models and describe typical set of CA rules which have been proven successful during the past years in the field. As a specific example, we present in details cellular automata for the spreading of those type of technological innovations whose usage requires so-called compatibility. These are for instance telecommunication technologies such as mobile phones, where a broad spectrum of mobile phone devices are offered by the market with widely different technological levels. Communication between two individuals, however, is the easiest when they use phones with nearly identical technological levels, since only in this situation they are able to benefit from capabilities such as MMS or Video messaging. We analyze the model analytically then set up CA rules of the model and present results of large scale computer simulations. The chapter is closed by an outlook summarizing possible future perspectives of the field.
2. Bottom-up approaches for the diffusion of innovations Since Johann Louis von Neumann introduced it in order to study living biological systems in 1948 von Neumann (1948), cellular automata modeling has found a broad range of applications in the field of complex systems. The most widespread definition of cellular automata is that a CA is a finite number of finite state cells on a grid, which can change their state in discrete time steps according to the present state of their neighborhood. Usually the cells are placed on a square lattice with periodic boundary conditions such that each cell is affected only by its 4 (von Neumann neighborhood) or 8 (Moore neighborhood) neighbors. Classically the cells can hold two different states represented by 0 and 1. The update of cells’ state is usually performed in a parallel way at the same time for each cell. The way how the state is changed defines the CA rules. Many eye-catching classical CA rules have became famous in the past, with more or less practical usage Wolfram (2002). Based on von Neumann’s basic mathematical concepts, CA models became the basis of the so called simulation games in the 1970s. The most famous example of such games is John Horton Conway’s ”Game of Life” Gardner (1970). In spite of the successful applications of CA in these games, they gained popularity only in the 1980s through the work of Stephen Wolfram, who gave an extensive classification of CA as mathematical models for self-organizing statistical systems Wolfram (2002). Wolfram applied cellular automata to a huge number of scientific areas e.g. biology, physics, sociology, etc. The use of cellular automata in the field of diffusion phenomena tracks back to these times as well Grassberger (1984), however, the effective power of CA in modeling diffusion could only be revealed after the revolutionary growth of computing power in the 1990s. By the end of the century CA simulation of diffusion models became an elementary tool in the field, and till today, in most of the cases CA based simulations represent the basic numerical methods in order to validate the analytical predictions of diffusion models. In order to observe the headway of CA modeling in a more specific field, one can take the case of diffusion of innovations, which has a history going back to the 1960s, but has an ever increasing popularity nowadays as well Guardiola et al. (2002); Helbing et al. (2005); Llas et al. (2003). The first
Cellular Automata Modelling of the Diffusion of Innovations
339
edition of Everett M. Rogers’ pioneering book in 1962 used to be called as the starting point of innovation diffusion related research Rogers (1962). Currently the book is at its fifth edition updated and extended with up to date results and case studies. Besides Rogers’ book one can get an interesting insight into the past and present of innovation diffusion from numerous recapitulatory papers of Mahajan Mahajan & Peterson (1985) or from the work of Castellano et. al. Castellano et al. (2009). In his book, Rogers defines diffusion of an innovation as the process by which that innovation ”is communicated through certain channels over time among the members of a social system”. As a definition of innovation it says ”innovation is an idea, practice, or object that is perceived as new by an individual or other unit of adoption” Rogers (1962). These definitions show that innovation diffusion gathers all the processes where something new spreads over a social system. Cellular automata have successfully been applied to investigate the diffusion of innovations in socio-economic systems. CA approaches in socio-dynamics reflect the bottom-up modeling philosophy, i.e. agents are introduced which represent individuals of the society Gilbert (2008). Agents have to be characterized by a well-defined finite set of variables which in principle should be measurable in sociometric sense. The variables are defined such that they describe up to some extent the rational and irrational (emotional) aspects of agents’ behavior from the viewpoint of the scope of the model (for instance, opinion formation before political election or spread of technologies on the market after new inventions are introduced). Such agent-based models are definitely disordered in the sense that the variables describing agents must have broad variations in the system. The distribution of agents’ properties should again reflect some general tendencies in the society based on sociological surveys. The interaction of agents is rather complex, certainly much more complicated than the interaction of particles in any physical systems. In general, it is very difficult, therefore, to cast the interaction law in a closed mathematical form. For the sake of simplicity, two limiting cases can be formulated: (i ) absolutely rational agent where the interaction means taking a well-defined decision based on the surroundings. Such an interaction-decision rule implies a deterministic time evolution of extended sociodynamic systems starting from an initially disordered state. (ii ) absolutely irrational agent whose decision is perfectly random, the interacting partners can only affect the degree of randomness of the change of agents’ variables compared to the preceding state. Bounded rationality is a decision mechanism which lies between the two extreme cases discussed above. Obviously, this is much more realistic but addresses serious mathematical problems to represent a decision mechanism which captures both deterministic (rational) and probabilistic (irrational or emotional) aspects. Time evolution of the system is obtained by prescribing an appropriate dynamics of the system. The “dynamics” can be formulated in terms of decision rules according to which agents can change their state as time elapses. An important point of such agent-based model constructions of sociodynamics is if the dynamic rule is deterministic where disorder enters only through the disordered initial state of agents’ properties. Such deterministic dynamics can be formulated in terms of cellular automata. The other limiting case is the stochastic dynamics similar to the dynamics of finite temperature systems in physics. Such dynamics can be implemented in the form of Monte Carlo simulations such as importance sampling with the Metropolis algorithm Gilbert (2008). In this Chapter we present a study of the spreading of innovations in socio-economic systems using a bottom-up approach as described above which is implemented in a cellular automata framework. We focus on those technologies where the practical value, the usability
340
Cellular Automata - Simplicity Behind Complexity
or advantages of the technology for the user depends on the number of social partners already using the technology. Telecommunication technologies are of that kind, since a mobile phone is rather useless if there is nobody to call with. The CA rules of the model are based on the cost minimization requirements, i.e. agents can change their technological level if it provides reduction of the communication costs. As a key ingredient we assume that the mechanism of spreading is the copying, i.e. agents purchase products of technologies copying the product of one of their interacting partners. After presenting the details of the model construction we analytically investigate simplified cases then we present results of realistic cellular automata simulations for both regular lattices and complex network topologies of social contacts.
3. Model for the spreading of technologies in socio-economic systems Technological evolution of socio-economic systems is composed of two phenomena Mahajan & Peterson (1985); Rogers (1962); Weidlich (2000): (i) New products, ideas, working methods, emerge as a result of innovations which are then used by the market. (ii) Successful technologies spread in the system resulting in an overall technological progress. One of the key components of this spreading of successful technologies is the copying, i.e. members of the system adopt technologies used by other individuals according to certain decision mechanisms. Decision making is usually based on a cost-benefit balance so that a technology gets adopted by a large number of individuals if the upgrading provides enough benefits Rogers (1962). In the present work we focus on the spreading process assuming that several technologies coexist in the system providing alternative solutions for the same practical problem. We introduce a simple agent-based model of the spreading process restricting the investigations to technologies where “networking” plays a crucial role Rogers (1962), i.e. the technology is used for communication/interaction where a certain compatibility is required. In real life it can be often seen that in some cases less advanced technologies rule the market and they still proliferate even if a new, somehow better technology appears. On the other hand if a large enough number of users start to use a new technology sooner or later the whole community follows them making the older technology disappear. The focus of our study is on finding answers to the questions of what specific criteria have to be fulfilled in order to make a technology successful in the market. 3.1 Cost of communication
In our model we represent the socio-economic system by a set of agents which posses products that may be of different technological levels and use it to cooperate with each other. The technological level of the products (e.g. a mobile phone or any device which can be used for communicating with others) is described by a real variable τ in such a way that more advanced technologies are characterized by a higher value of τ. The technology held by an agent is used for communication/interaction between its social contacts. It is easy to understand that communication is the easiest if the interacting partners have devices with nearly the same technological level. The usage of devices of highly different technological levels may cause difficulties in the interaction which result in additional costs. As a more specific example let us consider the case of SMS communication. Old mobile phones of lower technological level could send SMS messages only with a maximal length of 160 characters, however, for the new ones the allowed length is three times larger. Sending a long message between an old phone and a new one is possible, of course, because we only have to split our text into three parts, but naturally this procedure makes communication much more
Cellular Automata Modelling of the Diffusion of Innovations
341
Fig. 1. Demonstration of the basic ideas of the model construction. Agents use different level technologies (mobile phones) to communicate with each other. The different capabilities of the devices (SMS, MMS, video-phone) induce difficulties, i.e. communication is the easiest between devices of the same technological level (this is indicated by the black lines between agents). The height of the colored rectangle indicates the “technological level” of the device of the corresponding agent. difficult and uncomfortable. In the opposite direction we have to notice that our message will be automatically split up into pieces. Agents using mobile phones are presented in Fig. 1. This simple example clearly illustrates that the source of difficulties is the difference in the technological levels of the devices used for communication and they would not occur if the two partners would use equally advanced technologies. It has to be emphasized that in our modeling approach cost does not only mean the money one has to pay for the services or for the device, but it covers all types of difficulties (including also financial ones) that can affect the quality of the communication (e.g. time, convenience etc.) Kocsis & Kun (2008); Kun et al. (2007). Based on the above arguments it is reasonable to assume that the cost C induced by the communication of agents i and j is a monotonic function of the difference of the technological levels | τi − τj |. For the purpose of the explicit mathematical analysis we consider the most simple functional form and cast the cost of cooperation into the following form Kun et al. (2007) C (i → j) = a| τi − τj |. (1) Equation (1) expresses that having products of different technological levels (having different values of τ) incurs cost, while interaction with devices of the same technological level is cost free. This crude assumption describes a socio-economic system which favors the local communities being at the same technological level. Producers fabricate and introduce new communication devices on the market with the goal to provide solutions of possible problems, difficulties customers may have. This generic tendency of technological development can be captured in the model by setting appropriate values for the multiplication factor a of the cost
342
Cellular Automata - Simplicity Behind Complexity
function Eq. (1). Hence, we assume that the value of a depends on the relative technological level of interacting agents as � a1 , if τi > τj where a1 < a2 (2) a= a2 , if τi < τj which clearly favors the higher technological level of users. As a result of the condition a1 < a2 using a more advanced technology than the surroundings τi > τj implies lower costs compared to the opposite case. Note that as a result of this condition the cost function is not symmetric with respect to agents i and j. This property of C is expressed by the arrow → in the argument so that C (i → j) defines the cost of agent i arising due to the cooperation with agent j which is not equal to the cost of agent j, i.e. C (i → j) �= C ( j → i ). Knowing the cost of interaction between communication partners we can now define the total cost of a given agent in the model system. If agent i has n collaborating partners with technological levels τ1 , τ2 , . . . , τn , the total cost of its collaboration can be obtained by summing up the cost function Eq. (1) over all connections C (i ) =
n
∑ C (i → j ).
(3)
j =1
3.2 Time evolution
In order to reduce their costs, agents are assumed to be able to change their technological level which results in a non-trivial time evolution of the system. Our approach focuses on the spreading of technologies so that agents do not invent new products, the possible level of technologies are determined by the initialization of agents’ characteristics. The driving force of evolution in the system is the tendency that agents try to optimize the cost of their communication reducing the value of C. To achieve this goal, however, they can only adopt/copy technologies choosing the one of their interacting partners C t+1 (i ) = min{C (τ ∈ {τit , τ1t , τ2t , . . . , τnt }},
(4)
where the copy is always executed if it provides cost reduction C t+1 (i ) < C t (i ). It is assumed in the model, that adopting a technology does not induce costs, i.e. no money is required to buy the new products, thus agents can change their technological level anytime if the change provides cost reduction in the future. The financial status of agents, the amount of money, statistics of income in the society do not play any role in the present setup of the model system but of course it can easily be implemented. This rejection-adoption process based on local cost minimization results in the spreading of the adopted technologies while the rejected ones disappear from the system. Our model emphasizes that the key component of the spreading of innovations is the copying with the aim of ensuring compatibility and hence, reduction of the difficulties (cost of communication). Note that in the model there is no intrinsic advantage of using more advanced technologies, the cost is the same independently of the technological level when consensus has been reached Kocsis & Kun (2008); Kun et al. (2007).
343
Cellular Automata Modelling of the Diffusion of Innovations
3.3 Topology of social contacts
For agent based socio-dynamics models it is a crucial point to implement a realistic representation of agents’ social contacts. We apply the Watts-Strogatz rewiring algorithm Watts & Strogatz (1998) to generate complex networks in order to mimic the topological features of the social contacts in real social systems Kocsis & Kun (2008). We start the process with a square lattice of agents with periodic boundary conditions. The rewiring process is performed such that we take every edge on the lattice and remove it with a probability p. After that the connection is re-established between two agents selected randomly with a uniform distribution.
1
-1
ρ(n)
10
p = 0.05 p = 0.1 p = 0.2 p = 0.4
10
-2
-3
10
(a)
2
3
4
5
n
6
7
8
(b)
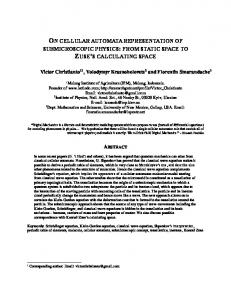
Fig. 2. ( a) Complex networks of agents with long range connections are obtained by rewiring a square lattice. The color of the nodes corresponds to the number of their connections (lighter blue stands for a higher degree). ( b ) Degree distribution ρ( n ) of rewired square lattices for different rewiring probabilities p. Increasing the value of p the distribution gets broders but the position of the maximum does not change.
The rewiring procedure is illustrated by Fig. 2( a). The rewiring process has the consequence that degrees different from 4 occur in the social network with a certain probability and the topology of the system is changed from short ranged (p = 0) to random graphs (p → 1) with long range connections Watts & Strogatz (1998). The distribution ρ of the degree of agents n, i.e. the number of connections of the agents, can be determined analytically as the convolution of a binomial and a Poissonian distribution Albert & Barabasi (2002) ρ(n ) =
min( n− k,k ) �
∑
s =0
� ( pk)n−k−s − pk k (1 − p ) s p k − s , e (n − k − s)! s
(5)
where k denotes the half of the average degree and n is the observed degree. The weights of the binomial and Poissonian components are in a linear relation to the rewiring probability p. Fig. 2(b ) illustrates degree distributions of rewired square lattices, generated with the Watts-Strogatz method using various values of the rewiring probability p. It can be observed
344
Cellular Automata - Simplicity Behind Complexity
that with the increase of p, however the average degree remains constant �n � = 4, the distribution ρ(n ) gets broader, increasing the polydispersity of social contacts. The Watts-Strogatz type complex networks have been proven to be very useful in studying social phenomena Watts (1999). For the spreading of technological development the main limitation we face is that the network has a static structure, it does not evolve during the diffusion process. However, this frozen structure allows us to make an efficient cellular automata implementation of the system.
4. Analytical investigation of the model In order to understand the decision making mechanism, how agents select the technology to adopt, and to reveal which features of the system determine the success of technologies on the market, it is useful to study simplified configurations by analytical calculations. First we analyze the ideal case when all agents communicate with each other irrespective of their spatial distance then we consider isolated local communities of relatively small size. We work out a master equation approach which reveals interesting fixed points in the parameter space of the system governing the long term time evolution of technological levels and the overall technological progress of the system. 4.1 Mean field versus local interaction
As a starting scenario let us assume that the system is composed of a large number of agents which have randomly distributed technological levels in an � τinterval τmin ≤ τ ≤ τmax with a probability density p(τ ) and distribution function P (τ ) = τmin p(τ � )dτ � . If we assume infinite range of interactions, all agents are connected with each other so the cost of interaction of an agent of technological level τ can be cast into the form C ( τ ) = a1
� τ τmin
(τ − τ � ) p(τ � )dτ � + a2
� τmax τ
(τ − τ � ) p(τ � )dτ �
(6)
as a function of τ. In the next time step the agent will change its technological level from τ to that τ ∗ , which minimizes the cost function Eq. (6), i.e. dC/dτ | τ ∗ = 0. The technology optimizing the cost can finally be obtained as the solution of the equation P (τ ∗ ) =
1 , 1 + 1/r
(7)
where r = a2 /a1 is the ratio of the two cost factors a1 and a2 and P is the cumulative probability distribution of the technological levels of agents in the initial configuration. A very interesting outcome of the above calculations is that the result does not depend on the precise value of the cost factors a1 and a2 but only on the the relative amount of advantages r = a2 /a1 more advanced technologies provide with respect to the lower level ones. Since the range of interaction is infinite, all agents make the same decision, thus after a single time step all agents adopt the same technology τ ∗ leading to the end of the evolution of the system. In the special case of r = 1 (when a higher technological level does not provide any advantages), the system adopts the median τ ∗ = m of the initial distribution of technologies p(τ ) Sornette (2000). It is interesting to note that the optimal choice τ ∗ (r ) is a monotonically increasing function of r, however, the most advanced technology τmax is solely chosen in the limiting case limr → ∞τ ∗ (r ) = τmax . At any finite value of r > 1 the large number of agents of low level technologies can force the system to stay at a lower technological level which shows that for
345
Cellular Automata Modelling of the Diffusion of Innovations
the overall technological progress of the system strongly connected social networks may be disadvantageous. As a next step let us focus on what happens in a more complex society at the level of small sized local communities. We consider a finite community of n agents with technological levels τ1 < τ2 < · · · < τn communicating with each other. The cost of collaboration between agent i of technological level τi with the other n − 1 agents reads as C (τi ) = a1
i −1
n
j =1
j = i +1
∑ (τi − τj ) + a2 ∑
(τj − τi ).
(8)
In the next time step the agent decides to adopt that technology which minimizes the cost function Eq. (8) among the n − 1 possibilities. Analytical calculations show again that this decision is solely determined by the value of r, namely, the ith highest technological level is adopted τ ∗ = τi when r falls in the interval i−1 i n − 1. Of course, the actual value of τ ∗ is not determined by the above equations, so that in a system composed of a large number of local communities of agents with randomly distributed τ values a complex time evolution emerges, which is locally governed by the equations Eq. (9) and Eq. (10). 4.2 Master equation approach
As the next step of complexity let us examine the case where only two products are present in the system with different technological levels τ0 < τ1 but social contacts have a realistic topology characterized by the degree distribution function ρ Eq. (5). For simplicity we set the technological levels to τ0 = 0 and τ1 = 1 without loss of generality. At the beginning t = 0 let the fraction of agents having products of the two technological levels be φt0=0 and φt1=0 = 1 − φt0=0 , respectively. Our goal is to work out a master equation approach to determine the long term time evolution of the system varying the ratio of cost factors r in a broad range and the topology of social contacts controlled by the value of the rewiring probability p. Since only two technological levels are present in the system comprehensive description can be given by determining the time dependence of the fraction of agents φt0 and φt1 . We assume that members of local communities are randomly scattered all over the system with a perfect mixing. The assumption implies that any clusterization of agents according to their technological level is omitted in the approach so that no spatial correlations can arise at this level of description. When an agent of technological level τ0 communicates with its social partners, from the cost function Eq. (3) presented in Section 3., we can derive the minimum number k of neighbors having technological level τ1 that make the agent switch to the other technological level τ1 1 k>n ≡ nph , (11) 1+r
346
Cellular Automata - Simplicity Behind Complexity
where ph denotes the minimal fraction of neighbors holding technologies of τ1 = 1 necessary to induce the transition. Based on Eq. (11) we can determine the transition probability p0t →1 that an agent, with technological level τ0 changes to τ1 at time t � � n ∞ n p0t →1 = ∑ ρn ∑ (1 − φt0=0 )k (φt0=0 )n−k . (12) k n k =� np h
Here ρn denotes the degree distribution of the underlying topology and �. represents the ceiling function, i.e. the nearest integer being greater or equal. In the above equation Eq. (12) we used the assumption that in every time step the system starts from a totally random state and just the values of φt0 and φt1 are changing over time. In the opposite case we wish to derive the probability that a given agent will change its technological level from τ1 = 1 to τ0 = 0. The analytical form in this case barely differs from the previous one due to the symmetric nature of the cost factor r presented in Eq. (2). In order to obtain this probability we only have to change the limits of the second sum of Eq. (12) p1t →0 =
∞
∑ ρn
k =� np h −1 �
∑
n
0
� n (1 − φt0=0 )k (φt0=0 )n−k . k
(13)
Note that in this special case of the model the equality p1t →0 = 1 − p0t →1 holds since there are only two technological levels presents in the system. Knowing the fraction of technological levels φt0 and φt1 and the transition probabilities p0t →1 and p1t →0 at time t we can obtain discrete evolution equations for the fractions of technological levels φt0+1 = φt0 + p1t →0 (1 − φt0 ) − p0t →1 φt0 ,
(14)
φt1+1 = 1 − φt0+1 = φt1 + p0t →1 (1 − φt1 ) − p1t →0 φt1 .
(15)
φt0=0
φt1=0
After specifying the initial fractions and and the cost parameter r we can follow the evolution of the system by iterating Eqs. (14,15). The above master equations have also the advantage that the most important features of the time evolution can be extracted by analytic means. 4.2.1 Stable and instable fixed points
In order to reveal the long term time evolution of the system it is crucial to investigate the fixed points of the master equations Eqs. (14,15). Fixed points of the evolving fractions of technological levels τ are defined by the condition φtτ+1 = φtτ , i.e. the fixed point is reached when a frozen state is attained. Here the technological level τ can be 0 or 1. Our goal is to identify well defined regimes of initial fractions φt0=0 and φt1=0 for different values of the cost factor r starting from which the system can converge to different final states. For simplicity, let us consider first Eq. (15) and analise the case when all agents have n = 4 social contacts. Applying the fixed point condition at t = 0, it can easily be seen that the iteration equation Eq. (15) has either two or three fixed points depending on the value of r. For the parameter ranges r < 1/3 and r > 3 there are two fixed points, a stable and unstable one which characterize homogeneous final states of the system where only one of the technologies survives 1 = 0, φc1
and
1 φc2 = 1.
(16)
347
Cellular Automata Modelling of the Diffusion of Innovations
2
1.0
10
0.8
tr
φ1t+1
0.6 10
0.4
r>3 1 φc3 t 1 = 0 and φ1 = 1 are stable and their ranges results demonstrate that the two fixed points φc1 c2 1 ) and ( φ1 , 1], respectively. of attraction are the intervals [0, φc3 c3 A very important outcome of the master equation analysis is that starting from a random configuration of two competing technologies the dynamics of the system leads to a homogeneous final state where only one of the technologies survives. However, depending on the value of the starting fractions of technologies the evolution process can even take a very long time. Figure 3(b) presents the relaxation time tr , i.e. the time needed to reach the homogeneous final state as a function of the initial fraction φt1=0 . It can be observed that approaching the third fixed point the relaxation time tr diverges tr → ∞, which demonstrates that the inhomogeneous state of competing technologies can have a very long lifetime. This feature of the model describes the natural phenomenon that the competition of products on the market is much more tense and takes longer if the presence of products is balanced. The initial fraction can be controlled by the advertising activities of the producers. It is a very interesting question to investigate how the complex topology of social contacts affects the spreading of technologies. Complex networks of agents generated by the Watts-Strogats method can be captured in the framework of the master equation approach by inserting the degree distribution Eq. (5) into the generic expression of the transition 1 in the probabilities Eq. (12). In Figure 4 we present the value of the unstable fixed point φc3 range of the cost factor 1 < r < 3 varying the rewiring probability p of the network in the interval [0, 1]. The rewiring method was applied to a square lattice so that in the figure p = 0 represents the regular square lattice, while in the limit p → 1 a random graph is obtained. It can be observed that for p = 0 the value of the fixed point does not depend on r in the range considered (see also the above analysis). However, as the rewiring probability increases, i.e. 1 has a continuous as the degree distribution gets broader, two important changes appear: φc3 dependence on the value of p, and the interval of r splits up into several sub-intervals inside
349
Cellular Automata Modelling of the Diffusion of Innovations
4/3
5/4
3/2 0.35
5/3
0.3
2 0.25
φc
0.2 0.15 0.1 0.05
7/3
0 01
1 0.2 0.8
1.5 0.4 0.6
p
0.6 0.4
2
r
0.8 0.2 10
2.5
1 as a function of the rewiring probability p in Fig. 4. The unstable fixed point of the system φc3 the range of the cost factor 1 < r < 3. The polidispersity of the number of connections makes the system more sensitive to advantages provided by more advanced technologies. The 1 is constant. numbers on the surface plot provide the interval limits of r inside which φc3 1 has different values. This simple master equation analysis demonstrates that the which φc3 topology of social contacts may have a strong effect on the spreading process of technologies in social systems. More details on the effect of the underlying social network will be revealed by cellular automata simulations in the next section.
5. Cellular automata simulations To be able to carry out analytical investigations of the model system in the previous section, serious simplifications had to be applied. The advantage of the approach is that interesting characteristic quantities could be obtained in closed analytic forms, important global features could be revealed, however, the results are limited either by the range of interaction, simplified topology of social contacts, bimodal distribution of initial technological levels, or by neglecting any spatial correlation (clusterization) of agents according to their technological levels. In order to analyze the time evolution and spatial structure of the model system in its entire complexity, we perform computer simulations using cellular automata techniques. As a first case we consider a set of agents organized on a square lattice of size L × L with nearest neighbor interactions. Initially agents have randomly distributed technological levels between 0 and 1 with uniform distribution p0 (τ ) = 1,
and
P0 (τ ) = τ,
f or 0 ≤ τ ≤ 1.
(21)
In our simulations we assume periodic boundary conditions, thus all agents of the lattice have four interacting partners. The rejection-adaptation dynamics based on the cost minimization
350
a)
Cellular Automata - Simplicity Behind Complexity
a1=1 a2=2
0.9 0.5 0.7 0.8 0.6
b)
c)
0.9
0.9
0.5 0.5 0.8
0.5 0.6 0.8
0.6
0.6
C=1.6
C=1.1
0.9
0.9
0.5 0.8 0.8
0.5 0.9
0.9 0.5 0.8 0.8
0.8
0.6
0.6
C=0.7
C=0.8
0.6
Fig. 5. Illustration of the update rule of cellular automata. ( a) presents the current configuration of an agent with its 4 interacting partners. The value of the technological level τ and of the two cost factors a1 and a2 are given. (b ) demonstrates that the agent in the middle has 4 possibilities to copy the technology of one of its social partners. The agent will choose the one which provides the lowest cost C = 0.7. (c) The final configuration after decision making. The color of the squares represents the technological level which also corresponds to the color code of Fig. 1. results in a non-trivial time evolution of the system which is followed by computer simulations treating the system locally as a cellular automaton. In the simulations parallel update is used, i.e. all agents try to minimize their costs in each time step assuming that their interacting partners keep fixed. This parallel dynamics is one of the sources of the complex behavior of the system. If at time t the technological level of agent i which has n neighbors with technological levels τ1 , τ2 , . . . , τn is τ, the CA rule to get its technological level in time t + 1 reads as τit+1 = τj ,
(22)
where j denotes the neighboring agent whose technological level is the most worthy to copy for agent i, i.e. C � (i, j) = min {C � (i, 1), C � (i, 2), . . . , C � (i, n )}, (23) where C � (i, j) is the cost of agent i assuming that its technological level has been replaced with the technological level of neighbor j. The update rule of our cellular automata is illustrated in Fig. 5 on a square lattice. Snapshots of the cellular automata time evolution of the evolving system are presented in Fig. 6 for a square lattice of size L = 100. Applying the analytical results of Eq. (9) and Eq. (10) for the specific case of n = 4, the agents will always copy the first, second, third or fourth highest τ of their local interacting partners when the value of the parameter r falls in the intervals 0 < r < 1/3, 1/3 < r < 1, 1 < r < 3, 3 < r, respectively. (Note that the behavior of the system is symmetric with respect to r = 1.) Since the dynamics of the system governed by the cost minimization mechanism favors local communities to have products of the same technological level, the agents tend to form clusters with equal τ at any value of r. A very interesting special case is r = 1.0, when being more advanced than the surroundings does not provide any advantages, it can be seen in
Cellular Automata Modelling of the Diffusion of Innovations
351
Fig. 6. Snapshots of CA simulations of the model on a square lattice of size L = 100 for different values of the cost factor: r = 1 (top), r = 2 (middle), and r = 4 (bottom). The color code represents the actual technological level of the agents. The numbers indicate the time step in which the snapshot was taken. Fig. 6(top row) that the system evolves into a frozen cluster structure. The technological level τ of these clusters covers practically the entire available range, i.e. the [0, 1] interval, with a non-trivial distribution. The clustering implies that communities of low level technologies can survive in the presence of highly advanced ones (see Fig. 6(top)). At 1 < r < 3, where more advanced technologies are favored by the agents (locally the second largest τ), the cellular automata simulation of the system converges into an almost completely homogeneous state of a relatively high technological level (see Fig. 6(middle) where the specific case of r = 2 is plotted). In the simulations, initially clusters of agents with identical τ grow and finally the entire system evolves into a homogeneous state with all agents adopting the same technology. Since locally the agents choose the second highest τ to adopt, both very low and very high level technologies disappear during the evolution. The colors also illustrate that the limiting value of τ adopted by almost all agents is smaller than the highest available value τmax = 1, namely, it falls between 0.8 and 1. It follows from Eq. (10) that to reach the most advanced technologies, r has to surpass the threshold value r = 3 in the case of constant n = 4 number of neighbors. This regime is illustrated in Fig. 6(bottom) for the specific case of r = 4, where the light color in the last snapshots indicates that the most advanced technology τmax = 1 spraw onto the entire lattice.
352
Cellular Automata - Simplicity Behind Complexity
5.1 Distribution of technological levels in cellular automata – extreme order statistics
In order to give a quantitative characterization of the time evolution of the cellular automata on a square � � lattice, we determined the distribution pt (τ ) of technological levels τ, and the mean τ t of technological levels at different times t � t� 1 N t τi , τ = N i∑ =1
(24)
where N denotes the total number of agents.
a)
b)
c)
Fig. 7. Probability distribution of technological levels p(τ ) obtained at different time values for three different values of the cost factor r. ( a) For the case of r = 1 the rescaled plot of the distributions � � is presented, i.e. the distributions obtained at different times are rescaled by the mean τ t and by the standard deviation σt of the distributions. The master curve obtained perfectly agrees with the standard Gaussian. (b ) For r = 2 when the second largest technological level is favored locally by agents, the distributions converge to a highly peaked functional form. (c) In the range r > 3 agents always select the most advanced technology, hence, the distributions can be very well described by extreme order statistics represented by the continuous lines. Figure 7( a) shows that for r = 1, when higher level technologies do not provide advantages for agents, the distribution pt (τ ) rapidly attains a Gaussian shape. In order to demonstrate the validity of the Gaussian form, we present the rescaled distributions in the figure:� the� distributions obtained at different times are rescaled by the average technological level τ t of the corresponding state and�by �the standard deviation of the distribution σt so that pt (τ )σt is plotted as a function of (τ − τ t )/σt . The high quality data collapse that can be seen in Fig. 7( a) and the good quality fit with the standard Gaussian √ g( x ) = 1/ 2πexp(− x2 /2) (25) demonstrate the validity of the Gaussian description of the evolution of the cellular automata. The convergence to the Gaussian is very fast. In our test simulations after 30 − 40 iteration steps the system completely forgot its initial uniform state and pt attained the Gaussian limit distribution. This form implies that the fraction of agents having very high and very low level technologies both decrease and agents tend to copy technologies in the vicinity of the distribution mean. Consequently, the system does not have any technological progress, � � the average technological level remains nearly constant during the time evolution, and τ t → 0.5. For the cost factor r > 1 agents locally prefer to adopt higher level technologies, namely, the highest or the second highest τ value of the neighborhood will be adopted on the square lattice
353
Cellular Automata Modelling of the Diffusion of Innovations
depending on the exact value of r. These local changes imply that the cellular automata rule Eq. (23) gives rise to a more complex time evolution involving also extreme order statistics. For 1 < r < 3 all the agents adopt the second highest available technology; hence, in a large enough system the distribution of technological levels right after the first iteration step pt (τ ) can be described as the k = 3 rank extreme distribution Φ kM of M = 4 variables which are all sampled from a uniform distribution. In general, the probability density function Φ kM ( x ) of choosing the kth largest value among M realizations of the random variable x which has a probability density p( x ) and a distribution function P ( x ) can be cast into the form Φ kM ( x ) =
M! P ( x )k−1 (1 − P ( x )) M−k p( x ). ( k − 1) ! ( M − 1) !
(26)
It can be seen in Fig. 7(b ) that by substituting the initial uniform distribution Eq. (21) into Eq. (26) with the parameter setting M = 4 and k = 3, a perfect agreement is obtained between our analytical predictions Φ34 and p1 (τ ) obtained from CA simulations. Unfortunately, at higher iteration steps the distributions pt do not follow the functional form Eq. (26) when we substitute Φ kM and the corresponding distribution function recursively on the right-hand side. The reason is the overlap of the local neighborhoods of the lattice sites which modifies the statistics of technological levels. By increasing the number of iterations, pt gets narrower and converges to a sharply peaked function as the final homogeneous state is approached (see Fig. 7(b ) and Fig. 6). Consequently, the average value of the technological levels increases and converges to a limit value which is lower than the available maximum τmax = 1. It has to be emphasized that under this parameter settings the system exhibits considerable technological progress due to the disappearance of low level technologies and to the proliferation of the more advanced ones. In the extreme case when the control parameter r becomes larger than 3, more advanced technologies provide so much benefit that it is always advantageous for agents to adopt the highest available technological level in the local neighborhood. Thus, pt (τ ) rapidly converges to a sharply peaked form the position of which approaches τmax = 1 through extreme order distributions (see Fig. 7c). It is interesting to note that contrary to the previous case of 1 < r < 3, in this regime r > 3 the distribution pt can be described by the extreme order density function Φ kM Eq. (26) with k = M at any time t by taking into account that the size of the neighborhood M increases as a function of time t. We found a recursive formula for the time dependence of the parameter M M t + 1 = M1 + 5 + 2 ( t − 1 ) ,
with
M1 = 4,
(27)
which shows how information spreads in the system. The lines in Fig. 7(c) demonstrate the excellent agreement of the above analytic prediction with the numerically obtained distribution functions. Note that due to the symmetry of the system with respect to the parameter value r = 1, the same holds also for r < 1/3 with Φ1M , where the smallest value (k = 1) of Mt variables given by Eq. (27) is selected. These results imply that the average technological level in these regimes can easily be obtained analytically, i.e. the average of the largest and of the smallest value of Mt variables with uniform distribution can be cast into the form Mt 1 , . (28) �τmax � = �τmin � = Mt + 1 Mt + 1 Substituting the recursive � � formula of Mt into Eq. (28) a perfect agreement is obtained with the numerical results of τ t Kun et al. (2007).
354
Cellular Automata - Simplicity Behind Complexity
6. Agents on complex networks The success or failure of newly introduced technologies on the market can also depend on the complexity of social contacts of users. This is especially valid for so-called networking technologies where the practical value of the technology for an agent depends on the number of social partners which already use the technology. Telecommunication technologies we are also focusing on are prototypical examples where the topology of social contacts may play a crucial role Mahajan & Peterson (1985); Rogers (1962).
0.95
1.0
0.85
�τ �
p=0 p=0.02 p=0.05 p=0.07 p=0.2 p=0.5 p=0.7
0.4
0.2
0.5
1.0
1.5
r
(a)
2.0
2.5
3.0
�τ �
meanfield
0.6
0.0 0.0
r=2.4
0.9
0.8
0.8
r=1.7
0.75 0.7 0.65 0.0
r=1.4 0.2
0.4
p
0.6
0.8
1.0
(b)
Fig. 8. ( a) Average technological level �τ � of the system obtained after long time evolution as a function of r for several different values of the rewiring probability p. (b ) �τ � as a function of the rewiring probability p for three specific values of r. The presence of long range connections can increase and even decrease the average technological level of the system depending on the cost factor r. In order to have a more quantitative understanding of this phenomenon in the framework of our model, we implemented cellular automata simulations on a complex network of agents obtained by the Watts-Strogatz method varying the value of the rewiring probability p between 0 and 1 (see Section 3.3). The complexity of the underlying social network of agents introduces two important features: (i ) as the rewiring probability p increases, more and more connections are established between remote agents introducing long range correlations in the system and reducing the “diameter” of the network. (ii ) The probability distribution of the number of connections, i.e. the degree distribution of agents gets broader so that the number of connections can span from 1 to high values. One of the outcomes of the master equation approach was that the scatter of the degree makes the system more sensitive to the advantages technologies provide so in CA simulations more interesting details can be expected. To go beyond the limitations of the analytic approaches we carried out cellular automata simulations on different topologies to determine the average technological level �τ � in the final state of the time evolution when a frozen configuration is attained. The average technological level of the final state �τ � is presented in Fig. 8( a) as a function of r for several different values of the rewiring probability p. Note that the average technological level �τ � (r ) is a
Cellular Automata Modelling of the Diffusion of Innovations
355
monotonically increasing function of r for any value of the rewiring probability p. The plotted functions are composed of distinct steps whose height and number are sensitive to the details of the network topology. The steps are the consequence of the behavior described by Eq. (9), i.e. the steps mark the interval borders for different degrees: e.g. for agents of n = 4 social contacts we have 4 intervals – taking also into account the symmetric cases of r < 1 and 1 < r < 3 as well (see Eq. (9)) – which result in 3 steps. Increasing the rewiring probability p, the degree distribution ρ(n ) gets broader giving rise to an increase in the number of different degrees in the network which then results in a higher number of steps of �τ � (r ). It can be seen in the degree distribution of a rewired lattice of rewiring probability p = 0.05 in Fig. 2(b ) that in this case the possible degrees of the network are n = 2, 3, 4, 5, 6. Using Eqs. (9) and (10) one can determine the interval limits of r for each n value, from which the overall r limits of the entire network can be obtained as 1/5, 1/4, 1/3, 1/2, 2/3, 1, 3/2, 2, 3, 4, 5. For comparison, in Fig. 8( a) we also present the mean field solution Eq. (6) of the model obtained analytically for the fully connected case, when all agents are connected with all others. A very important outcome of the above calculations is that the degree polydispersity of agents’ social contacts makes the socio-economic system more sensitive to the details of the novel technology, i.e. to the specific value of the cost factor r. It can be observed in Fig. 8( a) that increasing the connectivity of the system, the presence of long range connections can increase but can also decrease the average technological level attained in the final state depending on the value of the cost factor r. For high enough cost factor r the long range contacts facilitate the spreading of advanced technologies, while for lower r values the opposite effect occurs, i.e. the dominance of low level technologies enhanced also by the long range contacts prevents technological advancement. Figure 8(b ) provides some quantitative insight into this effect, where we present �τ � as a function of the rewiring probability p for three different values of r. All the curves start from the same point at p = 0, since on a regular square lattice always the third highest technology is selected when r falls in the interval 1 < r < 3. For increasing p the curves converge to r dependent asymptotic values which can be both lower and higher than the one at p = 0.
7. Discussion In this chapter we presented an agent based model of the spreading of technological advancements, where the technology is used for the interaction/communication of agents. The model realizes a bottom-up approach to socio-economic systems which is especially designed for a cellular automata reprezentation. Agents/cells of the model can represent individuals or firms which use different level technologies to collaborate with each other. Costs arise due to the incompatibility of technological levels measuring the degree of difficulties in the usage of technologies. Agents can reduce their costs by adopting the technologies of their interacting partners. We showed by analytic calculations and computer simulations that the local adaptation-rejection mechanism of technologies results in a complex time evolution accompanied by microscopic rearrangements of technologies with the possibility of technological progress on the macro-level. As a first step, simplified configurations of the model system were analyzed by analytical calculations: A mean field approach was considered where each agent communicates with all other agents. As to the next a master equation was derived which describes the discrete time evolution of the system assuming no spatial correlation, i.e. no clustering of agents according to their technological level. Already these simplified approaches revealed that the
356
Cellular Automata - Simplicity Behind Complexity
rejection-adoption rule of our cellular automata leads to a homogeneous final state whose stability depends on the relative amount of advantages technologies provide for the users. These results also reflected the phenomenon that competition in the market takes much longer and it can be much more violent if the actors of the competition start from a nearly balanced initial scenario. The analysis of the model system in its entire complexity was carried out by cellular automata simulations performed on a square lattice and on complex network topologies of social contacts. Computer simulations revealed that agents tend to form clusters of equal technological levels. If higher level technologies provide advantages for agents, the system evolves to a homogeneous state but clusters show a power law size distribution for intermediate times. The redistribution of technological levels involves extreme order statistics leading to an overall technological progress of the system. We also demonstrated that the topology of agents’ social contacts plays a crucial role in the spreading process leading to a broad spectrum of novel behaviors. Analytical calculations and computer simulations showed that long range connections on the social network can facilitate but it can also hinder the diffusion of the advanced technology depending on the amount of advantages more advanced technologies provide with respect to the low level ones. Our model emphasizes the importance of copying in the spreading of technological achievements and considers one of the simplest possible dynamical rule for the decision mechanism. In the model calculations no innovation was considered, i.e., agents could not improve their technological level by locally developing a new technology instead of only taking over the technology of others. Compared to opinion spreading models like the Sznajd-model Sznajd-Weron (2005); Sznajd-Weron & Sznajd (2000); Sznajd-Weron & Weron (2002) and its variants A.T. Bernardes (2002); Stauffer (2002a;b), the main difference is that in our case the technological level of agents is a continuous random variable; furthermore, the decision making is not a simple majority rule but involves a minimization procedure. Opinion of individuals can also be represented by a continuous real variable which makes possible to study under which conditions consensus, polarization or fragmentation of the system can occur. Such models show more similarities to our spreading model of technologies Gandica et al. (2010); Gilbert (2008); Hegselmann & Krause (2002). It is interesting to note that our model captures some of the key aspects of the spreading of telecommunication technologies, where for instance mobile phones of different technological levels are used by agents to communicate/interact with each other. In this case, for example, the incompatibility of MMS-capable mobile phones with the older SMS ones may motivate the owner to reject or adopt the dominating technology in his social neighborhood by taking into account the offers of provider companies of the interacting partners.
8. Acknowledgment The work is supported by TÁMOP 4.2.1-08/1-2008-003 project. The project is implemented through the New Hungary Development Plan, co-financed by the European Social Fund and the European Regional Development Fund. F. Kun acknowledges the Bolyai Janos fellowship of the Hungarian Academy of Sciences. The authors are grateful for the generous support of Toyota Central R&D Labs., Aichi, Japan.
Cellular Automata Modelling of the Diffusion of Innovations
357
9.References Albert, R. & Barabasi, A.-L. (2002). Statistical mechanics of complex networks, Rev. Mod. Phys 74: 47. A.T. Bernardes, D. Stauffer, J. K. (2002). Election results and the sznajd model on barabási network, Eur. Phys. J. B 25: 123. Castellano, C., Fortunato, S. & Lorento, V. (2009). Statistical physics of social dynamics, Reviews of modern physics 81: 591–646. Gandica, Y., del Castillo-Mussot, M., Vazquez, G. J. & Rojas, S. (2010). Continuous opinion model in small-world directed networks, Physica A: Statistical Mechanics and its Applications 389: 218. Gardner, M. (1970). Mathematical games – the fantastic combinations of john conway’s new solitaire game ”life”, Sci. Am. pp. 120–123. Gilbert, N. (2008). Agent-based models, Sage Publications, London. Grassberger, P. (1984). Chaos and diffusion in determinicstic cellular automata, Physica D: Nonlinear Phenomena 10: 52–58. Guardiola, X., Díaz-Guilera, A., Pérez, C. J., Arenas, A. & Llas, M. (2002). Modeling diffusion of innovations in a social network, Phys. Rev. E 66: 026121. Hegselmann, R. & Krause, U. (2002). Opinion dynamics and bounded confidence: models, analysis and simulation, J. Art. Soc. Soc. Sim. 5: 3. Helbing, D. (2009). Managing complexity in socio-economic systems, European Review 17: 423–438. Helbing, D., Treiber, M. & Saam, N. J. (2005). Analytical investigation of innovation dynamics considering stochasticity in the evaluation of fitness, Phys. Rev. E 71: 067101. Kocsis, G. & Kun, F. (2008). The effect of network topologies on the spreading of technological developments, J. Stat. Mech P10014. Kun, F., Kocsis, G. & Farkas, J. (2007). Cellular automata for the spreading of technologies in socio-economic systems, Physica A: Statistical Mechanics and its Applications pp. 660–670. Llas, M., Gleiser, P. M., López, J. M. & Díaz-Guilera, A. (2003). Nonequilibrium phase transition in a model for the propagation of innovations among economic agents, Phys. Rev. E 68: 066101. Mahajan, V. & Peterson, R. A. (1985). Models for Innovation Diffusion, Sage Publications, London. Rogers, E. M. (1962). Diffusion of Innovations – first edition, The Free Press, New York. Sornette, D. (2000). Critical Phenomena in Natural Sciences – second edition, Cambridge Springer, Berlin. Stauffer, D. (2002a). Monte carlo simulations of sznajd models, J. Artif. Soc. Soc. Simulation 5: 1. Stauffer, D. (2002b). Sociophysics: the sznajd model and its applications, Int. J. Mod. Phys C 13: 315. Sznajd-Weron, K. (2005). Sznajd model and its applications, Acta Phys. Pol. B 36: 2537. Sznajd-Weron, K. & Sznajd, J. (2000). Sociophysics: the sznajd model and its applications, Int. J. Mod. Phys C 11: 1157. Sznajd-Weron, K. & Weron, R. (2002). A simple model of price formation, Int. J. Mod. Phys C 13: 115. von Neumann, J. (1948). The general and logical theory of automata, L.A. Jeffress (Ed.). Cerebral Mechanisms in Behavior pp. 1–41.
358
Cellular Automata - Simplicity Behind Complexity
Watts, D. J. (1999). Social percolation, American Journal of Sociology 105: 493. Watts, D. J. & Strogatz, S. H. (1998). Collective dynamics of ’small-world’ networks, Nature 393: 440–442. Weidlich, W. (2000). Sociodynamics, Dover Publications, MIneola, USA. Wolfram, S. (2002). A New Kind of Science, Wolfram Media, Inc.