R529
Change Detection
Running head: CHANGE DETECTION
Changing Change Detection: Improving the Reliability of Measures of Visual Short-Term Memory Capacity
Søren Kyllingsbæk and Claus Bundesen University of Copenhagen
Word count:
5994 words
Correspondence:
Søren Kyllingsbæk Center for Visual Cognition Department of Psychology University of Copenhagen Øster Farimagsgade 2A DK-1353 Copenhagen K DENMARK Tel. (+45) 35 32 48 00 Fax. (+45) 35 32 49 32 Email:
[email protected]
1
R529
Change Detection
Abstract
The change detection paradigm is a popular way of measuring visual short-term memory capacity. Using the paradigm, evidence for a capacity of about 4 independent visual objects has confirmed classic estimates based on the number of items that can be reported. Here we determine the reliability of capacity measures found by change detection. We derive theoretical predictions of the variance of the capacity estimates and show how they depend on the number of items to be remembered and the guessing strategy of the observer. We compare the theoretically derived variance to the variance estimated over repeated blocks of trials with the same observer and find close correspondence between predicted and observed variances. Further, we propose a new, unforced version of the two-alternative-choice change detection paradigm that reduces the variance of the capacity estimate substantially.
2
R529
Change Detection
Introduction
Traditionally visual short-term memory (VSTM) capacity has been measured using the whole report paradigm where participants are required to report as many items as possible from a set of briefly presented objects (Cattell, 1885). Sperling (1960, 1963, 1967) used letters as stimuli and found that the capacity was limited to about four or five independent items (see also Bundesen, 1990; Bundesen, Habekost, & Kyllingsbaek, 2005; Shibuya & Bundesen, 1988). Using familiar, nameable stimuli, whole report gives a reliable and easily interpretable measure of VSTM capacity. However, several investigators have objected that the very use of verbalizable stimuli may contaminate the estimate of VSTM capacity due to contribution from verbal working memory (Olsson & Poom, 2005; Vogel, Woodman, & Luck, 2001). Moreover, whole report is not feasible when measuring VSTM capacity for unfamiliar material. For these reasons, among others, the bulk of recent studies of VSTM capacity have used the change detection paradigm. Change detection was developed by Phillips (1974) for investigating memory of random patterns and extended by Pashler (1988) to estimate memory for multiple objects. In Pashler’s version of the paradigm, a number of unrelated stimuli are presented and the participant is asked to remember the identity and location of the items. Stimulus presentations are brief (< 500 ms) but presumable long enough that VSTM is filled up. After presentation of the memory display, a blank screen is presented for one to three seconds followed by a probe display. In half of the trials the probe display is identical to the memory display (no-change trials), and in the other half of the trials the identity of a single, randomly chosen item is changed (change trials).
3
R529
Change Detection
The participant is instructed to make a 2-alternative forced choice (2AFC) response indicating whether the two displays are identical. In Pashler’s original version of the change detection paradigm, all items in the probe display must be compared with the remembered items in VSTM. The number of comparisons was assumed not to influence the probability of recognizing the change. However, this assumption may be too strong. Thus, several investigators have used a different approach, single-probe change detection (Cowan, 2001; Cowan et al., 2005). Here the probe display following the delay period only contains a single item located at a randomly chosen one of the locations previously occupied by an item in the memory display. Compared to the original version of the change detection paradigm, the use of a single probe reduces the role of comparison processes in the task. Investigations of visual short-term memory capacity by use of change detection have flourished during the past 10 years. In line with previous whole report studies, many investigations have provided evidence for a limitation of about four independent objects (Awh, Barton, & Vogel, 2007; Luck & Vogel, 1997; Rouder et al., 2008; Todd & Marois, 2004; Vogel & Machizawa, 2004; Vogel et al., 2001; but see also Alvarez & Cavanagh, 2004; Bays & Husain, 2008; Eng, Chen, & Jiang, 2005). Several studies have investigated the consistency of estimates of VSTM capacity across different types of stimulus material or different points in time. Good correspondences have sometimes been found between different estimates of VSTM capacity for the same participants (Awh et al., 2007; Scolari, Vogel, & Awh, 2008). As noted by Vogel and Awh (2008), individual variations in VSTM capacity may be exploited when investigating fundamental aspects of working memory and attention. Thus, correspondence between individual variations in cognitive and neurophysiological measures may be used to validate the latter. Similarly, both
4
R529
Change Detection
associations and dissociations between cognitive measures may be revealed by an individual-difference approach, provided that sufficiently reliable estimates for the cognitive parameters can be obtained. In this article we investigate the reliability of estimates of VSTM capacity derived from the change detection paradigm. We derive theoretical measures of the reliability of the estimates, apply the measures to new empirical data, and show how the paradigm can be optimized. Thus, we show that the reliability is highest when the display size is just above the VSTM capacity of the tested participant. We propose a new version of single-probe change detection that should further improve the reliability of the estimate of VSTM capacity. In this new version of the paradigm, participants are not forced to guess, but may respond ”Don’t know” when uncertain whether a change has happened or not. As we shall show, this minor change to the paradigm reduces the variance of the capacity estimate substantially.
The Variability of VSTM Capacity Estimates
The data derived from a change detection paradigm such as Cowan’s (2001) version of the single-probe change detection paradigm may be reduced to an observed hit rate, Pˆ (H ) , of detecting a change when it is present between the memory and the probe display and a false alarm rate, Pˆ (FA ) , which is the relative frequency of erroneously responding ”Change” when no change is present. From Pˆ (H ) , Pˆ (FA ) , and the number of items presented in the memory display, NS, an estimate of VSTM capacity K may be derived from a model specifying the nature of the mental processes involved.
5
R529
Change Detection
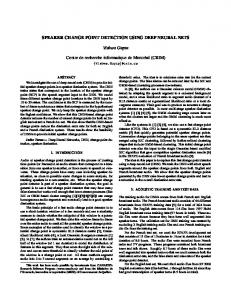
6
====================== Insert Figure 1 about here ====================== The model proposed by Cowan (2001; Cowan et al., 2005) is shown in Figure 1. In this model, a participant in a single-probe change detection paradigm encodes all of the NS items in the memory display when VSTM capacity K ≥ NS, but a randomly chosen subset of K items from the memory display when K < NS. Information about the locations of the K items is assumed to be perfect so that the comparison with the probe is not affected by spatial uncertainty of neither the items in VSTM nor the probe. If K ≥ NS, the participant successfully notices that the single item in the probe display is different from the corresponding item in the memory display when a change occurs. Likewise, the participant will also correctly identify that the probe item is identical to the item in the memory display in no-change trials. If K < NS, the probability of successfully encoding the probed item equals K/NS. If the participant has failed to encode the probed item (which happens with probability 1 – K/NS), the participant may guess that the probed item has changed, which happens with probability Pgy. The probabilities of hits and false alarms are
P (H ) = K N S + (1 − K N S )Pgy
(1)
P (FA ) = (1 − K N S )Pgy ,
(2)
and
respectively.
R529
Change Detection
7
By subtracting Equation 2 from Equation 1, we get an estimate for the VSTM capacity K:
Kˆ = N S [Pˆ (H ) − Pˆ (FA)].
(3)
P(H) is estimated by the relative frequency of hit trials among trials in which a change occurred (change trials), and P(FA) is estimated by the relative frequency of false alarm trials among trials in which no change occurred (no-change trials). In the following we assume that the number of change trials and the number of no-change trials are the same (NT). Thus, if a total of 40 trials are run, NT equals 20. Further, we assume that the number of hit trials is binomially distributed with parameters n = NT and p = P(H), whereas the number of false alarm trials is binomially distributed with parameters n = NT and p = P(FA). As shown in Appendix A, the assumptions imply that the expected variance of the estimate for K is given by
(N − K )[K + 2 Pgy (1 − Pgy )(N S − K )] V ( Kˆ ) = V N S Pˆ ( H ) − Pˆ ( FA ) = S . NT
( [
])
(4)
From Equation 4, three predictions follow: (a) The variance of the estimate of K is inversely related to the number of trials, 2NT, (b) the variance increases strongly with the number of display items in excess of K, and (c) the variance may be minimized by having the participant adopt either a very conservative guessing strategy (Pgy → 0) or an extremely liberal guessing strategy (Pgy → 1). Either strategy reduces the expected variance to (NS – K)K / NT. On the other hand, the variance is maximal at a value of ½(NS2 – K2) / NT when Pgy = .5. Reducing the variance of Kˆ by lowering the number of
R529
Change Detection
items to be remembered, NS, to a value just above the true value of VSTM capacity K may be done, for example, on the basis of a short block of pilot trials where the performance of the subject is monitored around a memory set size of 3 (+/- 2 items). Figure 2 illustrates the effect of varying K, Pgy, and NS on the variance of Kˆ given by Equation 4. ====================== Insert Figure 2 about here ======================
A New Change Detection Paradigm
As described above, one of the aims of the present paper is to present an alternative to the standard 2AFC single-probe change detection paradigm. In the new 2alternative unforced choice (2AUFC) single-probe change detection paradigm, the participant is given a third response option. In addition to responding “Change” or ”No change” the participant may indicate that the probed item was not encoded in VSTM by responding “Don’t know” (i.e., “I don’t know if the probed item was changed”). ====================== Insert Figure 3 about here ====================== A model of the new version of the 2AUFC single-probe change detection paradigm is presented in Figure 3. A single new parameter, Pgn, is introduced; Pgn is the probability that the participant will guess no (”No change”) when the probed item is not encoded in VSTM. Otherwise, the model is similar to Cowan’s model in Figure 1. From
8
R529
Change Detection
9
the new model, the probability of hits, misses, correct rejections, and false alarms may be derived as shown in Equations 8-11,
P (H ) = K N S + (1 − K N S )Pgy ,
(8)
P (M ) = (1 − K N S )Pgn ,
(9)
P (CR ) = K N S + (1 − K N S )Pgn ,
(10)
P (FA ) = (1 − K N S )Pgy ,
(11)
where 0 ≤ Pgy + Pgn ≤ 1. The probability of responding ”Don’t know” in change trials is given by Pˆ (?C) = 1 − Pˆ ( H ) − Pˆ ( M ) , and the probability of responding ”Don’t know” in no-change trials is given by Pˆ (?C ) = 1 − Pˆ (CR ) − Pˆ (FA ) . From Equations 8–11, a new estimate for VSTM capacity K may be derived:
[
]
Kˆ = N S Pˆ ( H ) − Pˆ ( FA) + Pˆ (CR ) − Pˆ ( M ) / 2.
(12)
Let the number of hits, misses, and don’t-know responses on change trials be multinomially distributed with parameters NT and p = [P(H), P(M), P(?C)], and let the number of correct rejections, false alarms, and don’t-know responses on no-change trials be multinomially distributed with parameters NT and p = [P(CR), P(FA), P (?C ) ].
R529
Change Detection
10
As shown in Appendix A, the expected variance of the estimate for K given by Equation 12 equals
V ( Kˆ ) = V (N S [Pˆ (H ) − Pˆ (FA ) + Pˆ (CR ) − Pˆ ( M) ]/ 2 )
(N S − K )[K + N S (Pgy + Pgn ) − (N S − K )(Pgy − Pgn )
2
=
2NT
].
(13)
Equation 13 implies that (a) the variance is inversely related to the total number of trials 2NT, and (b) the variance increases with the number of display items in excess of K. If the participant adopts a conservative guessing strategy by which both Pgy and Pgn tend toward zero, the variance of the new K-estimate is reduced to half the expected variance of the traditional K-estimate given by Equation 4 when participants are also using a conservative guessing strategy in the 2AFC paradigm (i.e. Pgy → 0). However, when comparing classic 2AFC change detection where subjects are free to choose their guessing strategy with the new 2AUFC paradigm where a conservative guessing strategy is stressed in the instruction, the reduction in the variance of the Kestimate can be larger than 50%. The maximal relative difference is found when Pgy equals .5 in the 2AFC paradigm and both Pgy and Pgn are zero in the 2AUFC paradigm. Dividing the variance estimate in Equation 13 by the variance estimate of Equation 4, the predicted ratio equals
K . NS + K
R529
Change Detection
As an example, the variance of the K-estimate in the new 2AUFC paradigm would be 33% of the variance in the 2AFC paradigm in a participant with a K value of 4 trying to remember a display with 8 memory items. One may also ask what the benefit of the new 2AUFC paradigm would be in terms of the number of trials that has to be run given a required level of the absolute variance of the K-estimate. Assume, for example, that K = 3 and NS = 6, whereas Pgy = .4 in the 2AFC but Pgy = Pgn = .1 in the 2AUFC. How many trials would one have to run in the two paradigms to reach a variance level in the K-estimate of .5? Inserting into Equations 4 and 13, and isolating NT, one finds that NT = 27 trials for the 2AFC paradigm and NT = 13 for the new 2AUFC paradigm. Thus, a total of about 54 trials would have to be run in the traditional 2AFC paradigm whereas the number of trials could be reduced to 26 trials in the new 2AUFC paradigm. If the sum Pgy + Pgn approaches one (i.e., the participant always guesses and never uses the new third response alternative ”Don’t know”), the variance of K tends towards the value of Equation 4 as expected. In line with this, Equation 13 reaches its maximum value when Pgy = Pgn = .5.
Finally, we note that the derived variance estimates in both the classic 2AFC paradigm (Equation 4) and the new 2AUFC paradigm (Equation 13) are based on unbiased estimates of VSTM capacity (see derivations of expected values of Kˆ in Appendix B). Thus, the reduction in the predicted variance obtained with the new 2AUFC paradigm is due to a reduction in measurement error.
11
R529
Change Detection
The new response introduced in the 2AUFC paradigm requires some metacognitive insight. Specifically, to use the “Don’t know” response efficiently, the participant must judge whether the probed item was encoded successfully. Thus, our new paradigm should be used with caution when testing participants that are likely to have reduced metacognitive abilities (e.g., children or psychiatric or neurological patients). If these participants guesses instead of using the “Don’t know” alternative, the variance of Kˆ should increase (cf. Equation 13). On the other hand, if a participant uses the “Don’t know” response excessively even when the probed item is encoded into VSTM, the estimate of VSTM should be reduced compared to its true value.
Experiment 1
To test our theoretical predictions we ran two successive experiments with the same participants. In Experiment 1, the participants served in alternating short blocks of trials in three conditions: (a) 2AFC single-probe change detection with a liberal guessing strategy (2AFC-lib), (b) 2AFC single-probe change detection with a conservative guessing strategy (2AFC-con), and (c) 2AUFC single-probe change detection with a conservative guessing strategy. Conditions b and c were designed to reduce the expected variance of the estimate of VSTM capacity in relation to the variance expected in Condition a where the standard 2AFC paradigm was used. The VSTM capacity K was estimated twice within each of these blocks, yielding a total of 10 estimates per condition in each participant. The variances of these estimates were then compared between the three conditions. Following the theoretical derivations above (cf. Equations 4 and 13), we should expect the variance of the K-estimates to be largest in the 2AFC-lib condition if participants were guessing ”Change” and ”No
12
R529
Change Detection
change” with the same probability of .5, second largest in the 2AFC-con condition, and smallest in the new 2AUFC paradigm.
Method
Participants A group of 21 students served as paid participants. The experiment took approximately 1 hr to complete. The participants’ mean age was 25.6 years (range 2035). All participants had normal or corrected-to-normal vision. Stimuli The stimulus material consisted of colored disks with a diameter subtending 0.96° of visual angle at a viewing distance of 80 cm. Seven colors were used: red, green, blue, yellow, purple, black, and white shown on a homogenous gray background. The disks were presented on an imaginary circle with a radius of 4.8° of visual angle from a central fixation cross. Procedure When adequately fixating the fixation cross in the middle of the screen, the participant initiated the presentation of the memory display comprising 8 colored disks located equidistantly along the periphery of the imaginary circle. The colors of the disks were selected with replacement, with the constraint that no color could appear more than twice in the same display. The disks were presented for 200 ms followed by a 1000 ms blank interval. After the delay, a single probe item – a colored disk – was shown at one of the previously occupied locations. In half the trials, the probe disk was identical
13
R529
Change Detection
in color to the corresponding disk in the memory display. In the other half of the trials, the probe appeared in a different color chosen randomly among the remaining six colors. The task of the participant was to decide whether (a) the probe disk was identical to the disk at the same location in the memory display or (b) a change in color had occurred. Each participant served in a total of 15 experimental blocks of 40 trials each: In the 5 blocks comprising the 2AFC-lib condition, a standard 2AFC (change/no change) response was required to the probe display and the participants were asked to “Perform the task as accurately as possible, guessing whenever unsure.” In the 5 blocks comprising the 2AFC-con condition, a similar 2AFC single-probe change detection paradigm was run. Here, however, the participants were instructed as follows: “Adopt a conservative guessing strategy and respond ’Change‘ only when fairly certain that a change has occurred.” In the 5 blocks comprising the 2AUFC condition, three different responses were allowed: ”Change”, ”No change”, and ”Don’t know”. Also here participants were encouraged to adopt a conservative guessing strategy, only responding ”Change” or ”No change” when fairly certain and otherwise responding ”Don’t know”. Blocks of each of the three types were run in alternating order and counterbalanced across the participants using a Latin square design. Before the experimental blocks the participants were familiarized with the experimental procedure in three warm-up blocks, one block of each type.
Results and Discussion
The mean hit rates calculated across the participants were .75 (SD = .15) in the 2AFC-lib condition, .56 (.18) in the 2AFC-con condition, and .53 (.18) in the 2AUFC
14
R529
Change Detection
condition. The corresponding mean false alarm rates were .38 (.18), .19 (.14), and .13 (.13). Further, the miss and correct rejection rates in the 2AUFC condition were .032 (.044) and .34 (.12), respectively. For each participant, estimates of VSTM capacity K and guessing rates Pgy and Pgn were then computed across all the trials in each of the three conditions using Equations 1-3 and 8-12, respectively. The mean estimates of K across participants in the three conditions were 2.96 (1.29), 2.94 (1.32), and 2.83 (.98), respectively, and did not differ significantly from each other, F < 1. Correspondingly, the correlation between the K estimates in the standard 2AFC-lib condition and the 2AFC-con and 2AUFC conditions were high: .89 (t[19] = 8.384, p < .0001, d = 3.847, prep > .999) and .89 (t[19] = 8.616, p < .0001, d = 3.953, prep > .999), respectively. Note that if the participants had used partial information to solve the task in the standard 2AFC change detection paradigm, one would have expected a lower K-estimate in the new 2AUFC when the possibility of responding “Don’t know” was introduced. Thus, our results are in line with other recent results suggesting that participants do not use partial information in change detection (see Rouder et al., 2008; Zhang & Luck, 2008). The estimated probabilities of guessing yes, Pgy, when the probed item from the array was not encoded into VSTM were .60 (.21), .33 (.22), and .24 (.19) and differed significantly between the three conditions (F(2,59) = 19.073, p < .0001, ηp2 = .393, prep > .999)1. Pairwise comparisons showed significant differences between the 2AFC-lib and the other two conditions. The mean estimated probability of guessing no, Pgn, in the 2AUFC condition was .011 (.10).
====================== Insert Figure 4 about here
15
R529
Change Detection
====================== For each participant we calculated 10 estimates of K (i.e., 10 values of Kˆ ) for each of the three conditions (2AFC-lib, 2AFC-con, and 2AUFC) – one estimate for each subblock of 20 consecutive trials (10 change and 10 no-change trials). Thus, NT in Equations 4 and 13 was equal to 10 in the present paradigm. For each participant in each condition, the sample variance of the 10 estimates for K defined the observed variance of the estimates. Corresponding theoretically predicted variances were calculated using the K, Pgy and Pgn from all 200 trials in each condition as plug-in estimates. Thus the estimates of the K, Pgy and Pgn parameters used to compute the predicted variances were not dependent on the observed variances computed across the 10 subblocks. The average results across participants for both observed and predicted variances of Kˆ are shown in Figure 4. A repeated measures ANOVA on the observed variances yielded a significant effect of experimental condition, F(2,59) = 9.6736, p < .0001, ηp2 = .247, prep > .993. Pairwise comparisons showed significant difference between the 2AUFC condition and each of the two 2AFC conditions. We calculated the goodness-of-fit as the correlation between individually observed and predicted variances of the K-estimates. The correlation was found to be .65. Estimating the variance of an estimate is inherently difficult, so we ran Monte Carlo simulations using the individually estimated values of K, Pgy, and Pgn across all trials to compare our observed measure of goodness-of-fit to the distribution of predicted correlations given the present sample of participants in the experiment and the number of trials run (using Equations 3, 4, 12, and 13). The expected correlation in the Monte Carlo simulations was found to be equal to .61 with a standard deviation of .059, very close to our observed correlation between predicted and observed variances of Kˆ .
16
R529
Change Detection
A closer look at the estimates of the guessing probability in the 2AFC-lib condition showed that the Pgy values varied considerably from participant to participant, ranging from .188 to .967. Thus, though all participants showed a decrease in Pgy between the 2AFC-lib and the 2AFC-con conditions, the change in guessing strategy of several participants moved the guessing probability closer to a value of .5 in the 2AFCcon condition. According to Equation 4, this should mask the effect of manipulating the guessing strategy between the 2AFC-lib and 2AFC-con conditions. To test this hypothesis, we split the measures of the observed variances of K in accordance with the estimated values of Pgy across the two 2AFC conditions. The split was done by dividing the Pgy values in two sets: those with values between .25 and .75 (i.e. closest to a value of .5) and the remaining values ranging between 0 and .25 and between .75 and 1, respectively. Comparing the observed variances in the two sets by a one tailed Welch two-sample t-test yielded a significantly larger mean variance for the set with Pgy values closer to .5, t(39.9) = 2.6, p < .001, d = .802, prep = .963. The mean observed variances for the two sets were 2.66 and 1.74, respectively. Corresponding predicted mean variances were 2.67 and 1.92, respectively.
Experiment 2
In Experiment 2, we tested the theoretical prediction that the variance of the estimate of VSTM capacity should increase systematically with the number of stimuli presented in the memory display (cf. Equation 4). Displays of 6, 8, or 12 colored disks were tested in a standard 2AFC single-probe change detection paradigm which was replicated ten times with each participant. The standard 2AFC change detection paradigm and the range of display sizes were chosen to maximize the effect of
17
R529
Change Detection
manipulating the memory set size on the variance of the K-estimate (cf. Equations 4 and 13), thus providing a good test of our theoretical predictions.
Method
Participants Twenty2 of the students who had served as participants in Experiment 1 also participated in Experiment 2. Stimuli The stimulus material was the same as the one used in Experiment 1. Procedure Except for the following details, the procedure was the same as in the first experiment: In Experiment 2, the number of stimuli (colored disks) in the memory display was either 6, 8, or 12. Ten blocks of 60 trials, each comprising 20 trials per display size, were run in a single session of about 1 hr. In all ten blocks, the participants were required to respond as accurately as possible, guessing whenever unsure, in accordance with the standard 2AFC change detection paradigm. Before the ten experimental blocks, a single warm-up block was run.
Results and Discussion
The mean hit rates across participants were .85 (SD = .086), .81 (.090), and .73 (.15) for memory set sizes 6, 8, and 12, respectively. Corresponding false alarm rates were .32 (.15), .43 (.15), and .47 (.18), respectively. From these values, estimates of
18
R529
Change Detection
VSTM capacity K and the guessing rate Pgy were computed using Equations 1-3 across all trials within each participant. The K estimates in the three conditions were 3.18 (.89), 2.96 (1.2), and 3.07 (1.6), respectively, and the guessing rates were estimated to .67 (.16), .68 (.13), and .63 (.19), respectively. Repeated measures ANOVA showed no effect of memory display size on the K estimates (F < 1) and a marginally significant effect on Pgy (F(1,3) = 3.8458, p = .057, ηp2 = .0898, prep = .868). ====================== Insert Figure 5 about here ====================== For each participant we then calculated 10 estimates of K for blocks of 20 trials (10 present and 10 absent trials) within each memory set size (6, 8, and 12 items). Thus, as in Experiment 1, NT was equal to 10 (cf. Equation 4). Then the sample variances across the 10 estimates of K were calculated for each set size. The average results across participants for both observed and predicted variances of K estimated by Equation 4 are shown in Figure 5. A repeated measures ANOVA yielded a significant effect of display size, F(1,39) = 43.094, p < .0001, ηp2 = .525, prep > .999, on the observed variance of Kˆ . Pairwise comparisons showed significant differences for all pairs of display sizes. The goodness-of-fit was calculated as the correlation between individually observed and predicted variances of the K-estimates and equalled .77. We ran Monte Carlo simulations using the individually estimated values of K and Pgy across all trials to compare our observed measure of goodness-of-fit to the distribution of predicted correlations given the present sample of participants in the experiment and the number of trials run (using Equations 3 and 4). The expected correlation in the Monte Carlo simulations was found to be equal to .78 with a standard deviation of .051, again very close to our observed correlation between predicted and observed variances of Kˆ .
19
R529
Change Detection
Finally, we compared estimates of VSTM capacity K between Experiments 1 and 2 in the standard 2AFC change detection condition with 8 items to be remembered. This gave us an estimate of the reliability of the estimates when tested on different days in the same participant. The correlation coefficient between the two estimates of K when 8 stimuli were to be remembered was .87 (t(18) = 7.609, p < .0001, d = 3.587, prep > .999). A paired t test yielded no significant difference between the estimates from the two experiments, t(19) = .0277, p = .978. Despite the high correlation found both within Experiment 1 and between the two experiments, we would like to emphasise that there is always a relative benefit of reducing the variance of Kˆ using the new 2AUFC paradigm. The absolute reduction in the variance of Kˆ may not be large when many trials are run, as was the case when estimating K across all the 200 trials in Experiments 1 and 2. However, it is generally desirable to reduce the number of trials per condition to a minimum so that further conditions may be included in an experiment. Also, at the individual level, getting more precise estimates of K by minimizing the variance of Kˆ is an important consideration.
General Discussion
Summary In this article, we first derived closed-form formulas for the theoretical variance of estimates for VSTM capacity K in standard single-probe change detection. The theoretically derived values of the variance closely predict corresponding observed variances in Kˆ when measured repeatedly in the same individual. Second, we showed that the variance of estimates of K can be reduced by about 50% by using a new 2-alternative unforced choice version of the single-probe change
20
R529
Change Detection
detection paradigm. In this new paradigm, the participant is not forced to respond ”Change” or ”No change”, but is allowed to refrain from guessing by responding ”Don’t know”. Third, we showed that the guessing strategy of the participants influences the variance of Kˆ in the standard single-probe change detection paradigm. The variance was minimized when participants adopted a conservative guessing strategy and maximized when participants guessed ”Change” and “No change” with equal probabilities. Finally, we manipulated the number of items to be remembered in single-probe change detection and showed that the variance of the estimates of K increased strongly with the number of items to be remembered. The increase in the variance of Kˆ with memory set size was again very well predicted by our theoretical derivations. Recommendations Three straightforward recommendations to optimize the reliability when measuring VSTM capacity by change detection follows from the present work: (a) Use the new 2-alternative unforced paradigm rather than a standard 2-alternative forced choice change detection paradigm, (b) use a memory set size which is as small as possible, though above the VSTM capacity of the participant, and (c) instruct the participant to adopt a conservative guessing strategy, only responding ”Change” or “No change” when fairly certain that the response is correct. Extensions Our methods of analysis can be extended to other paradigms than change detection. A case in point is the change localization paradigm introduced by Luck and
21
R529
Change Detection
his collaborators (e.g., Gold et al., 2006, Experiment 5). In this paradigm, one of NS items changes on each trial and the participant must report which item changed, guessing whenever unsure. By the model proposed by Gold et al. (2006), the probability of correct report, p, equals (K + 1)/NS. This model makes the strong assumption that all items in VSTM are compared with the corresponding items in the changed display without any errors being made. When the assumptions of the model are satisfied, K can be estimated by N S pˆ − 1 , where pˆ is the observed proportion of correct responses. By the methods of analysis employed in this article, the variance of this estimate for K can be shown to equal
V ( Kˆ ) =
( N S − K − 1)( K + 1) , N
where N is the total number of trials. Thus, the variance of the estimate for K is comparable to the variance obtained with our 2AUFC single-probe change detection paradigm when the total number of trials (given by N and 2NT, respectively) is the same for the two paradigms and guessing rates are low in the change detection paradigm.
22
R529
Change Detection
References
Alvarez, G. A., & Cavanagh, P. (2004). The capacity of visual short-term memory is set both by visual information load and by number of objects. Psychological Science, 15, 106-111. Awh, E., Barton, B., & Vogel, E. K. (2007). Visual working memory represents a fixed number of items regardless of complexity. Psychological Science, 18, 622-628. Bays, P. M., & Husain, M. (2008). Dynamic shifts of limited working memory resources in human vision. Science, 321, 851-854. Bundesen, C. (1990). A theory of visual attention. Psychological Review, 97, 523-547. Bundesen, C., Habekost, T., & Kyllingsbaek, S. (2005). A neural theory of visual attention: bridging cognition and neurophysiology. Psychological Review, 112, 291-328. Cattell, J. M. (1885). The time it takes to recognize and name letters, pictures, and colors (translated from German). Philosophische Studien, 2, 635-650. Cowan, N. (2001). The magical number 4 in short-term memory: a reconsideration of mental storage capacity. Behavioral and Brain Sciences, 24, 87-114; discussion 114-185. Cowan, N., Elliott, E. M., Scott Saults, J., Morey, C. C., Mattox, S., Hismjatullina, A., et al. (2005). On the capacity of attention: its estimation and its role in working memory and cognitive aptitudes. Cognitive Psychology, 51, 42-100. Eng, H. Y., Chen, D., & Jiang, Y. (2005). Visual working memory for simple and complex visual stimuli. Psychonomic Bulletin & Review, 12, 1127-1133. Gold, J. M., Fuller, R. L., Robinson, B. M., McMahon, R. P., Braun, E. L., & Luck, S. J. (2006). Intact attentional control of working memory encoding in schizophrenia. Journal of Abnormal Psychology, 115, 658-673. Luck, S. J., & Vogel, E. K. (1997). The capacity of visual working memory for features and conjunctions. Nature, 390, 279-281. Olsson, H., & Poom, L. (2005). Visual memory needs categories. Proceedings of the National Academy of Sciences of the United States of America, 102, 8776-8780. Pashler, H. (1988). Familiarity and visual change detection. Perception & Psychophysics, 44, 369-378. Phillips, W. A. (1974). On the distinction between sensory storage and short-term visual memory. Perception & Psychophysics, 16, 283-290. Rouder, J. N., Morey, R. D., Cowan, N., Zwilling, C. E., Morey, C. C., & Pratte, M. S. (2008). An assessment of fixed-capacity models of visual working memory. Proceedings of the National Academy of Sciences of the United States of America, 105, 5975-5979. Scolari, M., Vogel, E. K., & Awh, E. (2008). Perceptual expertise enhances the resolution but not the number of representations in working memory. Psychonomic Bulletin & Review, 15, 215-222. Shibuya, H., & Bundesen, C. (1988). Visual selection from multielement displays: measuring and modeling effects of exposure duration. Journal of Experimental Psychology: Human Perception and Performance, 14, 591-600. Sperling, G. (1960). The information available in brief visual presentations. Psychological Monographs, 74. Sperling, G. (1963). A model for visual memory tasks. Human Factors, 5, 19-31.
23
R529
Change Detection
Sperling, G. (1967). Successive approximations to a model for short term memory. Acta psychologica, 27, 285-292. Todd, J. J., & Marois, R. (2004). Capacity limit of visual short-term memory in human posterior parietal cortex. Nature, 428, 751-754. Vogel, E. K., & Awh, E. (2008). How to exploit diversity for scientific gain. Current Directions in Psychological Science, 17, 171-176. Vogel, E. K., & Machizawa, M. G. (2004). Neural activity predicts individual differences in visual working memory capacity. Nature, 428, 748-751. Vogel, E. K., Woodman, G. F., & Luck, S. J. (2001). Storage of features, conjunctions and objects in visual working memory. Journal of Experimental Psychology: Human Perception and Performance, 27, 92-114. Winer, B. J., Brown, D. R., & Michels, K. M. (1991). Statistical principles in experimental design. New York: McGraw-Hill. Zhang, W., & Luck, S. J. (2008). Discrete fixed-resolution representations in visual working memory. Nature, 453, 233-235.
24
R529
Change Detection
25
Appendix A
Variances of the Estimates of VSTM capacity K in 2AFC and 2AUFC Single-Probe Change Detection
The variance of the estimate Kˆ of VSTM capacity K can be derived if we assume that the number of hit trials out of a total of NT change trials is binomially distributed with parameters n = NT and p = P(H), and the number of false alarm trials out of NT nochange trials is binomially distributed with parameters n = NT and p = P(FA). From
( [
])
[(
) (
)]
V ( Kˆ ) = V N S Pˆ (H) − Pˆ (FA) = N S2 V Pˆ (H) + V Pˆ (FA) ,
N P(H)[1 − P(H)] V Pˆ (H) = V H = , NT NT
(
)
and
N P( FA )[1 − P( FA )] V Pˆ ( FA ) = V FA = , NT NT
(
)
we get
P ( H )[1 − P ( H )] + P ( FA )[1 − P ( FA )] V ( Kˆ ) = N S2 NT = N S2 =
[K
N S + (1 − K N S )Pgy ][1 − K N S − (1 − K N S )Pgy ] + [(1 − K N S )Pgy ][1 − (1 − K N S )Pgy ]
(N S − K )[K + 2 Pgy (1 − Pgy )(N S − K )] NT
NT .
R529
Change Detection
26
The variance of the estimate of VSTM capacity, K, in 2AUFC single-probe change detection can be derived in a similar way. From
V ( Kˆ ) = V (N S [Pˆ (H) − Pˆ (FA) + Pˆ (CR ) − Pˆ (M )]/ 2) = 1 4 N S2 [V (Pˆ (H) − Pˆ (M ) ) + V (Pˆ (CR ) − Pˆ (FA) )],
(
)
N N N N V Pˆ ( H ) − Pˆ ( M ) = V H + V M − 2Cov H , M NT NT NT NT P( H )[1 − P( H )] P( M )[1 − P( M )] P( H ) P( M ) = + +2 , NT NT NT
and
(
)
N N N N V Pˆ (CR ) − Pˆ ( FA) = V CR + V FA − 2Cov CR , FA NT NT NT NT P(CR )[1 − P(CR )] P( FA)[1 − P( FA )] P(CR ) P( FA ) = + +2 , NT NT NT
we get
P ( H )[1 − P( H )] + P ( M )[1 − P ( M )] + 2 P ( H ) P ( M ) + P (CR )[1 − P (CR )] + P ( FA )[1 − P( FA )] + 2 P (CR ) P ( FA ) [K N S + (1 − K N S )Pgy ][1 − K N S − (1 − K N S )Pgy ] + [(1 − K N S )Pgn ][1 − (1 − K N S )Pgn ] N S2 + 2[K N S + (1 − K N S )Pgy ][(1 − K N S )Pgn ] = 4 N T + [K N S + (1 − K N S )Pgn ][1 − K N S − (1 − K N S )Pgn ] + [(1 − K N S )Pgy ][1 − (1 − K N S )Pgy ] + 2[K N + (1 − K N )P ][(1 − K N )P ] S S gn S gy
N2 V ( Kˆ ) = S 4NT
=
(N S − K )[K + N S (Pgy + Pgn ) − (N S − K )(Pgy − Pgn )2 ] 2NT
.
R529
Change Detection
Appendix B
Proofs that Estimators of VSTM capacity K in 2AFC and 2AUFC Single-Probe Change Detection are Unbiased
Given the same assumptions as when deriving the variance of the estimates in Appendix A, the corresponding expected values of Kˆ may be derived for both the 2AFC and 2AUFC paradigms. From
E ( Kˆ ) = E (N S [Pˆ (H ) − Pˆ (FA )]) = N S [E (Pˆ (H ) ) + E (Pˆ (FA ) )],
N E (Pˆ (H ) ) = E H NT
1 1 = E (N H ) = N T P( H) = P (H ) , NT NT
and
N E (Pˆ (FA ) ) = E FA NT
1 1 = E (N FA ) = N T P( FA ) = P( FA ) , NT NT
we get
[
E ( Kˆ ) = N S K N S + (1 − K N S )Pgy − (1 − K N S )Pgy
= N S [K N S ] = K .
Thus, Kˆ is an unbiased estimator of K.
]
27
R529
Change Detection
28
The expected values of the estimate for VSTM capacity Kˆ in 2AUFC single-probe change detection can be derived in a similar way. From
( [(
[ ) (
])
E ( Kˆ ) = E ½ N S Pˆ (H ) − Pˆ (FA) + Pˆ (CR ) − Pˆ (M ) = ½ N S E Pˆ (H ) + E Pˆ ( FA) + E Pˆ (CR ) − E Pˆ (M ) ,
) (
) (
)]
N 1 1 E (Pˆ ( H ) ) = E H = E (N H ) = N T P(H ) = P(H ) , NT NT NT
N E (Pˆ (FA) ) = E FA NT
1 1 = E (N FA ) = N T P( FA) = P( FA) , N N T T
N E (Pˆ (CR ) ) = E CR NT
1 1 = E (N CR ) = N T P (CR ) = P(CR ) , NT NT
and
N E (Pˆ (M ) ) = E M NT
1 1 = E (N M ) = N T P (M ) = P (M ) , NT NT
we get
[
E ( Kˆ ) = ½ N S K N S + (1 − K N S )Pgy − (1 − K N S )Pgy + K N S + (1 − K N S )Pgn − (1 − K N S )Pgn
= ½ N S [2 K N S ] = K .
Again, Kˆ is an unbiased estimator of K.
]
R529
Change Detection
29
Footnotes
1
All accuracy data (proportions of correct responses) were arcsin ( 2 arcsin
( p ))
transformed to stabilize the variances before the ANOVAs were performed (see Winer, Brown, & Michels, 1991, pp. 354-358).
2
A single participant only completed the first experiment.
R529
Change Detection
Author Note
Søren Kyllingsbæk and Claus Bundesen, Center for Visual Cognition, Department of Psychology, University of Copenhagen, Denmark. We would like to thank Steven Luck, Nelson Cowan, Ed Awh, and two anonymous reviewers for helpful comments on an earlier version of the paper and Malene Foldager and Kristine Swierkosz Kristjansen for assisting with the data collection. The research was supported by grants from the Danish Council for Strategic Research (S.K.), the Danish Research Council for the Humanities (C.B. & S.K.), and the University of Copenhagen (C.B. & S.K.). Correspondence concerning this article should be addressed to Søren Kyllingsbæk, Center for Visual Cognition, Department of Psychology, University of Copenhagen, Øster Farimagsgade 2A, DK-1353 Copenhagen K, Denmark. E-mail:
[email protected].
30
R529
Change Detection
Figure Captions
Figure 1. Tree diagram of Cowan’s model (Cowan, 2001) of 2AFC single-probe change detection where the probe is shown at a previously occupied location. As an example, a hit in a change present trial may either be accomplished by successfully encoding the probed item with probability K/NS or by not encoding the probe with probability 1 - K/NS but guessing yes (”Change”) with probability Pgy. CR = correct rejection, FA = false alarm.
Figure 2. Graphs showing the effect of varying K, Pgy and NS on the variance of the estimate of VSTM capacity, Kˆ , in the standard 2AFC change detection paradigm (cf. Equation 4). NT was set equal to 10.
Figure 3. Model for the new 2AUFC single-probe change detection paradigm. CR = correct rejection, FA = false alarm, ?C = “Don’t know” response in change trial, ?C = “Don’t know” response in no-change trial.
Figure 4. The mean observed and theoretically predicted variance of the estimate of VSTM capacity, Kˆ , measured across participants in the three different conditions of Experiment 1 (2AFC single-probe change detection with a liberal guessing strategy, 2AFC single-probe change detection with a conservative guessing strategy, and the new 2AUFC single-probe change detection with a conservative guessing strategy). Error bars indicate standard error of means across participants.
31
R529
Change Detection
Figure 5. The mean observed and theoretically predicted variance of the estimate of VSTM capacity, Kˆ , measured across participants for memory displays with 6, 8 and 12 items in Experiment 2. Error bars indicate standard error of means across participants.
32
R529
Change Detection
33
Figure 1
Change?
Absent (50%)
Present (50%)
Encode?
(1-K/NS)
Encode?
(1-K/NS)
(K/NS)
Guess?
Guess?
(1-Pgy) (Pgy)
(1-Pgy) (Pgy)
CR
FA
CR
Miss
Hit
(K/NS)
Hit
R529
Change Detection
34
Figure 2
K=2
K=3
5
5
V(K)
V(K)
0.0
0
0.0
0
10
10
5
Pg
NS
Pg
NS
y
0.5
y
0.5 5
1.0
1.0
K=4
K=5
5
5
V(K)
V(K)
0.0
0 10
0.0
0 10
Pg
5
0.5 y
NS
NS
Pg
y
0.5 5
1.0
1.0
R529
Change Detection
35
Figure 3
Change?
Present (50%)
Absent (50%)
Encode?
(1-K/NS)
Encode?
(1-K/NS) (K/NS)
(K/NS)
Guess?
(1-Pgn-Pgy) (Pgn)
?C
CR
Guess?
(Pgy)
(1-Pgn-Pgy) (Pgn)
FA
CR
?C
Miss
(Pgy)
Hit
Hit
R529
Change Detection
4
Figure 4
2 1 0
^ Var(K)
3
Obs. Prd.
2AFC-lib
2AFC-con
2AUFC
36
R529
Change Detection
8
Figure 5
4 2 0
^ Var(K)
6
Obs. Prd.
6
8 Memory Set Size
12
37