The copyright holder for this preprint (which was not . http://dx.doi.org/10.1101/069617 doi: bioRxiv preprint first posted online Aug. 15, 2016; ...
bioRxiv preprint first posted online Aug. 15, 2016; doi: http://dx.doi.org/10.1101/069617. The copyright holder for this preprint (which was not peer-reviewed) is the author/funder. It is made available under a CC-BY 4.0 International license.
Changes in brain morphology and working memory capacity over childhood a
a
a
Joe Bathelt , Susan Gathercole , Amy Johnson , Duncan Astle
a
MRC Cognition and Brain Sciences Unit 15 Chaucer Road Cambridge CB2 7EF
a
bioRxiv preprint first posted online Aug. 15, 2016; doi: http://dx.doi.org/10.1101/069617. The copyright holder for this preprint (which was not peer-reviewed) is the author/funder. It is made available under a CC-BY 4.0 International license.
1 Abstract Developmental improvements in working memory are important in the acquisition of new skills, like reading and maths. Current accounts of the brain systems supporting working memory rarely take development into account. However, understanding the development of these skills, and in turn where this development can go awry, will require more sophsiticated neuropsychological accounts that fully consider the role of development. The current study investigated how structural brain correlates of components of the working memory system change over developmental time. Verbal and visuospatial short-term and working memory were assessed in 153 children between 6 and 16 years and latent components of the working memory system were derived using principal component analysis. Further, fractional anisotropy and cortical thickness maps were derived from T1-weighted and diffusion-weighted MRI and processed using eigenanatomy decomposition, an advanced dimensionality reduction method for neuroimaging data. We were then able to explore how the structural brain correlates of working memory gradually shifted across childhood. Regression modelling indicated greater involvement of the corpus callosum and posterior temporal white matter in younger children for performance associated with the executive part of the working memory system, while thickness of the occipitotemporal cortex was more predictive in older children. These findings are consistent with an account in which increasing specialisation leads to shifts in the contribution of neural substrates over developmental time, from early reliance on a distributed system supported by long-range connections to later reliance on specialised local circuitry. Furthemore, our findings emphasise the importance of taking development into account when considering the neural systems that support complex cognitive skills, like working memory.
2
bioRxiv preprint first posted online Aug. 15, 2016; doi: http://dx.doi.org/10.1101/069617. The copyright holder for this preprint (which was not peer-reviewed) is the author/funder. It is made available under a CC-BY 4.0 International license.
2 Introduction Working memory is a limited-capacity system for retaining and processing information over brief periods of time. It plays an important role in the acquisition of complex cognitive skills (Cowan, 2013) such as reading (Cain, Oakhill, & Bryant, 2004), maths (Dumontheil & Klingberg, 2011), and other school subjects (Gathercole, Pickering, Knight, & Stegmann, 2003, ClairThompson & Gathercole, 2006). Deficits in working memory have been identified across a range of neurodevelopmental disorders, including attention deficit hyperactivity disorder (Martinussen, Hayden, Hogg-Johnson, & Tannock, 2005, Holmes et al., 2014), dyslexia (Smith-Spark & Fisk, 2007), dyscalculia (Rotzer et al., 2009, Szucs et al., 2013), and language disorders (Gathercole & Baddeley 1989; Archibald & Gathercole 2006; Montgomery, 2000, Ellis Weismer, Evans, & Hesketh, 1999). Working memory develops gradually through early and middle childhood (Huizinga, Dolan, & Molen, 2006, Gathercole, Pickering, Ambridge, & Wearing, 2004, Siegel & Ryan, 1988). It is assumed that this development reflects the maturation of the brain system supporting this skill in adulthood. However, understanding the potential causes of working memory impairments in childhood necessitates a neuropsychological account that incorporates developmental change. Currently we have no detailed understanding of how age-related changes in brain organisation support developmental improvements in working memory. The purpose of this study is to redress this.
2.1 Working Memory and its development There are many theoretical accounts of working memory. The influential multicomponent model of working memory advanced by Baddeley and Hitch (A. D. Baddeley & Hitch, 1974) consists of three subcomponents: two domainspecific stores and a central executive. The stores are specialized for the retention of material in either phonological (A. Baddeley, 1987) or visuospatial format (A. D. Baddeley & Lieberman, 1980, Logie, 1986). The central executive is a system responsible for a range of regulatory functions, including attention, the control of action, and problem solving (A. Baddeley, 1996). There have been many refinements of the original model (A. Baddeley, 2000, 2003, 2012; Burgess & Hitch, 1996), and several new accounts. Some of these elaborate on specific mechanisms within working memory. For instance, Engle and colleagues add inhibitory processes that protect activated memory
3
bioRxiv preprint first posted online Aug. 15, 2016; doi: http://dx.doi.org/10.1101/069617. The copyright holder for this preprint (which was not peer-reviewed) is the author/funder. It is made available under a CC-BY 4.0 International license.
traces from disruption (Engle, 2002, Kane, Conway, Hambrick, & Engle, 2007). Other models integrate short-term memory with long-term memory, suggesting that working memory represents long-term memory in an activated state (Cowan, 1988, 1999; Oberauer 2002), and activation is guided by an attentional mechanism. Others have extended the scope of WM to encompass other processes that include updating (Ecker et al., 2010; Schmiedek et al., 2014; Shelton et al, 2010), set shifting and relational binding (Oberauer et al., 2003; von Bastian & Oberauer, 2013) and fluid intelligence (Engle et al., 1999). In short, there exists a rich literature in which the specific cognitive mechanisms underlying working memory in adulthood are keenly debated. Multiple tasks are needed to establish the underlying latent factor structure supporting working memory performance rather than simply characterise the cognitive structure of individual tasks. Using this individual differences approach, the three-factor structure has been robustly reproduced across multiple studies and age groups (T. P. Alloway, Gathercole, Willis, & Adams, 2004; Kane et al., 2004; Bayliss et al., 2003; Hornung, Brunner, Reuter, & Martin, 2011). In each case, the best-fitting model consisted of two domain-specific storage processes and an additional executive component similar to those outlined in the original Baddeley and Hitch (A. Baddeley, 2003, 2012) account. These components are already detectable in preschoolage children (T. P. Alloway et al., 2004) and their configuration remains stable throughout childhood (Gathercole et al., 2004). Despite this stable factor structure, overall working memory performance changes substantially over childhood (Huizinga et al., 2006, Gathercole et al., 2004, Siegel & Ryan, 1988), increasing linearly from 6 years until adult performance is reached in adolescence (Gathercole et al., 2004, Luciana, Conklin, Hooper, & Yarger, 2005). Different cognitive mechanisms may contribute to improvements across different periods (Huizinga et al., 2006, Gathercole et al., 2004, Siegel & Ryan, 1988). These may include increased storage capacity (Cowan, Ricker, Clark, Hinrichs, & Glass, 2014), improvements in attention (Barrouillet, Gavens, Vergauwe, Gaillard, & Camos, 2009, Tam, Jarrold, Baddeley, & SabatosDeVito, 2010), and changes in rehearsal strategy (Hitch, Halliday, Schaafstal, & Heffernan, 1991, Gathercole, Adams, & Hitch, 1994).
2.2 Neural correlates of working memory The developmental period associated with increases in working memory is also accompanied by pronounced changes in brain structure. These include decreasing cortical thickness (Sowell, 2004) and increasing myelination of white matter tracts (Dean et al., 2014). Functional neuroimaging studies
4
bioRxiv preprint first posted online Aug. 15, 2016; doi: http://dx.doi.org/10.1101/069617. The copyright holder for this preprint (which was not peer-reviewed) is the author/funder. It is made available under a CC-BY 4.0 International license.
suggest that improvements in working memory are accompanied by some reorganisation in brain networks: In adults, a specialised network including bilateral parietal, cingulate, and prefrontal areas has been found to show increased blood oxygenation during working memory tasks (Owen, McMillan, Laird, & Bullmore, 2005, Wager & Smith, 2003). Children show activation in a similar set of regions (Thomason et al., 2009) and also in additional outside of the core processing network observed in adults (Vogan, Morgan, Powell, Smith, & Taylor, 2016, Ciesielski, Lesnik, Savoy, Grant, & Ahlfors, 2006). Research on structural neural correlates of working memory is more limited, but where studies exist they broadly concur with the functional findings. Frontal and parietal grey matter volume (Mahone, Martin, Kates, Hay, & Horska, 2009, Rossi et al., 2013), and temporal and parietal connections of the corpus callosum (Treble et al., 2013), are significant predictors of a participant’s working memory capacity. However, these studies either investigate narrow age ranges or statistically correct for the effect of age. As a result, little is known about how structural brain changes support the development of particular cognitive skills like working memory. Furthermore, the majority of previous studies have used performance on individual tasks to measure working memory ability (see (Poldrack & Yarkoni, 2016) for a detailed discussion). This approach has two key limitations. First, it is widely accepted that multiple underlying components underpin performance (Conway, Cowan, Bunting, Therriault, & Minkoff, 2002, T. P. Alloway et al., 2004, Clair-Thompson & Gathercole, 2006, Oberauer, Süß, Schulze, Wilhelm, & Wittmann, 2000). Second, scores on individual tests also reflect task-specific components that may be unrelated to WM demands (such as proficiency in the stimulus domain from which the stimuli are drawn, Dark & Benbow, 1994) as well as significant levels of error. The purpose of the current study was to redress these two gaps in the literature by i) exploring how structural brain correlates of working memory, in terms of both grey and white matter, change over developmental time; and ii) using multiple behavioural assessments alongside a theory-driven factor analysis, to differentiate the neural correlates of robustly determined cognitive components of WM.
5
bioRxiv preprint first posted online Aug. 15, 2016; doi: http://dx.doi.org/10.1101/069617. The copyright holder for this preprint (which was not peer-reviewed) is the author/funder. It is made available under a CC-BY 4.0 International license.
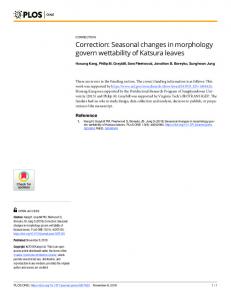
3 Methods Our analysis approach used data reduction techniques to reduce raw behavioural and neuroimaging measures to underlying statistical components. We then explored how the underlying cognitive factors of the working memory system were associated with structural brain components, and the extent to which these relationships were moderated by developmental stage (i.e. age). A schematic summary of this approach can be seen in Figure 1. The computer code used for data processing and statistical analysis is available online (https://github.com/joebathelt/ WorkingMemory_and_BrainStructure_Code).
Figure 1: Overview of processing steps from raw to latent data. Raw behavioural data were decomposed with principal component analysis (PCA) to derive factor scores that corresponded to a verbal, visuo-spatial, and executive factor. Dimensionality reduction was also applied to cortical thickness maps and FA maps derived from T1-weighted and diffusionweighted MRI data to obtain Eigenanatomy components.
3.1 Participants The data for the current study were taken from two large-scale studies at the MRC Cognition and Brain Sciences Unit. These two studies had different recruitment criteria but when combined, provide a large sample of children with working memory scores whose distributional properties closely approximated the standardisation sample. The first study was the Centre for Attention, Learning, and Memory (CALM) research clinic. At the clinic, children aged between 5 and 18 years were recruited on the basis of ongoing problems in attention, learning and memory identified by professionals working in schools or specialist children’s community services. If parents expressed interest in participating in the research study, the professionals
6
bioRxiv preprint first posted online Aug. 15, 2016; doi: http://dx.doi.org/10.1101/069617. The copyright holder for this preprint (which was not peer-reviewed) is the author/funder. It is made available under a CC-BY 4.0 International license.
made an initial referral that was followed-up by CALM staff to discuss the nature of the child’s problems. If difficulties in one or more areas of attention, learning or memory were indicated by the referrer, the family were invited to the CALM clinic at the MRC Cognition and Brain Sciences Unit in Cambridge for an assessment that lasted approximately 3 hours. The assessment included the working memory battery reported here. Exclusion criteria for referrals were significant or severe known problems in vision or hearing that were uncorrected, and having a native language other than English. This study was approved by the local NHS research ethics committee (Reference: 13/EE/0157). Written parental consent was obtained and children provided verbal assent. The second study investigated the neural, cognitive, and environmental markers of risk and resilience in children. Children between 7 and 12 years attending mainstream school in the UK with normal or corrected-to-normal vision or hearing and no history of brain injury were recruited via local schools and through advertisement in public places (childcare and community centres, libraries). Participating families were invited to the MRC Cognition and Brain Sciences Unit for a 2-hour assessment that included the working memory battery reported here. Participants received monetary compensation for taking part in the study. This study was approved by the Psychology Research Ethics Committee at the University of Cambridge (Reference: 2015.11). Parents provided written informed consent. MRIs were obtained from 153 children between 6 and 16 years (96 boys, age in months: M=115.79, SD=23.779). 31 children were excluded from cortical thickness analysis because the T1-weighted data was not usable due to participant movement. 41 children were excluded from analysis of diffusionweighted data due to head movement above 3mm in the DWI sequence. Residual movement estimates were included as a nuisance variable in regression models. As these measures did not influence the results, they were omitted from the reported models.
3.2 Working Memory Assessment The Digit Recall, Backward Digit Recall, Dot Matrix, and Mr X task of the Automatic Working Memory Assessment (AWMA) (T. Alloway, 2007, T. P. Alloway, Gathercole, Kirkwood, & Elliott, 2008) were administered individually. In Digit Recall, children repeat sequences of single-digit numbers presented in an audio format. In Backward Digit Recall, children repeat the sequence in backward order. These tasks were selected to engage verbal shortterm and working memory respectively. For the Dot Matrix task, the child is shown the position of a red dot for two seconds in a series of four by four
7
bioRxiv preprint first posted online Aug. 15, 2016; doi: http://dx.doi.org/10.1101/069617. The copyright holder for this preprint (which was not peer-reviewed) is the author/funder. It is made available under a CC-BY 4.0 International license.
matrices and has to recall this position by tapping the squares on the computer screen. In the Mr. X task, the child is shown a series of Mr. X figures and has to identify whether they are holding the ball in the same or different hands. One Mr. X is rotated in each trial. The child then has to recall the location of the ball in Mr. X’s hand by pointing to one of eight compass points. These tasks were aimed at tapping short-term and working visuo-spatial memory. Standardised scores established that the sample performed at expected levels for their age ( i.e. mean of 100 and a standard deviation of 15, Digit Recall: mean = 96.39; std = 16.32; Backward Digit Recall: mean = 94.61, std = 12.671; Dot Matrix: mean = 98.29, std = 15.595; Mr X: mean = 99.32, std = 15.69). In order to reconstruct the latent variable structure of working memory from the assessment data, principal component analysis was applied. This was carried out using the ’principal’ function of the psych package v1.5.1 (http://personality-project.org/r) in R v3.1.3 (R Development Core Team, 2008). Varimax rotation was used to create orthogonal factors (Kaiser, 1958). A 3-factor solution provided the best fit with theoretical predictions and explained a large proportion of variance in the assessment scores. Mahalanobis distance was computed to detect outliers in the assessment data, but no data point exceeded the recommended cut-off at 3 degrees of freedom.
3.3 MRI data acquisition Magnetic resonance imaging data were acquired at the MRC Cognition and Brain Sciences Unit, Cambridge U.K. All scans were obtained on the Siemens 3 T Tim Trio system (Siemens Healthcare, Erlangen, Germany), using a 32channel quadrature head coil. The imaging protocol consisted of two sequences: T1-weighted MRI and a diffusion-weighted sequence. T1-weighted volume scans were acquired using a whole brain coverage 3D Magnetisation Prepared Rapid Acquisition Gradient Echo (MP RAGE) sequence acquired using 1mm isometric image resolution. Echo time was 2.98 ms, and repetition time was 2250 ms. Diffusion scans were acquired using echo-planar diffusion-weighted images with an isotropic set of 60 non-collinear directions, using a weighting factor of b=1000s*mm-2, interleaved with 4 T2-weighted (b = 0) volumes. Whole brain coverage was obtained with 60 contiguous axial slices and isometric image resolution of 2mm. Echo time was 90 ms and repetition time was 8400 ms.
8
bioRxiv preprint first posted online Aug. 15, 2016; doi: http://dx.doi.org/10.1101/069617. The copyright holder for this preprint (which was not peer-reviewed) is the author/funder. It is made available under a CC-BY 4.0 International license.
3.4 Processing of diffusion-weighted data Diffusion imaging makes it possible to quantify the rate of water diffusion in the brain. In the parallel bundles of white matter, diffusion is stronger along the fibre orientation, but is attenuated in the perpendicular direction. This can be summarized by the metric of fractional anisotropy (FA), which is a scalar value between 0 and 1 describing the degree of anisotropy of the diffusion at every voxel. Developmental studies show steady increases in FA between childhood and adulthood (Imperati et al., 2011, Muftuler et al., 2012, Westlye et al., 2009), which is likely to reflect increased myelination (Dean et al., 2014). A number of processing steps are necessary to derive FA maps from diffusion-weighted volumes. In the current study, diffusion-weighted MRI scans were converted from the native DICOM to compressed NIfTI-1 format using the dcm2nii tool http://www.mccauslandcenter.sc.edu/mricro/ mricron/dcm2nii.html. Subsequently, the images were submitted to the DiPy v0.8.0 implementation (Garyfallidis et al., 2014) of a non-local means denoising algorithm (Coupe et al., 2008) to boost signal to noise ratio. Next, a brain mask of the b0 image was created using the brain extraction tool (BET) of the FMRIB Software Library (FSL) v5.0.8. Motion and eddy current correction were applied to the masked images using FSL routines. The corrected images were re-sliced to 1mm resolution with trilinear interpolation using in-house software based on NiBabel v2.0.0 functions (http://nipy.org/nibabel/). Finally, fractional anisotropy maps were created based on a diffusion tensor model fitted through the FSL dtifit algorithm (Behrens et al., 2003, Johansen-Berg et al., 2004). For comparison across participants, we created a study-specific FAtemplates based on all available images using Advanced Normalization Tools (ANTs) algorithms (Lawson, Duda, Avants, Wu, & Farah, 2013, B. B. Avants et al., 2014), which showed the highest accuracy in software comparisons (Klein et al., 2009, Murphy et al., 2011, Tustison et al., 2014). Individual images were transformed to template space using non-linear registration with symmetric diffeomorphic normalization as implemented in ANTs (B. Avants, Epstein, Grossman, & Gee, 2008). Next, the images were eroded twice with a 3mm sphere to remove brain edge artefacts using FSL maths.
3.5 Processing of T1-weighted data Another measure of brain development that can be derived from neuroimaging data is cortical thickness (Giedd & Rapoport, 2010, Gogtay et al., 2004). Cortical thickness is defined as the distance between the outer edge
9
bioRxiv preprint first posted online Aug. 15, 2016; doi: http://dx.doi.org/10.1101/069617. The copyright holder for this preprint (which was not peer-reviewed) is the author/funder. It is made available under a CC-BY 4.0 International license.
of cortical grey matter and subcortical white matter (Fischl & Dale, 2000). To obtain thickness measure moments from anatomical MRI data, T1-weighted volumes were initially co-registered with MNI152 space using rigid coregistration in order to obtain good initial between-subject alignment and optimal field of view. Next, all images were visually inspected and images with pronounced motion artefact were removed from further analysis (n=31, 20.25% of the acquired data). The remaining data was submitted to the automatic ANTs cortical thickness pipeline (antsCorticalThickness). Details about the processing pipeline and thickness estimation are described in (Tustison et al., 2014) and (Das, Avants, Grossman, & Gee, 2009). Tissue priors were taken from the OASIS-TRT-20 template (http://www.mindboggle.info/data.html#mindboggle-software-data). Subsequently, images in template space were smoothed using a 10mm full width at half maximum (FWHM) Gaussian kernel and resampled to 2mm resolution. A thickness mask was created by averaging all images and binarizing the resulting mean image at a threshold of 0.1.
3.6 Eigenanatomy Decomposition Traditional univariate approaches like voxel-based morphometry (VBM) fit a statistical model for every voxel in a brain image. Because of the large number of voxels in a typical imaging protocol, this approach necessitates correction for a very large number of comparisons (T1-volumes in the current study contained over 1 million voxels), resulting in a dramatic loss of statistical power. However, effects are typically spread over areas that are larger than 1 voxel. Multivariate approaches are better suited to reduce the dimensionality of the data to the information contained in the data itself before statistical comparisons are applied. Eigenanatomy Decomposition is a novel method for data-driven dimensionality reduction of neuroimaging data that adds sparseness and smoothness constraints for better anatomical interpretability in comparison to standard spatial principal component analysis (Kandel, Wang, Gee, & Avants, 2015). Cortical thickness masks and FA images were processed using the ANTsR v0.3.2 implementation of the Eigenanatomy Decomposition algorithm (Kandel et al., 2015). Parameters for Eigenanatomy Decomposition were adopted from published work, i.e. decomposition into 32 components with sparseness of 1/32 with 20 iterations, a L1 penalty with gradient step size 0.5, a smoothing kernel of 1 voxel, and a minimum cluster size of 1000 voxels for each eigenvector. For statistical analysis, the mean value of each brain morphology measure (FA, cortical thickness) within each eigenanatomy component was calculated. See Figure 2 for an illustration of the resulting parcellation.
10
bioRxiv preprint first posted online Aug. 15, 2016; doi: http://dx.doi.org/10.1101/069617. The copyright holder for this preprint (which was not peer-reviewed) is the author/funder. It is made available under a CC-BY 4.0 International license.
Figure 2: Overview of the Eigenanatomy decomposition for FA images (top) and cortical thickness maps (bottom). The 32 components indicated by eigenatomy decompositon are shown on top of the study-specific FA and cortical thickness template. Cortical thickness images were downsampled and smoothed. Labels indicate the components that were found to show interactions with working memory scores and age.
3.7 Statistical analysis We wanted to test how brain morphology was associated with the components of the working memory system, and the extent to which this relationship was moderated by age. The relationship between these factors was therefore tested in the following set of regression models: a) age predicting working memory performance, b) age predicting brain morphology measures, c) brain morphology predicting working memory; and ultimately d) the interaction between brain morphology and age predicting working memory (see Figure 3 for an overview of these models). Gender and an intercept term were included as additional regressors in each model. Assessment of Cook’s distance (Cook, 1977) indicated no particularly influential data points in the regression models. Therefore, all available data points were retained in the analysis. Regression analysis was carried out using the ’stats’ package v3.1.2 in Rbase.
11
bioRxiv preprint first posted online Aug. 15, 2016; doi: http://dx.doi.org/10.1101/069617. The copyright holder for this preprint (which was not peer-reviewed) is the author/funder. It is made available under a CC-BY 4.0 International license.
Figure 3: Relationships between age, brain morphology, and working memory factors explored in the current analysis. The relationship between age and working memory factors (Verbal, Executive, Spatial), age and brain morphology measures (FA, cortical thickness), and the interaction effect between age and brain morphology on working memory factors was investigated. All models further contained gender as a regressor of no interest as well as an intercept term and error term. The interaction model also contain terms for age and brain morphology separately. Models for cortical thickness analysis also contained intracranial volume as a regressor of no interest.
12
bioRxiv preprint first posted online Aug. 15, 2016; doi: http://dx.doi.org/10.1101/069617. The copyright holder for this preprint (which was not peer-reviewed) is the author/funder. It is made available under a CC-BY 4.0 International license.
4 Results 4.1 Factor analysis of behavioural data Principal component analysis (PCA) was applied to the raw scores of the working memory battery to derive the latent variable structure thought to underly working memory (A. D. Baddeley & Hitch, 1974). Assessment of Mahalanobis distance did not indicate outliers in the cognitive scores (Maximum distance D2(4)=15.542, critical value=18.47). Correlations between raw scores were moderate to high (range: 0.39 to 0.63). A 3-factor PCA solution with varimax rotation was selected that corresponded best with theoretical models (T. P. Alloway et al., 2004, Gathercole et al., 2004, Hornung et al., 2011, A. Baddeley, 2003, 2012, Gathercole et al., 2004). This solution explained 92% of the variance in the raw scores. The factor structure suggest a verbal, a spatial, and an executive factor. Factor loadings are shown in Table Error! Reference source not found..
Verbal Factor
Executive Factor
Visuo-spatial Factor
Digit Recall Backward Digit Recall Dot Matrix Mr. X
0.95 0.55 0.22 0.17
0.15 0.50 0.27 0.94
0.18 0.47 0.93 0.26
Proportion explained Cumulative proportion
0.35 0.35
0.33 0.68
0.32 1.00
Table 1: Loading of factors based on principal component analysis using varimax rotations of the raw working memory scores. The three factor solution explained 93% of the variance. The factor loadings suggested a verbal and spatial storage factor, and an executive factor.
4.2 Working memory performance improves with age Linear regression indicated that age was significantly associated with increases in working memory scores (Effects of age including gender as nuisance regressor: Verbal factor: F(2,150) = 4.538, p = 0.012, R2 = 0.057, R2Adjusted = 0.044, βAge = 0.010, tAge(150) = 2.99, p = 0.003; Executive factor: F(2,150) = 6.506, p = 0.002, R2 = 0.079, R2Adjusted = 0.068, βAge = 0.003, tAge(150) =
13
bioRxiv preprint first posted online Aug. 15, 2016; doi: http://dx.doi.org/10.1101/069617. The copyright holder for this preprint (which was not peer-reviewed) is the author/funder. It is made available under a CC-BY 4.0 International license.
3.09, p = 0.002; Spatial factor: F(2,150) = 16, p