BlOTROPlCA 35(4): 450-461
2003
Changes in Forest Structure and Species Composition during Secondary Forest Succession in the Bolivian Amazon’ Marielos Peiia-Claros2 Programa de Manejo de Bosques de la Amazonia Boliviana (PROMAB), P.O. Box 107, Riberalta, Bolivia and Department of Plant Ecology, Utrecht University, P.O. Box 80084, 3508 TB, Utrecht, the Netherlands
ABSTRACT Changes in forest structure and species diversity throughout secondary succession were studied using a chronosequence at two sites in the Bolivian Amazon. Secondary forests ranging in age from 2 to 40 years as well as mature forests were included, making a total of 14 stands. Fifty plants per forest layer (understory, subcanopy, and canopy) were
sampled using the transect of variable area technique. Mean and maximum height, total stem density, basal area, and species number were calculated at the stand level. Species diversity was calculated for each stand and for each combination of forest layer and stand. A correspondence analysis was performed, and the relationship between relative abundance of the species and stand age was modeled using a set of hierarchical models. Canopy height and basal area increased with stand age, indicating that secondary forests rapidly attain a forest structure similar in many respects to mature forests. A total of 250 species were recorded of which ca 50 percent made up 87 percent of the sampled individuals. Species diversity increased with stand age and varied among the forest layers, with the lowest diversity in the canopy. The results of the correspondence analysis indicated that species composition varies with stand age, forest layer, and site. The species composition of mature forests recovered at different rates in the different forest layers, being the slowest in the canopy layer. Species showed different patterns of abundance in relation to stand age, supporting the current model of succession.
RESUMEN Se estudio, usando una cronosecuencia, 10s cambios en la estructura del bosque y en la diversidad de especies durante la sucesibn secundaria en dos sitios de la Amazonia boliviana. Se incluyeron bosques secundarios con un rango de edad de 2 a 40 ahos, asi como bosques maduros, para un total de 14 rodales. Se inventariaron 50 plantas por estrato del bosque (sotobosque, subdosel, y dosel), usando transectos con hea variable. Se calculb a nivel de rodal la altura mixima y minima, la densidad total, el hea basal y el nlimero de especies. La diversidad de especies h e calculada para cada rodal y para cada combinacibn de estrato del bosque y rodal. Se realizb un andisis de correspondencia, y se model6 la relacibn entre la abundancia relativa de las especies y la edad del rodal, usando un grupo de modelos jerirquicos. La altura del dosel y el area basal aumentan con la edad del rodal, indicando que 10s bosques secundarios recuperan ripidamente la estructura de un bosque maduro. Se encontrb un total de 250 especies, de las cuales aproximadamente el 50 porciento representaron al 87 porciento de 10s individuos muestreados. La diversidad de especies aumentb con la edad del rodal y varib con el estrato del bosque, con la diversidad m h baja en el dosel. L o s resultados del andisis de correspondencia indican que la composicibn de especies varia siendo la edad del rodal, el estrato del bosque, y el sitio. La composicibn de especies del bosque maduro se recupera con diferente rapidez en 10s diferentes estratos del bosque, siendo la recuperacibn m L lenta en el dosel. La relacibn entre la abundancia relativa de las especies y la edad del rodal varia entre las especies, lo que respalda el modelo de sucesibn actual.
Key word:
Bolivia; regeneration; succession; successional position; tropical rain forest.
MANY TROPICAL FORESTS HAVE BEEN CLEARED, cultivated for one to three years, and later abandoned. These areas are rapidly recolonized by plants through secondary succession (Finegan 1984), so that a secondary forest develops in the area afier some years. Secondary forests that differ in age genReceived 4 June 2001; revision accepted 27 September 2003. Current address: IBIF, Casilla 3632, Sanra Cruz, Bolivia; e-mail:
[email protected]
erally vary in species composition. The variation in species composition has been related to changes in environmental conditions as succession proceeds (e.g., a decrease in light availability at the forest floor; Saldarriaga 1994) and to differences among species in terms of their establishment requirements and other life history characteristics (Finegan 1984, 1997; Bazzaz 1991). The first 100 years of Neotropical secondary forest succession have been described in terms of three phases, each of them characterized by a dif-
450
Species Composition and Structure of Secondary Forests
ferent set of species (Budowski 1965; Gomez-Pornpa & V6zquez-Yanes 1981; Finegan 1996, 1997). The first phase of succession is short and is dominated by herbs, shrubs, and climbers that establish soon after disturbance and disappear under the shade of the emerging pioneer tree species. The second phase of succession is dominated by pioneer tree species. These species rapidly develop a closed canopy and dominate the second phase for 10 to 30 years, depending on their life spans. As they die off, they are replaced by long-lived pioneer tree species. These species are hypothesized to have a wider range of requirements for establishment than pioneers, with some species establishing only in young successional stages (Guariguata 2000) and others establishing in later stages as well (Peiia-Claros 2001). Long-lived pioneer tree species dominate the third phase of succession, which may last for 75 to 100 years, depending on the life span of the species. Shade tolerant species are thought to colonize the site continuously during the last two phases of succession (Finegan 1996, 1997). Although it is fairly well known that different groups of species dominate the forest canopy during different phases of succession, data are lacking regarding when these species actually colonize. To understand successional pathways and to predict hture changes in canopy composition, one could analyze the species composition of different forest structural layers. Three layers are typically recognized in old secondary forests: canopy, subcanopy, and understory. The species composition of the understory layer includes the species pool from which tree species are recruited to the canopy layer. Therefore, understory species composition may be a good predictor of the future canopy species composition (Oldeman 1990; c$ Swaine & Hall 1988). Description of species composition patterns during succession are commonly based on changes observed in the canopy layer of secondary forests (Finegan 1996, Richards 1996). Canopies of secondary forests that are 5 to 18 years old are dominated by a small number of pioneer species, and therefore, low diversity values are found. As these pioneer tree species begin to die off, an increase in species diversity is expected because other tree species reach the canopy. In the understory layer, a low dominance of species and a high species diversity are expected because recruitment of nonpioneers commences during early successional stages (Uhl et al. 1981, Swaine & Hall 1983, Purata e t al. 1986, Uhl 1987). For example, diversity among saplings was found to be higher than that of canopy trees in secondary forests of Costa Rica
451
(16-18 years old; Guariguata et al. 1997) and French Guyana (19 years old; Toriola et al. 1998). There are, however, few data available regarding how species composition and species diversity change in different forest layers over the course of succession. In this study, I evaluated the patterns of succession in two distant sites of northern Bolivia by sampling the vegetation of secondary forests differing in age to test the successional model proposed by Gomez-Pompa and Vasquez-Yanes (198 1) and Finegan (1984). The objectives of the study were to: (1) describe changes in forest structure and species diversity in secondary forests over time; (2) evaluate the species composition and the species diversity of different forest layers and of secondary forests differing in age; and (3) determine their patterns of abundance through the course of succession.
MATERIALS AND METHODS The study was carried out at two sites in the Bolivian Amazon. The first site was El Tigre Forest Reserve and the neighboring community area of Campo Central (1 1"59'S, 65"43'W), hereafter referred to as Reserve El Tigre. This site was located ca 45 km east of the town of Riberalta and receives an annual rainfall of 1780 mm, with a dry season from May to September (Beekma etal. 1996). The second site was the community area El Turi (11"45'S, 67'20'W) located at the border of the river Manupare, ca 150 km southwest of Riberalta. There are no climatological data for this area but I believe the climate to be similar to Reserve El Tigre (Cobija located 300 km northwest of Riberalta has an annual rainfall of 1833 mm; Beekma et al. 1996). The vegetation of both sites consisted mainly of lowland tropical moist forest, with few patches of secondary forests differing in successional stage and agricultural fields (ca 97% of the Bolivian Amazon was forested in 1990; Beekma et al. 1996). The distance of all stands to mature forest was similar, given that all stands were bordered by mature forest on at least one of their sides. Secondary forests of different ages were selected at each site to obtain chronosequences. Each chronosequence included young secondary regrowth (2 yr afier abandonment) to old secondary forests (ca 40 yr afier abandonment; Table 1). Estimates of the ages for the secondary forests were obtained from long-term residents of the two communities. During the interviews, dates provided by the informants were checked with known historical events. In total,
Peiia-Claros
452
TABLE 1. Sampled area and total number ofplants sampledfor each of the transects in secondary forests differing in age and mature forests (MF) at t w o sites in northern Bolivia. See text for definition of size classes. Age is given in years since the start of the fallow period
Site
El Turi
Age (yr)
Understory
Subcanopy
Canopy
108 176 78 123 112 200 117
350 700 1260 1370 750 645 1082
3a
47 106 80 136 107 119 140 76
5
98
193 210 153 185 121 82
2 4 14 25 28 40
MF Reserve El Tigre
Area sampled (m')
8b
10 11 25
MF
143 22 1 59 93
80
559 1594 610 730 1160 510
Number plants 140 145 150 150 136 137 149 100 134 100 140 150 150 146
Only two categories were included in this inventory (understory: 2 1 m height-1 cm DBH; subcanopy: 2 1 cm DBH). The subcanopy category was later divided into two (1-5 cm and >5 cm DBH). The understory layer was not included in this inventory.
a
12 secondary forests (6 per site) and 2 stands of were represented along the entire transect, the tranmature forests (without signs of recent human dis- sect was divided into sections of 10 trees each (R. turbance) were included in the study. All secondary Foster, pers. comm.). The first 10 trees were idenforest stands were reportedly used for agriculture tified by a local guide and measured for diameter only once for two to three years, and their mean and height. Species that could not be identified in size was 2.2 ha (range = 1-7 ha). the field were given morphospecies names, and In the center of each stand, a transect of vari- samples were collected for later identification. The able area was established that started ca 10-20 m distance along the transect from the tenth tree to from the stand edge. The transect of variable area the starting point was measured to calculate the is a technique specifically developed for rapid as- area covered by that transect section, and the tenth sessment of the species composition of plant com- tree was marked. From the marked tree onwards, munities (R. Foster, pers. comm.). The basis of this I searched for the next 10 individuals and repeated method is to sample a fixed number of individuals this procedure until 50 individuals had been saminstead of a fixed area. In this study, we sampled a pled. While walking back to the beginning of the total of 150 individuals in each stand divided into transect, I sampled the smaller two size classes. In three size categories: saplings (from 1 m height to each transect section, only 10 saplings and 10 small 1 cm diameter at breast height [DBH]), small trees trees were sampled within 1 and 2.5 m at each side (1-5 cm DBH in stands 5 cm sect width of 2 and 5 m). The lengths of the tranDBH for stands 10 cm DBH in sect sections needed to sample the 10 individuals the stands 2 5 years old). The size limit between from each size category were carehlly measured. In the small tree and tree categories varies among the case of saplings, the transect sections were not stands because trees 10 cm DBH or greater are very always large enough to include 10 individuals. uncommon in secondary forests less than five years Therefore, the sample size for this size class was old. not necessarily equal to 50 individuals. The total The length of the transect of variable area is area sampled per stand and per size category, and determined by the size category with the lowest the total number of individuals sampled are redensity (R. Foster, pers. comm.). In this study, I ported in Table 1. Hereafter, the sapling, small tree, searched first for trees within a distance of 5 m at and tree size categories are referred to as understory, each side of the central transect line ( k ,transect subcanopy, and canopy layers. width of 10 m). To assure that all size categories Voucher samples were identified using various
Species Composition and Structure of Secondary Forests
453
TABLE 2. Modeh used to describe the four successional patterns distinguished when species relative abundance was related to stand age (based on rnodelr developed by Huisrnan et al. 1993). x = stand age; y = relative abundance; M = maximum value (of abundance) that can be attained (M = 90 in this study); a, 6, c, d = parameters to be estimated. ~~
Model
I I1
IIA IIB IV
Pattern Constant
Increase Decrease Optimum
Description
Formula
No significant trend over time Trend in which the maximum is equal to the upper bound (M) Trend in which the maximum is below the upper bound (M) Whenb 0 Unimodal response curve d = -b, symmetric curve opposite signs for b and d, asymmetric curve
guides (Sleumer 1987, Gentry 1993, Killeen et al. 1993, Anonymous 1997, Foster & Wachter 1997, Reynel & Pennington 1997, Vasquez 1997) and by comparing samples with identified material at the Herbario Nacional (La Paz, Bolivia) and at the Field Museum of Natural History (Chicago, Illinois). Identified vouchers have been deposited at the herbarium of the Universidad Ttcnica del Beni. Samples that could not be identified were given morphospecies names. hALYsIs.-The following stand characteristicswere calculated: density (number of individuals >1 m heighdha), basal area (including all individuals 2 1 cm DBH, in m2/ha), total number of species, and the Shannon diversity index (H’ = -Zp; (In pi), where pi is the proportion of individuals found in the i* species). The Shannon diversity index was calculated for all individuals sampled in a given stand and for each combination of forest layer and stand age. The effect of site on all these characteristics was tested using ANCOVA (with stand age as the covariable). There were no significant effects of site or of the interaction term for site and age. Consequently, all stand characteristics were regressed to stand age using a quadratic regression. For the purpose of the analysis, the mature forest age was fixed at 150 years. When the age of the mature forest was considered to be 100, 200, or 300 years old, no significant differences were found for any variable. To evaluate the influence of stand age on the species composition of secondary forests, I performed a correspondence analysis using the CANOCO software (ter Bra& & Smilauer 1998). The 92 species with 5 or more sampled individuals were included in the analysis. The abundance of each species was calculated for each combination
+ ea))
y y
= =
M*(I/(I M*(l/(l
y
=
M*(l/(l
+ ea+bx)) + ea+bx))*(l/(l+ ec))
y
=
M*(l/(l
+ eaAbX))*(1/(1+ e c + h ) )
of site (2; Reserve El Tigre and El Turi), stand age (14), and structural layers (3; understory, subcanopy, and canopy), providing a total of 84 samples. The species abundance data were square root transformed prior to analysis. The first two axes of the correspondence analysis were correlated with site, stand age, and structural layer. Additionally, the species score of axis 1 was used to calculate the successional position of the species. Successional position ranged from 0 for the earliest successional species to 100 percent for the latest successional species. To describe the relationship between the relative abundance of species and stand age, I used the hierarchical set of five models developed by Huisman et al. 1993 (Table 2). These models were grouped according to four distinguishable successional patterns: a constant, an increase, a decrease, or an optimum in abundance during succession. The relative abundance of species was calculated by stand age, pooling all structural layers. All five response curve models were fitted to data from each species. The simplest model that explained the observed pattern was chosen. A more complex model was selected only if it explained a significantly higher amount of variation than a simpler model (Huisman et al. 1993). Only those 53 species that had 10 or more individuals in total were included in the analysis. When 70 percent or more of the individuals of a given species was found only in one of the two sites (ie., Reserve El Tigre and El Turi), the analysis was done including only the seven stands of that particular site. Species abundance data were arcsine transformed to increase homoscedasticity (Huisman et al. 1993). The age of the mature forest was fixed as being 150 years. No significant differences between I? and type of mod-
Peiia-Claros
454
25
' 7
a
. .
0
5
0 0
10
20
b
0
30
L
R'
*
= 0.49
50 140150
40
J 16
R' = 0.78 ***
0 h
E
.
40 -
Y
$ 30-3 2 0 -
0 0
a
.. 0.
0
1
F
g 12-
* d
-
.
0 0
+" lo 2 8-
0
W
g
R' =0.70' J
0
? , .
.-b
l0.*OO
/+
r
14 -
6-
0 0 0
. .
42 -
/+ R' = 0.07 n:
0
e
0.
0
0. 00
lo
I
'R
= 0.71
**
.
R'
= 0.82 **'
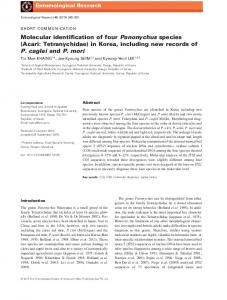
FIGURE 1. Structural characteristics and species diversity of secondary and mature forests in northern Bolivia. (A) mean height of canopy trees (>5 cm DBH in stands lO cm DBH in stands 2 5 yr); (B) maximum height of canopy; (C) basal area of all individuals with 2 1 cm DBH; (D) density of all individuals 2 1 m height; (E) total number of species; and (F) Shannon diversity index. Open circles are data from the Reserve El Tigre and filled circles are data from El Turi. R of quadratic regressions is given. * = P 5 0.05, ** = P 5 0.01, *** P 5 0.001.
el selected were found when the mature forest was considered to be 100 or 200 years old. The four successional patterns distinguished by the models were related to the successional position of the species using a one-way ANOVA. Two species were excluded from the analysis: Cedrekz odorata (which had an exceptionally high abundance in one transect due the presence of a seed tree) and Geissospermum serireum (which resprouts profusely in young secondary forests).
RESULTS FORESTsTRucTuRE.-Mean and maximum height of the canopy layer increased with stand age (Fig. la, b). The same was found for total basal area (Fig. lc), which increased from 12.3 m2/ha in the 2-year-old regrowth to 36.3 m2/ha in the 40-yearold secondary forest. Neither total stem density (Fig. Id) nor stem density in the different forest layers was correlated with stand age.
Species Composition and Structure of Secondary Forests
I
B
*:
0
0
** 0
10
20
30
40
140
150
Stand age (y)
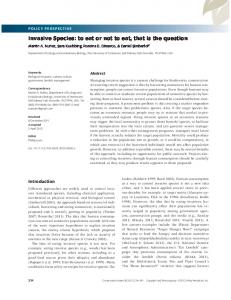
FIGURE 2. Species diversity (based on the Shannon diversity index) for each combination of forest layer and stand age. Stand age is in years since the beginning of the fallow. Diamonds represent data from the Reserve El Tigre and circles are data from El Turi. Open symbols are used for the understory layer, gray symbols for the subcanopy layer, and filled symbols for the canopy layer.
SPECIES DrvERsrn.-Totd species number and the Shannon diversity index increased with stand age (Fig. le, f). In the 2-year-old regrowth, there were 23 species in total, whereas there were 59 in the 40-year-old secondary forest. The relation between the Shannon diversity index and stand age varied among forest layers but not between sites (Fig. 2). Diversity in the understory was not related to stand age (quadratic regression, R2 = 0.30, P = 0.171, N = 1 l), while for the subcanopy and canopy it was related (quadratic regression, subcanopy: R2 = 0.53, P = 0.016, N = 11; canopy: R2 = 0.59, P = 0.008, N = 11). The Shannon diversity index in the canopy layer varied more among stands than in the two other layers (Fig. 2). Diversity was lowest in secondary forests of 8 to 14 years (Fig. 2) due to high densities of Cecropia sciadophylla, Orbroma pyramidale, andlor Styphnodendron purpureum. These species made up to 94 percent of the individuals greater than 10 cm DBH in given stands. SPECIES COMPOSITION.-Taking into account both sites, 250 species were recorded. More than half of the species were represented by 5 individuals or less. The 92 species included in the correspondence analysis represented 86.5 percent of the sampled individuals. Some abundant species ( 2 3 0 individuals in total) were present in high numbers at both sites ( e g , C. sciadophylla, Rinoreocarpus ulei, and Bellucia pentamera), while others were present only at one of the sites (Senna sylvestris and Geonoma
455
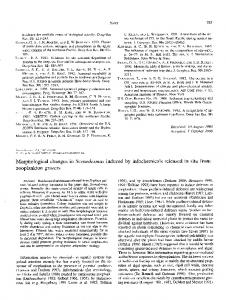
deversa only in El Turi; Sclerolobium sp. 1 only in Reserve El Tigre). Species such as 0. pyramidale, Piper sp. 5, Geissospermum sericeum, and Jacaranda copaia were present at both sites but their abundances differed strongly between sites. The variation explained by the first two axes of the correspondence analysis was only 18.1 percent (axis 1 = 10.7%). The first axis was correlated with stand age ( r = - 0.66) and with the canopy layer ( r = 0.55; Fig. 3), which indicated that the main variable explaining differences in species composition was stand age. All canopy samples of secondary forests had positive values along the first axis, indicating that the species composition of canopy trees in secondary forests differs from mature forests. In the case of the secondary forests, canopies were dominated by early successional species. In contrast, species composition in the understory and subcanopy layers resembled those of mature forests. The second axis was correlated with site ( r = 0.81), indicating that the two sites differed in species composition (Fig. 3). The first axis scores of the samples declined with stand age (Fig. 4), indicating that species cornposition varies during succession. The slope of the axis score against stand age was almost significantly different among the three layers (ANCOVA, for interaction between layer and In-stand age: F2,35 = 2.78, P = 0.075). The changes in species cornposition of the canopy layer through time were more pronounced than the changes in species cornposition of the understory, with the subcanopy layer being intermediate. Site did not affect the rate of change in species composition through time; consequently, this factor was not included in the ANCOVA.
SPECIES ABUNDANCE.-The abundances for 18 of the 51 species included in the analysis were not related to stand age (successional pattern “constant” in Table 3 and Fig. 5). The abundances of 5 species decreased with stand age (e.g., Cecropia jcijilia, Schizolobium amazonicum, and Senna sylvestrii). The abundances of 16 species increased with stand age (e.g., Brosimum alicmtrum, Euterpe precatoria, Pseudolmedia Levis, and Ityanthera juruensis). Finally, the abundances of 14 species showed an optimum in abundance relative to stand age (e.g., Alchornea triplinervia, C. sciadophylla, J. copaia and Miconia nervosa). The successional position of species varied with successional pattern (ANOVA, F3, 47 = 25.98, P < 0.001). Species showinga decrease and species showing an optimum in abundance during succession had low values for successional
456
PeAa-Claros
i’ I
,
2A2
-. 2C4
2 82 284 0
2c2
2A4
2A40
.5
Axis 1
i2.
FIGURE 3. Ordination of the different forest layers sampled in secondary forests of differing ages and in mature forests of northern Bolivia. Sample codes: first number refers to site (1 = Reserve El Tigre, 2 = El Turi); letter refers to layer (A = understory, B = subcanopy, C = canopy); and the last number refers to stand age. ET = El Turi, RET = Reserve El Tigre. Filled circles = understory, open circles = subcanopy, triangles = canopy.
position (on average, 16% for “decrease” and 33% for “optimum”). Species showing a constant abundance during succession had intermediate values for successional position (56%), while species showing an increase in abundance had the highest values for successional position (82%).
DISCUSSION FORFSTsTRucTvRE.-Forest
height (mean and maximum) and basal area increased with stand age (Fig. la-c). Secondary forests ca 25 years old attained 70 percent of the mean height and basal area of mature forests. This rapid structural convergence with mature forest has been found in other chronosequences (Saldarriaga et al. 1988, Gomide et a[. 1998, Tucker et a[. 1998, Denslow & Guzman 2000). Neverthe-
less, there are other factors besides time since disturbance that affect the rate of forest recovery (Uhl et al. 1988, Brown & Lug0 1990, Guevara et al. 1992, Moran et al. 2000, Steininger 2000). SPECIES DrvERsrn.-Species number and the Shannon diversity index increased with stand age and became stable after 20 to 25 years (Fig. le). The lower species diversity found in younger successional stages was related to the high dominance of a few pioneer tree species (e.g., C. sciadopby& Dictyoloma peruviana, 0.pyramidale, Piper sp. 5 , Senna dvestris, Schizolobium amazonirum, Sqphnodendron p u p reum, and E m a micrantha), which is a common feature of secondary forests in general (see Richards 1996 for summary). The abundances of these species decreases with stand age, which results in an
Species Composition and Structure of Secondary Forests 2
1
.
-
4e
8
0
I
.Q
0
2 0
10
20
30
40
, , 140
150
Stand age (yr) ~
~~~
FIGURE 4.
Relationship between stand age and score on first ordination axis of Figure 2, which mainly represents variation in species composition due to stand age. Diamonds indicate data from the Reserve El Tigre and circles are data from El Turi. Open symbols are used for the understory layer, gray symbols for the subcanopy layer, and filled symbols for the canopy layer.
increase in species diversity with time (Saldarriagaet al. 1988). Species diversity was higher in the understory and subcanopy layers than in the canopy layers (Fig. 2). Similar results were found in East Kalimantan: species number was higher in the seedling (1.5 m height, 2 cm DBH) categories than in the tree ( 2 1 0 cm DBH) and pole (2-10 cm DBH) categories. The species number in the tree and pole categories increased throughout succession (Okimori & Matius 2000). The lower variation in species diversity I observed for the understory and subcanopy layers is in accordance with the current model of tropical succession (Gomez-Pompa & Vizquez-Yanes 1981, Finegan 1996). This model states that species with a variety of light requirements are recruited early in succession (