CHANGES IN MAGNETIC PARAMETERS AFTER SEQUENTIAL IRON PHASE EXTRACTION OF EASTERN MEDITERRANEAN SAPROPEL S1 SEDIMENTS J.F.L. GARMING1*, G.J. DE LANGE1, M.J. DEKKERS2, H.F. PASSIER2# 1 * 2 #
Department of Earth Sciences, Utrecht University, P.O. Box 80021, 3508 TA Utrecht, The Netherlands Current address: Universität Bremen, Fachbereich 5 - Geowissenschaften, Postfach 330440, D-28334 Bremen, Germany (
[email protected]) Paleomagnetic Laboratory ‘Fort Hoofddijk’, Department of Earth Sciences, Utrecht University, Budapestlaan 17, 3584 CD Utrecht, The Netherlands Current address: TNO-NITG, Netherlands Institute of Applied Geoscience, TNO-National Geologic Survey, P.O. Box 80015, 3508 TA Utrecht, The Netherlands
Received: November 25, 2002; Revised: September 25, 2003; Accepted: October 21, 2003
ABSTRACT Iron is distributed over different minerals (i.e. silicates, pyrite, detrital oxides) that are present in a sediment sequence that formed under anoxic conditions. After postdepositional re-oxidation of the sediments pyrite is no longer present and diagenetic iron phases constitute an important portion of the iron in the oxidised part of the sapropel. They are very fine-grained making them amenable to analysis by means of sequential extraction and mineral-magnetic methods. The sequential extraction shows that besides iron in silicates, iron mainly occurs in ‘amorphous’ oxides in the oxidised part of the S1 sapropel. Pyrite constitutes an important fraction in the still reduced part of the S1 sapropel. Some silicon is dissolved during the extraction for the ‘amorphous’ oxides, suggesting that ‘amorphous’ iron also occurs as ferro-silicate coatings. Mineral-magnetic analysis involved component analysis of the isothermal remanent magnetisation (IRM) and hysteresis loop measurements. Three coercivity phases could be identified in the IRM component analysis; these were interpreted as ‘detrital’ magnetite, hematite, and biogenic magnetite. The diagenetically formed iron phases influence the parameters of the IRM components. Hysteresis measurements together with the IRM component analysis, indicate the importance of bacterial magnetite in the oxidised sapropel, particularly in the lower part of the active oxidation zone. K e y w o r d s : biogenic magnetite, diagenesis, environmental magnetism, magnetic parameters, Mediterranean Sea, sapropel, sequential extraction
1. INTRODUCTION The sediments of the Mediterranean consist of alternating organic-rich and organicpoor sediments. The organic-rich intervals, named sapropels, with formally more than 2% Stud. Geophys. Geod., 48 (2004), 345−362 © 2004 StudiaGeo s.r.o., Prague
345
J.F.L. Garming et al.
of organic matter (Sigl et al., 1978; Kidd et al., 1978), were deposited under anoxic sedimentary conditions. Times of sapropel formation can be correlated to minima in the precession index (Rossignol-Strick, 1983, 1985; Thunell et al., 1984; Hilgen, 1991). Increased seasonal contrasts and a changed monsoon regime altered the overall water budget of the Mediterranean (Rohling and Hilgen, 1991; Béthoux and Pierre, 1999). Enhanced input of fresh water caused a decrease in bottom water circulation resulting in a depletion of oxygen in the deeper basins of the Mediterranean (Olausson, 1961; Cita et al., 1977; Vegnaud-Grazzini et al., 1977; Nolet and Corliss, 1990). Passier (1998) and Passier et al. (1999) concluded that the almost entire water column may have been sulphidic during deposition of some sapropels. Primary production is enhanced by the increased addition of terrigenic nutrients, consequently an increased amount of organic matter is raining down to the sediments. Anoxic bottom water conditions can contribute to the increased preservation of the organic matter. Sapropels are thus thought to be the consequence of increased production and increased preservation. In hemipelagic sediments ‘detrital’ magnetite grains are subject to reductive dissolution and pyritisation during suboxic and anoxic diagenesis of organic matter (e.g. Canfield and Berner, 1987). During anoxic diagenesis, the fine (super-paramagnetic and single-domain) magnetite grains would be totally dissolved, while the coarser (pseudosingle-domain and multi-domain) grains may develop pyrite overgrowths, thus protecting their inner parts from further dissolution (Canfield and Berner, 1987). Upon re-establishment of oxygenated bottom water conditions and cessation of sapropel deposition, oxidants diffuse from the water column into the sediment. The secondary oxidative diagenesis causes cations to migrate, following an Eh/pH gradient (Colley et al., 1984; Thomson et al., 1998). This may lead to precipitation (mineral authigenesis or bio-authigenesis) of secondary oxides or oxyhydroxides in the oxidised zone of the sediment (Pruysers et al., 1993). Such secondary, authigenic phases of iron (and some manganese) compounds are magnetic (e.g. Karlin et al., 1987), and thus will lead to the acquisition by the sediment of a secondary, chemical remanent magnetisation (CRM), and potentially, a characteristic rock-magnetic signature of early diagenesis (Robinson et al., 2000; Passier et al., 2001; Passier and Dekkers, 2002; Larrasoaña et al., 2003). Magnetotactic bacteria constitute a special carrier of remanent magnetisation. They utilise magnetosomes (crystalline magnetite) to control their locomotion in the chemically stratified pore space of unconsolidated sedimentary deposits, just below the oxidation front (Bleil, 2000). Biogeochemical processes at redox boundaries affect remanent magnetisations. They may cause significant smoothing of paleomagnetic records (e.g. Tarduno et al., 1998). Here, we discuss how diagenesis of iron phases influences magnetic hysteresis parameters and magnetic coercivity components. To this end, we incorporate the results of a recently evaluated nine-step sequential extraction procedure (Rutten and De Lange 2002a,b) into the recently developed IRM component analysis (Kruiver et al., 2001; Heslop et al., 2002). The merits of these two techniques may be enhanced by their combination because dissolution puts constraints on the mineral-magnetic analysis, while the sensitive magnetic techniques simultaneously allow validation of the sequential extraction.
346
Stud. Geophys. Geod., 48 (2004)
Magnetic Parameters after Sequential Iron Phase Extraction of Sapropel
2. MATERIAL AND METHODS Boxcore PSO36BC was recovered by the R/V Pelagia in May 2000 at 36°15.85’N; 21°48.38’E, in a water depth of 3286 meters. The 41 cm long boxcore contains the partially oxidised sapropel S1, as found in large parts of the eastern Mediterranean (Fig. 1). In the overlying mud, a tephra layer occurs, tentatively interpreted as being originating from the Minoan eruption of Santorini, 3.6 ka BP (de Rijk et al., 1999). At a sediment depth of 26 cm (cmsbd) the sapropel starts, indicated by the darker sediments of the markerbed (van Santvoort et al., 1996), continuing until the bottom of the boxcore. The upper part of the sapropel has been altered by oxic diagenesis. This oxidised part can be divided in two segments, the upper part being the oxidised sapropel and the lower part the active oxidation zone, starting at a depth of 30 cmsbd. Below the active oxidation zone the sapropel is still unchanged. In the present boxcore, sapropel S1 is interrupted near the bottom of the core by a thin zone (3 cm thickness) of muddy sediment. The position
Fig. 1. (a) Down-core manganese concentration in sediment in g/kg (filled diamonds). (b) Downcore iron concentration in sediment in g/kg (filled squares). The solid lines represent the down-core concentrations calculated on a carbonate free basis. Dashed horizontal lines indicate the approximate boundaries of different geochemical zones in the core. The concentration of the elements on a carbonate free basis is calculated by assuming that the amount of calcium extracted in the different steps of the sequential extraction is solely related to carbonates. Stud. Geophys. Geod., 48 (2004)
347
J.F.L. Garming et al.
concurs with the interruption in S1, that was shown to be a distinct cooling event around 7 ka BP by de Rijk et al. (1999). Six subcores were taken from the boxcore. The sediments from the subcores, #2, #4, #5 and #6 were subsampled, whereby the core was divided into 32 intervals according to the colour of the sediment. An overview of the sampled intervals is given in Table 1. The sample intervals range from a few millimetres in the (oxidised) sapropel to two centimetres in the oxic sediments overlying the sapropel. The samples were freeze-dried and gently ground in an agate mortar. Coinciding intervals were mixed prior to analysis.
Table 1. Sample intervals of core PS036BC with their Munsell colour coding. The cores were opened using a core-cutter and the samples were scooped out in a cool-container at 15°C. Before storage the samples were rinsed three times with nitrogen gas. Sample no. Begin Depth End Depth Average Depth (cm) (cm) (cm) 1 2 3 4 5 6 7 8 9 10 11 12 13 14 15 16 17 18 19 20 21 22 23 24 25 26 27 28 29 30 31 32
348
0 2 4 6 8 9 10 10.8 13 15 17 19 21 23 25 25.5 26 27.5 28 28.5 29 30 30.8 31.2 31.5 32 33 35 35.5 36.8 38.5 40
2 4 6 8 9 10 10.8 13 15 17 19 21 23 25 25.5 26 27.5 28 28.5 29 30 30.8 31.2 31.5 32 33 35 35.5 36.8 38.5 40 41.5
1 3 5 7 8.5 9.5 10.4 11.9 14 16 18 20 22 24 25.25 25.75 26.75 27.75 28.25 28.75 29.5 30.4 31 31.35 31.75 32.5 33.5 34.75 36.15 37.65 39.25 40.75
Munsell colour coding and description 10YR4/4 (Dark yellowish brown) 10YR5/3 (Brown) 10YR5/3 (Brown) 10YR5/3 (Brown) 10YR5/3 + 2 (Brown) 10YR5/3 + 2 (Brown) 10YR5/3 (Brown) 10YR4/3 Tephra 10YR5/4 (Beige) 10YR5/4 (Beige) 10YR5/4 (Beige) 10YR5/4 (Beige) 10YR5/4 (Beige) 10YR5/4 (Beige) 10YR5/4 (Beige) + 10YR5/2 (Grey) 10YR5/2 Markerbed 10YR5/2 Markerbed 10YR6/3 (Pale brown i.e. whitish beige) 10YR6/3 (Pale brown i.e. whitish beige) 10YR5/4 (Beige) 10YR5/5 10YR4/4 (Dark yellowish brown) 10YR5/6 (Yellowish brown i.e. orange) 10YR5/6 (Yellowish brown i.e. orange) 5Y3/1 (Very dark grey) 5Y4/1 (Dark grey) 5Y4/1 (Dark grey) 5Y3/1 (Very dark grey) 5Y3/1 (Very dark grey) 5Y5/1 (Grey) 5Y5/1 (Grey) 5Y3/1 (Very dark grey) Stud. Geophys. Geod., 48 (2004)
Magnetic Parameters after Sequential Iron Phase Extraction of Sapropel
2.1. Geochemical analyses For the analysis of total element contents, 125 mg of all 32 samples were accurately weighed and digested in a mixture of hydrofluoric, nitric and perchloric acids. Final solutions were made in 1M HCl and measured with an Inductively Coupled Plasma Optical Emission Spectrometer (ICP-OES; Perkin Elmer Optima 3000). The quality of the measurements was monitored by the inclusion of blanks, duplicate measurements and inhouse standards (MMIN and MM91). The reproducibility of the duplicate measurements was better than 2% for each element, and the reproducibility of the standards was better than 3% for the major elements. Sedimentary constituents were chemically extracted using the nine-step sequential extraction scheme of Rutten and De Lange (2002a,b; Table 2). It differentiates between coatings and carbonates (dissolving agents: NH4Cl, and acetate), ‘amorphous’ oxides (ascorbate), ‘crystalline’ oxides (dithionite), silicates (HF), pyrite and organically bound minerals (HNO3), and residual minerals (HF/HNO3/HClO4). The carbonates are removed in several steps (at pH 9, 8, 7, and 5). ‘Amorphous’ oxides are dissolved in a step between the carbonate steps of pH 7 and pH 5. ‘Amorphous’ oxides and carbonates dissolve both in 1M Na-Acetate, (Chester and Hughes, 1967), therefore the ‘amorphous’ oxides are removed separately, prior to the last carbonate dissolution step. The distinction between ‘amorphous’ and ‘crystalline’ oxides is based on the solubility of iron and manganese in manganese nodules on the one hand, and that of hematite, goethite, ilmenite, and magnetite on the other (Rutten and De Lange, 2002b). For the sequential extraction approximately 250 mg of sediment from ten different levels in the boxcore were accurately weighed in. This was done six times for each level to facilitate the taking of subsamples for rock-magnetic measurements. The samples were taken in the interval from 26 to 35 cmsbd. The subsamples for mineral-magnetic analysis were taken after the initial removal of the carbonates (steps 1−3), the removal of the ‘amorphous’ oxides (step 4), the removal of the remaining carbonates (step 5) and after the removal of the ‘crystalline’ oxides (step 6) (see Table 2). After performing the extraction of the clay minerals not enough material was left to obtain accurate magnetic data.
Table 2. Sequential extraction scheme used (after Rutten and De Lange, 2002a,b). Step 1 a+b 2 a+b 3 a+b 4 5 6 7 8 9
Solution 2M NH4Cl at pH 9 2M NH4Cl at pH 8 2M NH4Cl at pH 7 Ascorbate solution 1M Acetate solution at pH 5 Dithionite solution at pH 4.6 20% HF Conc. HNO3 Mixture HNO3/HF/HClO4
Stud. Geophys. Geod., 48 (2004)
Mineral(s) aimed at to dissolve Carbonates and coatings Carbonates and coatings Carbonates and coatings ‘Amorphous’ oxides Carbonates ‘Crystalline’ oxides Clay minerals Pyrite and organically bound minerals Residual minerals
349
J.F.L. Garming et al.
2.2. Magnetic measurements For magnetic measurements, the untreated samples and the samples taken after the different extraction steps were dried in a desiccator and lightly ground in an agate mortar before further sample preparation. Magnetic measurements included IRM component analysis (Kruiver et al., 2001; Heslop et al., 2002) and hysteresis loop measurements. For the IRM acquisition measurements, c. 100 mg of sample were accurately weighedin in plastic vials of 8 cm3 and moulded into epoxy raisin (Ciba-Geigi Araldite D/Hardener HY926; mixing ratio 5:1) until a homogeneous dispersion was obtained. Hardening took 24 hours at room temperature, and was done in a low-field environment (< 100 nT). IRM was induced with a PM4 pulse magnetiser, after AF demagnetisation, in 29 steps. IRM intensities were measured with a 2G Enterprises RF SQUID (Super Conducting Quantum Interference Device) magnetometer, model 740R. The noise level of the instrument is ~10−11 Am2, corresponding to 1.25 × 10⁻⁶ Am−1 for a 8 cm3 sample. The IRM acquired data were used to perform what is referred to as IRM component analysis. The program that is used to separate the individual mineral contributions (IRMunmix), was developed by Heslop et al. (2002). The IRM values are plotted against the logarithm of the applied field, this results in a simple sigmoid shaped curve (Fig. 2). This is essentially a cumulative log Gaussian curve (or a combination of such curves) for the coercive force distribution of the constituent magnetic mineral(s) (Robertson and France, 1994; Kruiver et al., 2001). The IRMunmix software automatically fits the IRM acquisition curve with respect to the 10log field using an expectation-maximisation algorithm to effectively separate the IRM acquisition curves of individual components (typically two or three). Before the IRM component analysis was executed, a correction was made for the vial and the epoxy resin. For the hysteresis measurements, c. 10 mg of sample were accurately weighed-in to pieces of drinking straws with a diameter of 3 mm and a length of 3 − 4 mm, glued to a piece of paper on one end. After the straws were filled with sample powder, they were sealed with a drop of glue. The hysteresis measurements were performed on an Alternating Gradient Magnetometer (MicroMag, Princeton) with a so-called ‘P1 phenolic’ probe. The accuracy of the measurements is 2%; the repeatability is 1% standard deviation, if the sample is not removed. The P1 phenolic probe displays a ≤ 2 × 10⁻⁹ Am2 ferromagnetic background superposed on a ≤ −0.13 × 10⁻⁹ m3 diamagnetic background. Corrections are made for the vial and the probe.
3. RESULTS 3.1. Geochemistry The down core variations of the elements manganese and iron are represented in Fig. 1. The manganese concentration (Fig. 1a) displays a distinct peak at the depth of the markerbed, approximately 26 cmsbd. In the oxidised upper part of the sapropel the amount of manganese is slightly elevated compared to the overlying sediments in which 3 g/kg of manganese is present, whereas that of iron (Fig. 1b) shows a pronounced downward increase, culminating in a maximum around 31 cmsbd. Below the transition from oxidised to reduced sediments in the sapropel the iron content of the sediments is
350
Stud. Geophys. Geod., 48 (2004)
Magnetic Parameters after Sequential Iron Phase Extraction of Sapropel
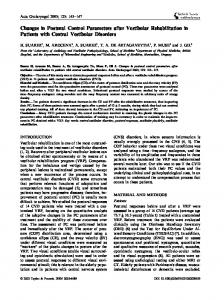
Fig. 2. Upper panel: redrawn example of the input IRM acquisition curve as given by the program IRMunmix2_2 (Heslop et al., 2002) for a sample from the oxidised part of the sapropel. The lower panel: redrawn gradient acquisition plot fitted with three components for the same sample. The total SIRM is 1.85 × 10⁻³ Am2/kg; Comp. 1 (‘detrital’ magnetite), SIRM 1.10 × 10⁻³ Am2/kg, 10logB1/2 is 1.63 (log mT) with a DP of 0.39 (log mT); Comp. 2 (hematite), SIRM 0.10 × 10⁻³ Am2/kg, 10logB1/2 is 2.91 (log mT) with a DP of 0.31 (log mT); Comp. 3 (biogenic magnetite), SIRM 0.65 × 10⁻³ Am2/kg, 10logB1/2 is 1.74 (log mT) with a DP of 0.11 (log mT).
slightly elevated compared to the background values of the overlying sediments (~ 25 g/kg). No significant amount of manganese is present below this transition. These profiles agree with previous findings, e.g. Passier et al. (2001). 3.2. Sequential extraction Approximately 80% of the carbonates was removed during the first three steps of the sequential extraction, assuming that all the calcium extracted is related to carbonates. Manganese associated with carbonates was largely extracted in the first step (pH = 9, Table 2; Fig. 3a); almost no iron was extracted at this pH. During steps two and three some iron was extracted. The total amount of iron extracted in these steps did not surpass 5% of the total amount. The manganese remaining after step 1 through 3 is almost completely removed during the extraction of the ‘amorphous’ oxides.
Stud. Geophys. Geod., 48 (2004)
351
J.F.L. Garming et al.
Approximately 30% of the total amount of iron present in the sediments of the oxidised sapropel is extracted during the removal of the ‘amorphous’ oxides (step 4, Table 2; Fig. 3b). In the zone of active oxidation this increases to about 45% of total iron content. A small amount of iron can be assigned to the ‘crystalline’ oxides fraction throughout the core. The amount decreases with depth in the oxidised sapropel. Higher values appear again in the active oxidation zone to decrease again in the reduced sapropel. During the dissolution of the ‘amorphous’ oxides, also a distinct amount of silicon was dissolved, as indicated by the dashed line in Fig 3a. During the removal of the remaining carbonates (step 5, Table 2) some iron and silicon were extracted as well. This could be the result of the dissolution in the previous step 4, removal of the ‘amorphous’ oxides. The largest amount of iron found in the sediments, approximately 50%, appears to be incorporated into silicates (step 7). In step 8, the extraction of pyrite, iron was only extracted in the reduced part of the sapropel. The residual minerals (step 9) were mainly composed of aluminium, iron, and titanium.
Fig. 3. (a) The amount of manganese (g/kg), and (b) the amount of iron (g/kg) extracted in the different steps of the sequential extraction. The vertical hatched lines represent the amount removed during the removal of the coatings and carbonates (steps 1 – 3, Table 2). Horizontal hatched lines indicate the removal of the ‘amorphous’ oxides (step 4). The dashed line represents the amount of silicon (g/kg) also extracted in step 4. The diagonally hatched lines indicate the removal of the crystalline oxides and the silicates. The tiles refer to the removed pyrite and organically bound minerals. No filling was applied for the amount removed from the remaining fraction. Dashed horizontal lines indicate the approximate boundaries of different geochemical zones in the core.
352
Stud. Geophys. Geod., 48 (2004)
Magnetic Parameters after Sequential Iron Phase Extraction of Sapropel
3.3. Magnetic parameters The IRMcfb (calculated on a carbonate free basis, suffix cfb) acquired by the sediments after the different extraction steps is given in Fig. 4a, the remanent coercivity (Hcr) is presented in Fig. 4b. The IRMcfb is calculated with the assumption that the calcium extracted in the different steps of the sequential extraction is solely related to carbonates. The IRMcfb acquired by the untreated samples displays values ranging from 6.8 × 10⁻³ Am2/kg in the markerbed, via ~ 4.5 × 10⁻³ Am2/kg in the oxidised part of the sapropel, and up to 5.8 × 10⁻³ Am2/kg in the active oxidation zone. In the reduced part of the sapropel the IRMcfb is ~ 1.3 × 10⁻³ Am2/kg directly under the active oxidation zone, and 4.7 × 10⁻³ Am2/kg further down. After the removal of the coatings and carbonates (step 1 through 3) the IRMcfb decreases, on average with 25%. This indicates that magnetic material is dissolved and that the extraction of the carbonates is not completely specific.
Fig. 4. (a) IRMcfb acquisition (suffix, carbonate free basis), and (b) the remanent coercive force (Hcr) measured during backfield curves of the untreated sediment (squares) and after several steps of the sequential extraction. The IRMcfb is calculated by assuming that the amount of calcium extracted in the different steps of the sequential extraction is solely related to carbonates. Diamonds: the removal of the coatings and carbonates, steps 1−3 in the extraction scheme (Table 1). Triangles: the removal of the ‘amorphous’ oxides (step 4). Plusses: the removal of the remaining carbonates (step 5). Crosses: the removal of ‘crystalline’ oxides (step 6). Dashed horizontal lines indicate the approximate boundaries of different geochemical zones in the core. Stud. Geophys. Geod., 48 (2004)
353
J.F.L. Garming et al.
The removal of the ‘amorphous’ oxides further decreases the magnetisation measured. The peak at the lower boundary of the active oxidation zone becomes more perceptible. After the second removal of the carbonates the observed magnetisation is slightly higher then that of the previous measurements, this can be attributed to the concentration of the magnetic signal. The removal of the ‘crystalline’ oxides results in a total decrease of magnetisation to approximately 0.6 × 10⁻³ Am2/kg. A large peak is present in the remanent coercivity (Hcr, Fig. 4b), located at the lower boundary of the active oxidation zone. After the removal of the carbonates, the ‘amorphous’ oxides and the remaining carbonates, the down-core shape of the coercivity profile remains unchanged. The peak in coercivity disappears after the removal of the ‘crystalline’ oxides: a constant remanent coercivity of approximately 30 × 103 A/m is observed. 3.4. IRM component analysis The results of the IRM component analysis are summarised in Table 3. In the untreated sediments, three components could be identified in the oxidised sapropel and the active oxidation zone. These are a relatively strong low-coercivity component (component 1) and a relatively weak high coercivity component (component 2), identified in the studies of Passier et al. (2001) and Kruiver and Passier (2001) as respectively ‘detrital’ magnetite and hematite. Component 3 was interpreted along similar lines as Kruiver and Passier (2001) as biogenic magnetite. It displays a characteristic low dispersion (DP) in the coercivity, indicating a narrow grain-size range distribution. In the sediments of the reduced sapropel component 3 could not be identified. The removal of the ‘amorphous’ oxides changes the distribution of the components in the sapropel. A relative increase to the SIRM contribution of component 1, ‘detrital’ magnetite is observed. Consequently, the other components, biogenic magnetite and hematite, display a decrease in their magnetic contribution. The contribution of component 2 (hematite) decreases strongly in the reduced part of the sapropel. After the removal of the ‘crystalline’ oxides, component 3 (biogenic magnetite) disappears from the sediments. The components 1 and 2, respectively ‘detrital’ magnetite and hematite remain detectable.
4. DISCUSSION 4.1. Diagenetic interpretation The identification of the diagenetic zones in the sediments of boxcore PS036BC is mainly based on the colour transitions observed in the sediments. The geochemical analyses confirmed the presence and location of the zones (Figs. 1 and 3). The markerbed, indicated by darker sediments and a manganese peak, is located at 26 cmsbd. It also marks the original upper boundary of sapropel S1 (van Santvoort et al., 1996). The transition from pale brown to slightly yellow/orange sediments occurs at a depth of approximately 30 cm, and marks the upper boundary of the active oxidation zone, in which the maximum concentrations of iron are observed. However no second manganese peak could be
354
Stud. Geophys. Geod., 48 (2004)
Magnetic Parameters after Sequential Iron Phase Extraction of Sapropel
observed in this zone, as in previous studies by e.g. van Santvoort et al. (1996) and Passier et al. (2001). The transition of oxidised to reduced sediments is located at a depth of 32 cm as evidenced by the presence of pyrite below this depth. In the different diagenetic zones different proportions of iron species are found. This not only pertains to the magnetic iron oxides but to fine-grained super-paramagnetic iron oxides as well. Earlier mineral-magnetic analysis (Passier et al., 2001; Passier and Dekkers 2002) pointed in this direction, but firm validation is obtained in the present research.
Table 3. Average fitted IRM components for the different geochemical zones in the core as specified in figures 3 and 4 (Ox. Sap: Oxidised Sapropel; AOZ: Active Oxidation Zone; Red. Sap: Reduced Sapropel). The SIRM is given in 10−3 Am2/kg, units for relative contribution are percentages, units for mean 10logB1/2: 10log(mT) and DP: 10log(mT). Section A, untreated sediments. Section B, after coating and carbonate extraction. Section C, after extraction of the ‘amorphous’ oxides. Section D, after extraction of the remaining carbonates. Section E, after extraction of the ‘crystalline’ oxides.
A
B
C
D
E
Ox. Sap AOZ Red. Sap Ox. Sap AOZ Red. Sap Ox. Sap AOZ Red. Sap Ox. Sap AOZ Red. Sap Ox. Sap AOZ Red. Sap
Component 1
Component 2
Component 3
SIRM
Rel. Mean contr. 10 DP ( log B1/2) SIRM
Rel. Mean contr. 10 DP ( log B1/2) SIRM
Rel. Mean contr. 10 DP ( log B1/2) SIRM
1.767
0.457
1.649
0.364 0.076
2.553
0.409 0.467
1.747
0.128
2.576
0.309
1.801
0.465 0.296
2.254
0.279 0.395
1.858
0.171
1.454
0.703
1.569
0.397 0.297
2.242
0.429
3.090
0.326
1.417
0.336 0.049
2.631
0.347 0.624
1.736
0.174
4.163
0.310
1.748
0.420 0.311
2.154
0.309 0.379
1.871
0.184
1.739
0.683
1.452
0.357 0.317
2.217
0.429
1.859
0.579
1.719
0.430 0.034
3.053
0.223 0.386
1.731
0.150
3.097
0.332
1.796
0.393 0.364
2.149
0.281 0.304
1.862
0.181
1.137
0.856
1.669
0.418 0.144
2.356
0.371
2.366
0.596
1.704
0.445 0.040
3.068
0.198 0.364
1.737
0164
3.545
0.363
1.844
0.455 0.289
2.429
0.186 0.348
1.851
0.191
0.753
0.777
1.712
0.426 0.223
2.717
0.265
0.649
0.965
1.726
0.444 0.035
3.172
0.145
0.524
0.939
1.736
0.444 0.061
3.200
0.102
0.512
0.827
1.749
0.426 0.169
2.890
0.283
Stud. Geophys. Geod., 48 (2004)
355
J.F.L. Garming et al.
The results of the sequential extraction allocate circa 35% ‘amorphous’ iron, 10% ‘crystalline’ iron, and 55% ‘other’ iron (mainly silicate-related iron), to the total iron content of the oxidised sapropel (Figs. 1 and 3). In the peak of the active oxidation zone the iron is allocated over the same species but in different proportions, 45% ‘amorphous’ iron, 10% ‘crystalline’ iron, and 45% ‘other’ iron. In the reduced part of the sapropel the proportions are: approximately 20% iron incorporated into oxides, 25% pyrite-related iron, and 55% ‘other’ iron. Manganese is incorporated into carbonates and ‘amorphous’ oxides. In the markerbed the oxides are the dominant species, whereas in the oxidised part of the sapropel and the active oxidation zone and approximately equal amount of carbonate related manganese is present. In the reduced part of the sapropel mainly carbonate-related manganese is present. In this study, in the dissolution step with ascorbate (step 4, Table 2), a significant amount of silicon was dissolved together with aluminium and potassium, whereas in the dithionite step (step 6, Table 2), little dissolution was observed of the latter two elements. The extraction of silicon and related elements occurs in the oxidised sapropel and in the zone of active oxidation. A plausible explanation could be given by the reaction of ferrous iron with dissolved oxygen to initially form abiological ferrihydrite, that with time transforms into goethite or hematite depending on the pH conditions (cf. Konhauser, 1998 and references cited herein). Ferrihydrite can sorb a wide variety of elements and anionic groups including silicon as Si(OH)4 groups and phosphate (Carlson and Schwertmann, 1981; Schwertmann, 1988). Although both refer to pedogenic conditions, the underlying principles may be extended toward a marine setting: electrical double layers are smaller in the marine environment but the pH in the pore waters is often slightly acidic as well, i.e. ~ 6 – 7. Sorption of silicate, that is a bidendate inner-sphere complex, distinctly reduces crystallinity. It may favour a ferrihydrite aging mechanism toward more stable iron oxides via dissolution and precipitation from solution. This would yield goethite and would explain the extreme magnetic hardness in the active oxidation zone that was found by Passier et al. (2001) and Kruiver and Passier (2001). Note that a yellowish brown colour occurs within the active oxidation zone (cf. Table 1). This would point to goethite rather than to hematite. It is unclear, however, why it would ‘disappear’ higher up in the oxidised sapropel. A reason could be that the disappearance is only apparent: one could speculate that in the oxidised sapropel more hematite-like ferric oxide is added so that the colour that is ascribed to a goethite phase would no longer be traceable because hematite is known to be a strong pigment. In addition to inorganically precipitated ferric oxides also bacterially induced precipitation occurs often yielding ferrihydrite. This ferrihydrite is also a precursor of more stable iron oxides, as goethite and hematite. These iron-phases are by-products of bacterial metabolism, and may be formed in large quantities (cf. Konhauser, 1998 and references cited herein). With time and depth the downward progression of the oxidation front retards, due to continuing (oxic) sedimentation, which increases the distance between the front and the sediment-water interface. Thus, at deeper levels more time is available for the formation of bacterially induced iron phases. Moreover, magnetotactic bacteria can form magnetite. Hence we end up with a ‘bimodal’ iron oxide precipitate: amorphous iron oxides that age higher up in the oxidised sapropel (they become older with decreasing depth) and highly crystalline magnetotactic magnetite that may partially maghematise higher up (Passier and Dekkers, 2002).
356
Stud. Geophys. Geod., 48 (2004)
Magnetic Parameters after Sequential Iron Phase Extraction of Sapropel
4.2. Magnetic parameters and sequential extraction IRM component analysis The diagenetic zones - the oxidised sapropel, the active oxidation zone, and the reduced sapropel - display different IRM properties pointing to a chemically different environment. Three coercivity phases could be identified in the IRM component analysis: Component 1 is interpreted as ‘detrital’ magnetite, component 2 as hematite, and component 3 as biogenic magnetite (Table 3). The first component, ‘detrital’ magnetite, is the main component remaining in the sediment samples after the extraction of carbonates and amorphous (iron) oxides. In the active oxidation zone this component displays higher coercivities compared to the surrounding diagenetic zones, until the removal of the ‘crystalline’ oxides. Coatings on the mineral surface, most likely composed of iron-silicates, could be responsible. The difference between the active oxidation zone and the other zonations is reduced after the extraction of the ‘amorphous’ oxides. After this step the majority of the iron-silica precipitates is removed as discussed in the previous section. It remains to be shown whether the part of IRM component 1, remaining after the first six steps of the sequential extraction, is a pure mineral surviving in the sediments after reductive diagenesis, or whether it is present as inclusions in other mineral-phases as proposed by Canfield and Berner (1987). Component 2, identified as hematite by Kruiver and Passier (2001), is strongly affected by the sequential extraction. Its coercivity increases from 10logB1/2 ~ 2.6 (log mT) to ~ 3.1 (log mT) after the removal of the ‘amorphous’ oxides in the oxidised part of the sapropel. Simultaneously, the dispersion parameter (DP) decreases from 0.35 (log mT) to 0.22 (log mT). This indicates a poorly crystalline hematite-like phase that is preferentially dissolved over the goethite phase, which is magnetically harder. This would imply the presence of both goethite and hematite in the oxidised sapropel, concurring with colour observations. After extraction of the ‘crystalline’ oxides ~ 2% of component 2 remains, indicating that not has been completely dissolved. In the zone of active oxidation the coercivity remains relatively constant, until the removal of the ‘crystalline’ oxides. The coercivity then increases to approximately 10logB1/2 of 3.2 (log mT) with a dispersion (DP) of 0.12 (log mT). Apparently goethite is present and is more resistant to dissolution than hematite. The third IRM component, biogenic magnetite, is only present in the oxidised sapropel and the active oxidation zone. Like IRM component 1, it is harder in the active oxidation zone than in the other zonations. Its contribution to the SIRM decreases after the removal of the ‘amorphous’ oxides, indicating some dissolution of biogenic magnetite during this step. The effect is more pronounced in the oxidised sapropel than in the zone of active oxidation. A plausible explanation is that the magnetosome chains become disintegrated upon cell lyses after the oxidation front has moved further down in the sediment. Therefore they are more amenable to dissolution. Component 3 has disappeared completely after the extraction of ‘crystalline’ oxides. Hysteresis parameters The coercivity pattern found in the present study (Fig. 4b) with peak values at the lower boundary of the active oxidation zone was also observed in sapropel S1 by Passier
Stud. Geophys. Geod., 48 (2004)
357
J.F.L. Garming et al.
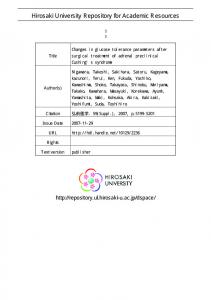
et al. (2001) and Kruiver and Passier (2001) and in other sediments by e.g. Tarduno et al. (1998). They concluded that an unusually abundant population of bacterial magnetite produces the peak at the iron-redox boundary. This coincides with the findings of the IRM component analysis. The peak disappears after the removal of the ‘crystalline’ oxides, after which biogenic magnetite is absent in the IRM component analysis. It is common to summarize hysteresis parameters by plotting Mrs/Ms versus Hcr/Hc (i.e. Day plot), because different domain states plot in different areas (Day et al., 1977). Fig. 5 shows the Day plot for the ten samples analysed after the different extraction steps. The sample positions on the Day plot have to be viewed with some caution because the domain state areas refer to monomineralic (titano-)magnetite assemblages in the absence of superparamagnetic (SP) grains. SP grains tend to displace values for the hysteresis ratios to the right of the experimentally calibrated band of Day et al. (1977) as a recent study by Dunlop (2002) shows. The theoretical Day-plot curves as calculated by Dunlop
Fig. 5. Classification of magnetic minerals in terms of magnetisation and coercivity ratios (after Day et al., 1977). The grey curves in the background are theoretical Day plot curves calculated for magnetite by Dunlop (2002). Numbers along the curves are volume fractions of the soft component (SP or MD) in mixtures with SD grains. Squares: represent the measured data of the untreated sediment of this study. Diamonds: after the removal of the coatings and carbonates (steps 1 – 3). Triangles: after the removal of the ‘amorphous’ oxides (step 4). Plusses, after the removal of the remaining carbonates (step 5). Crosses: after the removal of the ‘crystalline’ oxides (step 6). Colour coding of the symbols: Markerbed, filled grey; Oxidised Saporpel, open grey; Active oxidation zone, open black; Reduced Sapropel, filled black. Note that after extraction of the ‘crystalline’ oxides the initial scattering of the samples is strongly reduced.
358
Stud. Geophys. Geod., 48 (2004)
Magnetic Parameters after Sequential Iron Phase Extraction of Sapropel
(2002) are added to Fig. 5. Compared to the calculated mixing curves of single domain (SD) and multidomain (MD) grains and the experimentally calibrated band, all data points are displaced to the right. The position of the samples conforms rather closely to the trend line for unremagnetised limestones as found by Channell and McCabe (1994). This indicates an assemblage of magnetic minerals dominated by ‘primary’ magnetite concurring with results of the IRM component analysis. Surface oxidation and the presence of moderate amounts of hematite and/or goethite, as indicated by the IRM component analysis, play a role in explaining the observed displacement to the right. Extreme displacement to the right as observed in the samples taken in and near the active oxidation zone invokes the presence of very fine-grained SP magnetic minerals. Most SP grains occur in the sample from the active oxidation zone. The sample directly above it needs much less SP grains to explain its position on the Day plot. Note that the position does not change so much after removal of the ‘amorphous’ oxides: this indicates hematite and goethite are present as well in those samples. After the removal of the ‘crystalline’ oxides in step 6 of the sequential extraction this extreme displacement disappears. The difference in Mrs/Ms and Hcr/Hc ratios between the samples has almost disappeared: all samples plot closely together in the pseudo single domain (PSD) field. A tendency towards the calculated SD-MD curves is observed for the samples as well. Deviations from the experimentally calibrated band are related to the presence of a mixture of magnetic-minerals as indicated by the IRM components. It could be that the remaining magnetic minerals occur as inclusions in silicates. Electron microscopic analysis could be used to verify this.
5. CONCLUSIONS AND IMPLICATIONS The sequential extraction clearly separates different phases of iron that occur in oxic and in anoxic sediment conditions. However, the separation between the ‘amorphous’ and ‘crystalline’ oxides seems to be grain-size selective. The dissolution of silicon during the extraction of the ‘amorphous’ oxides implies the presence of a relatively easily soluble ferro-silicate, which is most likely to be a by-product of bacterial metabolism. IRM acquisition followed by IRM component analysis could identify three components, e.g. different species of iron oxides. The magnetites found in the sapropelic sediments can be subdivided into two categories: 1) ‘Detrital’ magnetite with a relatively low mean coercivity, 2) Biogenic magnetite, formed by magnetotactic bacteria living in the lower part of the active oxidation zone. The grains display single domain to superparamagnetic behaviour. The other component identified is a mixture of hematite and goethite. The sequential extraction together with the magnetic parameters of the sediments identified also two other iron phases of diagenetic origin: a) Coatings on mineral surfaces mainly composed of ferro-silicates; b) ‘Amorphous’ iron oxides (hematite and/or goethite) which are likely to have the same microbially induced origin as the coatings. The hysteresis measurements and the IRM component analysis, verify earlier findings that the coercivity peak observed in the sediments is of diagenetic origin. It is most likely the result of the activity of magnetotactic bacteria forming in-situ magnetite (Tarduno et al., 1998; Passier et al., 2001, Kruiver and Passier, 2001).
Stud. Geophys. Geod., 48 (2004)
359
J.F.L. Garming et al. Acknowledgements: We thank captain J. Ellen and the crew and scientific party of the R.V. Pelagia PASSAP cruise for their pleasant collaboration. Furthermore, H. de Waard, D. van de Meent, and G. Nobbe are acknowledged for analytical assistance. The manuscript was greatly improved through consideration of the comments of an anonymous reviewer. This study was supported by the Netherlands Organisation of Scientific Research (NWO, in particular the programs PASS2 and SAPS), and EU Mast project MAS3-CT97-0137 (SAP).
References Béthoux J.P. and Pierre C., 1999. Mediterranean functioning and sapropel formation: respective influences of climate and hydrological changes in the Atlantic and Mediterranean. Marine Geology, 153, 29−39. Bleil U., 2000. Sedimentary magnetism. In: H.D. Schulz and M. Zabel (Eds.), Marine Geochemistry, Springer-Verlag, Berlin, Heidelberg, 73−83. Canfield D.E. and Berner R.A., 1987. Dissolution and pyritization of magnetite in anoxic marine sediments. Geochimica et Cosmochimica Acta, 51, 645–659. Carlson L. and Schwertmann U., 1981. Natural ferrihydrites in surface deposits from Finland and their association with silica. Geochimica et Cosmochimica Acta, 45, 421–429. Channell J.E.T. and McCabe C., 1994. Comparison of magnetic hysteresis parameters of unremagnetized and remagnetized limestones. J. Geophys. Res. B, 99, 4613–4623. Cita M.B., Vergnaud-Grazzini C., Robbert C., Chamley H., Ciaranfi N., d’Onofrio S., 1977. Paleoclimatic record of a long deep sea core from the eastern Mediterranean. Quat. Res., 8, 205–235. Chester R. and Hughes M.J., 1967. A chemical technique for the separation of ferro-manganese minerals, carbonate minerals and adsorbed trace elements from pelagic sediment. Chemical Geology, 2, 249–262. Colley S., Thomson J., Wilson T.R.S. and Higgs N.C., 1984. Post-depositional migration of elements during diagenesis in brown clay and turbidite sequences in the North East Atlantic, Geochimica et Cosmochimica Acta, 48, 1223–1235. Day R., Fuller M.D. and Schmidt V.A., 1977. Hysteresis properties of titanomagnetites: grain-size and compositional dependence. Phys. Earth Planet. Inter., 13, 260–267. De Rijk S., Hayes A. and Rohling E.J., 1999. Eastern Mediterranean sapropel S1 interruption: an expression of the onset of climate deterioration around 7 ka BP. Marine Geology, 153, 337−343. Dunlop D.J., 2002. Theory and application of the Day plot (Mrs/Ms versus Hcr/Hc) 1. Theoretical curves and tests using titanomagnetite data. J. Geophys. Res., 107, 10.1029/2001JB000486. Heslop D., Dekkers M.J., Kruiver P.P. and van Oorschot I.H.M., 2002. Automated fitting of isothermal remanent magnetisation acquisition curves using an expectation-maximisation algorithm. Geophys. J. Inter., 148, 58−64. Hilgen F.J., 1991. Astronomical calibration of Gauss to Matuyama sapropels in the Mediterranean and implication for the Geomagnetic Polarity Time Scale. Earth Planet. Sci. Lett., 104, 226−244.
360
Stud. Geophys. Geod., 48 (2004)
Magnetic Parameters after Sequential Iron Phase Extraction of Sapropel Karlin R., Lyle M. and Heath G.R., 1987. Authigenic magnetite formation in suboxic marine sediments. Nature, 326, 490−493. Karlin R., 1990. Magnetite diagenesis in marine sediments from the Oregon continental margin. J. Geophys. Res. B, 95, 4405−4419. Kidd R.B., Cita M.B. and Ryan W.B.F., 1978. Stratigraphy of Eastern Mediterranean sapropel sequences recovered during Leg 42A and their paleoenvironmental significance. Init. Rep. Deep-Sea Drill. Proj., 42, 421−443. Konhauser K.O., 1998. Diversity of bacterial iron mineralization. Earth Sci. Rev., 43, 91−121. Kruiver P.P., Dekkers M.J. and Heslop D., 2001. Quantification of magnetic coercivity components by the analysis of acquisition curves of isothermal remanent magnetisation. Earth Planet. Sci. Lett., 189, 269−276. Kruiver P.P. and Passier H.F., 2001. Coercivity analysis of magnetic phases in sapropel S1 related to variations in redox conditions, including an investigation of the S ratio. Geochemistry Geophysics Geosystems, 2, 2001GC000181. Larrasoaña J.C., Roberts A.P., Stoner J.S., Richter C. and Wehausen R., 2003. A new proxy for bottom-water ventilation in the eastern Mediterranean based on diagenetically controlled magnetic properties of sapropel-bearing sediments. Palaeogeography, Palaeoclimatology, Palaeoecology, 190, 221−242. Nolet G.J. and Corliss B.H., 1990. Benthic foraminiferal evidence for reduced deep-water circulation during sapropel deposition in the eastern Mediterranean. Marine Geology, 94, 109−130. Olausson E., 1961. Studies of deep sea cores. Rep. Swed. Deep-Sea Exped., 1947−1948, 8(6), 36−391. Passier H.F., 1998. Sulphur Geochemistry and Sapropel Formation, Syngenetic and Diagenetic Signals in Eastern Mediterranean Sediments. PhD. Thesis, Utrecht University, Geologica Ultraiectina, No 158. Passier H.F., Bosch H.J., Nijenhuis I.A., Lourens L.J., Böttcher M.E., Leenders A., Sinninghe Damste J.S., de Lange G.J. and de Leeuw J.W., 1999. Sulphidic Mediterranean surface waters during Pliocene sapropel formation. Nature, 397, 146−149. Passier H.F., de Lange G.J. and Dekkers M.J., 2001. Magnetic properties and geochemistry of the active oxidation front and the youngest sapropel in the eastern Mediterranean Sea. Geophys. J. Inter., 145, 604−614. Passier H.F. and Dekkers M.J., 2002. Iron oxide formation in the active oxidation front above sapropel S1 in the eastern Mediterranean Sea as derived from low-temperature magnetism. Geophys. J. Inter., 150, 230−240. Pruysers P.A., de Lange G.J., Middelburg J.J. and Hydes D.J., 1993. The diagenetic formation of metal-rich layers in sapropel-containing sediments in the eastern Mediterranean. Geochimica et Cosmochimica Acta, 57, 527−536. Robertson D.J. and France D.E., 1994. Discrimination of remanence-carrying minerals in mixtures, using isothermal remanent magnetization acquisition curves. Phys. Earth Planet. Inter., 82, 223−234. Robinson S.G., Sahota J.T.S. and Oldfield F., 2000. Early diagenesis in North Atlantic abyssal plain sediments characterised by rock-magnetic and geochemical indices. Marine Geology, 163, 77−107. Stud. Geophys. Geod., 48 (2004)
361
J.F.L. Garming et al. Rohling E.J. and Hilgen F.J., 1991. The eastern Mediterranean climate at times of sapropel formation: a review. Geologie en Mijnbouw, 70, 253−264. Rossignol-Strick M., 1983. African monsoons, an immediate climatic response to orbital insolation. Nature, 303, 46−49. Rossignol-Strick M., 1985. Mediterranean quaternary sapropels, an immediate response of the African monsoon to variation of insolation. Palaeogeography, Palaeoclimatology, Palaeoecology, 49, 237−263. Rutten A. and de Lange G.J., 2002a. A novel selective extraction of barite, and its application to eastern Mediterranean sediments. Earth Planet. Sci. Lett., 198, 11−24. Rutten A. and De Lange G.J., 2002b. Sequential extraction of iron, manganese and related elements in S1 sapropel sediments, eastern Mediterranean. Palaeogeography, Palaeoclimatology, Palaeoecology, 190, 79−101. Schwertmann U., 1988. Occurrence and formation of iron oxides in various pedoenvironments. In: J.W. Stucki, B.A. Goodman and U. Schwertmann (Eds), Iron in Soils and Clay Minerals. Reidel Publishing, Dordrecht, 267−308. Sigl W., Chamley H., Fabricius F., Giroud d’Argoud G. and Mueller J., 1978. Sedimentology and environmental conditions of sapropels. Init. Rep. Deep-Sea Drill. Proj., 42, 445−465. Tarduno J.A., Tain W. and Wilkinson S., 1998. Biogeochemical remanent magnetisation in pelagic sediments of the western equatorial Pacific Ocean. Geophys. Res. Lett., 25, 3987−3990. Thomson J., Jarvis I., Green D.R.H., Green D.A. and Clayton T., 1998. Mobility and immobility of redox-sensitive elements in deep-sea turbidites during shallow burial. Geochimica et Cosmochimica Acta, 62, 643−656. Thunell R.C., Williams D.F. and Belyea P.R., 1984. Anoxic events in the Mediterranean Sea in relation to the evolution of late Neogene climates. Marine Geology, 59, 105−134. Van Santvoort P.J.M., de Lange G.J., Thomson J., Cussen H., Wilson T.R.S., Krom M.D. and Ströhle K., 1996. Active post-depositional oxidation of the most recent sapropel (S1) in sediments of the eastern Mediterranean Sea. Geochimica et Cosmochimica Acta, 60, 4007−4024. Vergnaud-Grazzini C., Ryan W.B.F. and Cita M.B., 1977. Stable isotopic fractionation, climate change and episodic stagnation in the eastern Mediterranean during the late Quaternary. Marine Micropaleontology, 2, 353−370.
362
Stud. Geophys. Geod., 48 (2004)