Sep 3, 1991 - the rat. Changes in amplitude, duration and latency of motor unit action potentials were monitored in the course of fatigue test in the three types ...
Changes in motor unit action potentials during the fatigue test Jan Celichowski, Kazimierz Grottel and Alicja Rakowska Department of Neurobiology, Academy of Physical Education, 10 Droga Dqbinska St., 61-555 Poznan, Poland
Abstract. The studies were performed on medial gastrocnemius motor units of the rat. Changes in amplitude, duration and latency of motor unit action potentials were monitored in the course of fatigue test in the three types of motor unites : FF (fast twitch, fatigable), F R (fast twitch, resistant), and S (slow twitch, resistant) motor unit. In a majority of the motor units the amplitude of action potential decreased. The most pronounced decrease took place in FF units, less pronounced one in FR units, while in S type motor units the decrease was insignificant. However, in a part of investigated motor units the amplitude of their action potential transiently increased at the beginnig of the fatigue test and, then decreased or was maintained at the same level till the end of the fatigue test. In a few motor units, particulary the slow ones, no changes in action potential amplitude were observed. In the studied material, a decrease in action potential amplitude was on the average less pronounced than a decrease in tetanus tension in the course of the fatigue test. In a majority of studied motor units the duration of action potential was becoming prolonged, which was most pronounced in FF type motor units and least pronounced in S type ones. In few slow motor units the duration showed no alterations. Changes in action potential duration were much more marked than changes in their amplitude. The changes in action potential in fast motor units were less pronounced than changes in their tetanus tension, while in the slow motor units they resembled each other in intensity. Comparison of motor unit action potential changes with changes in their tetanic tension in the course of fatigue test demonstrated no clear-cut relationship between the two phenomena.
Key words: motor unit, action potential, fatigue test
146
J. Celichowski et al.
INTRODUCTION Fatigue test was introduced to studies on motor units by Burke et al. (1973). Already in one of the first studies the authors controlled the time course of action potentials of the studied units, apart from noting the decrease in tetanic tension. They noted greater stability of action potentials as compared to motor unit tetanic tension. They observed also that a prolonged duration of action potential during the fatigue test developed only in the most fatigable motor units. Since then, numerous other studies appeared in which extensive changes were observed in action potential of muscle fibres upon their fatigue (Reinking et al. 1975, Khan and Bengtsson 1985, Sandercock et al. 1985, ~ a n n e g r e nand Westerblad 1987, Enoka et al. 1988,1989).The changes pertained to both amplitude and duration of the action potential. Most of the studies were conducted on whole muscles or on individual muscle fibres, while a portion only was performed on individual motor units. Moreover, it remained unclear whether the potentiation of twich tension of a motor unit was related to its action potential changes, whether changes in amplitude were related to the duration of action potentials, or how strictly were changes in action potential related to changes in tetanic tension in the course of fatigue of motor units. In studies conducted earlier in our laboratory, tetanic tension was found to undergo significant alterations during the fatigue test, particularly in fast motor units. Originally, the tension was increasing to decrease later on due to fatigue (Grottel and Celichowski 1990, Celichowski 1992). The present study aimed at determining the interrelations between the alterations in tetanic tension and changes in action potential of motor units in the course of the fatigue test.
METHODS The studies were performed on 36 Wistar strain rats, weighing, on the average, 303 51 g, in pentobarbital anaesthesia (Vetbutal, 30 mg/kg body weight, i.p.). A detailed description of the techniques used was published earlier (Celichowski 1992). In order to examine the function of individual motor units in the studied medial gastrocnemius muscle, the techique of separating ventral root of L5 was used. Only the units showing all or none type response, both in twich and in action potential records, to stimulation of variable intensity were taken to represent individual motor units. Silver bipolar electrodes were used to stimulate the separated fragment of the ventral root.
+
Twich force was recorded in isometric conditions using an inductive meter attached to the separated Achilles tendon. In the experiments, the studied muscles were stretched at 10 g force, since at such a load the motor units of medial gastrocnemius muscle exhibited peak values of twich force (Grottel et al. 1990). Action potentials were recorded using bipolar electrodes, consistig of two parallel silver wires, 150 pm in diameter, coated with paint. Recording surfaces (each 150 x 75 pm) were place on the two wires in the middle part of their long axis (Grottel et al. 1986). The electrodes were implanted to the muscle perpendicularly to muscle fibres. Before recording, the electrodes were placed in such a position that the action potential of highest amplitude was recorded for a given motor unit. The analysed motor units showed, at the beginnig of the fatigue test, the action potential amplitude of at least 50 pV. In the course of the experiment, motor units were subjected sequentially to : (1) stimulation with single stimuli to obtain a single twich of the motor unit, (2) the sag test using a sequence of 20 Hz and 40 Hz stimuli lasting 500 ms (Grottel and Celichowski 1990), (3) the fatigue test inducing the fatigue with 40 Hz bursts of stimuli lasting 330 ms, repeated every 1 s for 4 min (Burke et al. 1973).The applied rectangular electric stimuli lasted for 0.1 ms and were up to 0.5 V of amplitude. In single twitch records, contraction time, half-relaxation time and twich force were calculated. Basing on the sag test, motor units were groupped into fast ones and slow ones. The subdivision of fast units into F F and FR units was based on the value of fatigue index. It expressed the ratio of tetanus tension after 2 min of fatigue test, counting from the end of the secondary rise, to the most potentiated tetanus tension i.e. at the end of the secondary rise. FR motor units showed fatigue index below 0.5 and FR units exhibited values greater than 0.5 (Burke et al. 1973, Kernel1 et al. 1983). The tension of sequential tetani was calculated between baseline and the highest deflection of tetanus record. Action potentials of motor units in the course of the fatigue test were photographed at the oscilloscope screen. The photographs were taken at the beginnig of the fatigue test and, then, every minute. In each photograph, bursts of action potentials, corresponding to a single tetanus in the course of the fatigue test, were overlapped. Additionally, one photograph was taken following first 30 s of the test. An analysis of action potential changes in the course of fatigue test was based on measurements of amplitude, latency and duration of the action potential. The
Motor unit action potentials in fatigue test TABLE I Mean values and standard deviations of principal parameters for various types of investigated motor units. CT, contraction time; HRT, half-relaxation time; TwF. twitch force; FI, fatigue index CT (ms)
H RT (ms)
Tw F (8)
FI
amplitude of action potential was measured between marginal deflections of the negative and positive action potential phases. Usually, within one tetanus, consecutive action potentials were of the same amplitude. However, in some F F units the amplitude decreased within one tetanus. In such a case, the amplitude of the first action potential within the tetanus (the highest one) was calculated. Duration of the action potential was measured from the start of action potential (beginnig of record deflection from the baseline) to its end (point of return of the record to the line) (Grottel and Celichowski 1988). Latency was measured from the moment of stimulation to the start of the action potential. In the figures and in the text, values of the analysed parameters found at the beginnig of the fatigue test were given the relative weight of 100%. A total of 58 motor units, including 25 F F type motor units, 18 FR type motor units and 15 S type motor units were examined. Tn this study mean values and their standard deviations were calculated, and values for a given parameter were compared between groups of motolunits using t-Student test.
147
pronounced in F F than in FR units. Tetani of tension potentiated over the tension of the second tetanus in FR motor units were noted, on the average, for even more than the first two minutes of fatigue test (Table 11). In F F motor units, however, the potentiation was observed on the average for only one minute (Table IT). Tetanic tension of slow motor units was much more stable (Fig. 1,s motor units, Table 11). At the beginning, for approximately 10 s it was decreasing. Then, it increased slightly and finally, usually showed no alterations from the end of the first minute of the fatigue test to the end of the test. Tn two slow motor units, the original rapid decrease in tetanic tension was followed by a moderate decrease in the tension, lasting to the end of the fatigue test.
RESULTS Values of principal parameters of the studied motor units of various types are given in Table I. Tetanic tension was changing in the course of' fatigue test. In fast motor units the tension decreased within the first two tetani (Fig. 1, F F and FR motor units). The first tetanus used to be accompanied by a very pronounced sag (for a more description see Celichowski 1992). Starting- from the second tetanus, a marked increase occurred in tetanic tension (secondary rise), lasting from l0 to 50 It was followed by a decrease in tetanic tension, more
S 76 60 80
120
180
2408
TIME t ~ g I.. Average time course of changes in tetanus tension in FF, t R and S type motor units during 240 s of fatigue test. The tension was calculated for the first and second tetanus, then up to the end of the tirst minute of fatigue test every I0 s a n d then, every 30 s. For the fast motor units, tension of the second tetanus of fatigue test (when secondary rise began) and for the S units tension of the first tetanus were taken as 100%.
148
J. Celichowski et al.
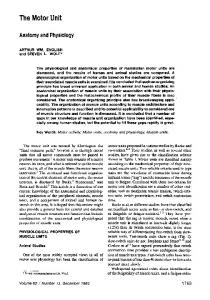
Fig. 2. Action potential records for three motor units of FF, FR and S type, collected at the beginning of fatigue test and after consecutive minutes of fatigue test. Numbers of the left side indicate time of recording (in seconds, starting from the first tetanus). Time calibration, 5 ms; amplitude calibration, 200 pV. Fatigue index values: 0.00 for F F type motor unit; 1.00 for FR unit and 0.90 for S motor unit.
FF 1
47
Mean values of amplitudes, duration and latency of action potentials for various types of motor units at the beginning of fatigue test are given in Table 111.
Differences between mean values of the above listed parameters of action potentials for motor units of different types proved insignificant (P > 0.05).
TABLE I1 Mean values and standard deviations of motor unit action potential amplitude and duration and of tetanus tension after 1,2,3 and 4 min of fatigue test. The values recorded in fhe first second of fatigue test were taken as 100% (for tetanus tension of fast motor units the tenslon of the second tetanuts) --
I minute
2 minutes
3 minutes
4 minutes
Muap F F amplitudeFR (%) S
82k22 95f12 98+_6
68f 28 91+_21 98fll
57128 85f27 98k14
47f29 82f31 98f18
MUAP F F duration FR (%) S
132+25 lllf14 106k8
148f 26 123+_26 109f 8
1 6 3 5 40 131f30 113f9
174+45 142141 115k12
FF FR S
102f71 118k26 91f8
34k26 104f27 9118
14f13 83f28 89&11
9f9 69k29 87f16
tetanus tension (O/o)
TABLE I11 Mean values and standard deviations of amplitude, duration and latency of action potentials recorded during the first tetanuts in the fatigue test for motor units of the three types Amplitude (,lV)
Duration (ms)
Latency (ms)
An analysis of action potentials recorded in sequential minutes of fatigue test showed that both their amplitude and duration and, in some cases, also their latency were changing. The examples of motor unit action potential records are ilustrated in Fig. 2.
Motor unit action potentials in fatigue test Amplitude of motor unit action potentials
In the course of fatigue test, action potential amplitudes were usually decreasing gradually. The most pronounced decrease in amplitude was observed in the F F type motor units (decrease by a mean of 53% within
40
1
149
4 min.), a smaller one in FR units (by 18%)and the least pronounced one in S type motor units (by 2%) (Fig. 3A, Table 11). Action potential amplitude values after 1, 2, 3 and 4 min of fatigue test on a F F type motor units, expressed as percentage, differed significantly from analogous values for FR and S units (P < 0.01). O n the
I
I
60
120
_____I
240 a
180
TlME
%
180170 --
U A p
Fig. 3. Averaged time course of changes in amplitude of motor unit action potentials ( M U A P ) (A) and in the duration of the notentials ( R ) during the fatigue test for three types of motor units. Values of these parameters of the action potentials at the beginning of fatigue test were taken to represent 100%.
I,160 --
-----I
1
60
120
TIME
180
240 s
150
J. Celichowski et al.
other hand, the respective differences between the latter two types of motor units were insignificant (P > 0.05). In the time course of fatigue test, 21 motor units (6 F F units, 10 FR units and 5 S units) demonstrated a slight increase in action potential amplitude. This increase in amplitude in some of the units was transient and it was observed only after 30 s of the fatigue test. It was followed frequently by more intense decrease in amplitude. In some other motor units the increase in their amplitude lasted longer. In 3 S type motor units,
5 FR and 1 F F action potential amplitude recorded after 4 min of fatigue test exceeded even original values, on the average by 15.9% for S type motor units, 10.1% for FR units and 18.2% for F F motor unit. No relation was noted between the increase in action potential amplitude and secondary rise, i.e. between their time duration or amplitude changes. In 1 F F type motor unit, 4 FR units and 6 S units, action potential amplitude showed no alterations in the time course of fatigue test.
MUAP AMPLITUDE
MUAP DURATION Fig. 4. Relation between tetanus tension and action potential amplitude both expressed percents for three types motor units. Tension of the second tetanus, when secondary rise began, was taken to represent 100% of tetanus tension. Amplitude of action potential recorded during the lirst tetanus of the fatigue test (it did not differ significantly from the amplitude of the second tetanus) was taken to represent 1001%;,.0, point illustrating the relation at the beginning of the fatigue test; 1, 2, 3, 4, points illustrating the relation in consecutive minutes of fatigue test. Symbols for various motor unit types as in Fig. 3B. Relation between tetanus tension and duration of action potentials both expressed in percents. For explanation see Fig. 4A. -
FATIGUE INDEX
MUAP AMPLITUDE INDEX
Fig. 5. Histograms of fatigue indices values (A) and indices of action potential amplitude changes (B) for the three types of motor units. Arrows indicate mean values
152
J. Celichowski et al.
As shown in Fig. 4A, in all types of motor units the decrease of action potential amplitude was less pronounced than the decrease of tetanic tension in the course of fatigue test. An index of action potential amplitude alterations was introduced for the three distinguished motor unit types to compare the intensity of tetanic tension alterations and that ofchanges of action potential amplitude (Fig. 5). The index expresses the ratio of action potential amplitude after 2 min of fatigue test to the original action potential amplitude. A comparison of mean values of fatigue index (Fig. 5A) and of action potential amplitude alteration index (Fig. 5B) showed that F F type motor units demonstrated a much more pronounced decrease in tetanic tension within 2 min of fatigue test than a decrease in action potential amplitude (differencesignificant at P < 0.01). In FR motor units the difference was smaller ( P < 0.05) while in S units the difference mean values was isignificant.
Duration of motor unit action potentials Duration of action potentials in all fast and in the majority of slow motor units was increasing throughout the fatigue test. In F F type motor units after 4 min it was extended by a mean of 74%, in FR units by 43% and in S units by 15% (Fig. 3B, Table 11). Expressed as percentage, duration of action potentials after the first, second, third and fourth minute of fatigue test of F F units differed significantly from analogous values obtaind for FR and S units. No significant differences in
the parameters were found between FR and S type motor units. In none of the motor units a shortening of action potential duration could be observed. For 3 S type motor units, both the amplitude of action potential as well as the action potential duration failed to change troughout the fatigue test. In a few other units of the type prolongation of action potential took place without parallel changes in their amplitude. A comparison of intensities of changes in tetanic tension with prolongation of action potential duration was conducted for the three distinguished motor unit types (Fig. 4B). A decrease in the tension was found to be accompanied by an increase in action potential duration. After 4 min of fatigue test, the decrease in tetanic tension in S type motor units was similar, when expressed in percents, to the increase in action potential duration. In FR type motor units, the decrease in tetanic tension was more evidently marked as compared to prolongation in action potential duration. In F F type motor units, the difference between the two parameter changes was even more accentuated. A comparison between changes of action potential amplitude and their duration in the course of fatigue test of all three motor unit types showed most accentued changes in the action potential duration (Fig. 6). Changes in amplitude values and in duration of action potentials correlated with each other for the entire examined population of motor units. The correlation coefficents calculated for all individual motor units amounted to -0.298 ( P < 0.05) for the percentage
MUAP DURATION Fig. 6. Relation between changes in amplitude and duration of action potentials (both expressed in percent) for the three types of motor units in the time course of fatigue test. For symbol explanation see Fig. 4.
Motor unit action potentials in fatigue test values calculated from the records made after 2 min of the test and to -0.405 (P < 0.01) after 4 min of the fatigue test. Latency of motor unit action potentials
In all slow motor units and in about half of the fast units of either type the latency of action potentials showed no changes in the course of fatigue test. In the remaining half of fast motor units the latency of the action potentials showed prolongation (by a mean of 14.2% in F F type units after 4 min of fatigue test and by a mean of 15% in FR type units). Changes within the action potential burst of fatigued motor unit
In 6 motor units of F F type and 4 units for FR type, records taken beginning usually at the 2nd or 3rd minute of fatigue test, showed that the amplitude of successive action potentials within a given tetanus was decreasing (see Fig. l , F F type motor unit). The pause between stimulations allowed for restitution of the first action potential in the subsequent tetanus to the amplitude resembling the beginning of the preceding tetanus.
DISCUSSION In studies on the medial gastrocnemius muscle of the rat, three types of motor units have been distinguished: FF, FR and S units (Kaneda et al. 1985, Grottel and Celichowski 1990).Considering the motor unit tension, FF type motor units are known to be most fatigable. Our results confirmed those of other authors (Reinking et al. 1975, Claman and Robinson 1985, Gardiner and Olha 1987)demonstrating that also action potentials of the motor units of that type undergo most pronounced changes in the course of fatigue test. However, changes in amplitude of the action potentials are less pronounced than alterations in tetanic tension. In FR type units changes in tetanic tension and in action potential amplitude are much less marked. In motor units of that type a decrease in tetanic tension is also more intense than changes in the time course of action potentials. S type motor units are most resistant to fatigue and exhibit the least intense changes in the time course of action potentials. No significant differences have been noted between changes in the two parameters in the course of fatigue test of the units. In all fast motor units of the studied muscle the
153
secondary rise has taken place. The increase in tetanic tension has not been accompanied, however, by increase in action potential amplitude of a similar intensity or duration. Similar observations have been made also by Enoka et al. (1988).However, the authors have reported fatigue test performed on the whole and a distinct muscle (extensor digitorum longus) of the rat. In motor units of all types the amplitude of their action potentials has, on the average, decreased in the course of fatigue test. Distributed ion transport across cell membrane of individual muscle fibres in the units used to be accepted as the main reason for the decreased amplitude of the action potentials taking place upon fatigue (Claman and Robinson 1985). On the other hand, causes of the increase in action potential amplitude developing in some motor units are more difficult to explain. The increase in action potential amplitude in individual muscle fibres seems improable. The increase in action potential amplitude of motor units reflects, most probably, a more efficient synchronization of negative and positive phases of muscle fibre action potentials within the motor unit. A better synchronization may also have some relation to the prolonged duration of muscle fibre action potentials when a decrease in amplitude of the potentials has not yet developed or remains insignificant. The decrease in the amplitude developes later than the action potential prolongation (Claman and Robinson 1985). The duration of action potential has been extending with fatigue of all fast and in the majority of slow motor units. In various experimental situations the phenomenon has also been observed by other authors (Burke et al. 1973, Hanson 1974, Claman and Robinson 1985, Khan and Bengtsson 1985, Gardiner and Olha 1987, Liinnergren and Westerblad 1987, Enoka et al. 1988, 1989). The duration of action potential is related to a significant extent to muscle fibre conduction velocity. The velocity has been noted to decrease with fatigue (Stilberg 1966, Lindstrom et al. 1970, Gydikov et al. 1984). Moreover action potentials migrating along muscle fibres act longer when the recording electrode has been placed on a muscle surface. The prolongation of motor unit action potential takes place not only during the decrease in tetanic tension caused by fatigue but also during the secondary rise. On the other hand, it is known that motor unit contraction time becomes prolonged during potentiation of motor unit tension (Close and Hoh 1968, Bagust et al. 1974, Kernel1 et al. 1975, Bigland-Ritchie et al. 1983, Bigland-Ritchie and Woods 1983, Hultman
154
J. Celichowski et al.
and Sjoholm 1983, Bergstrom and Hultman 1986, Kukulka et al. 1986, Dubose et al. 1987). Most probably, the increase in contraction time is also linked to the slowed conductivity of muscle fibres. Thus, conduction velocity seems to decrease from the very beginning of motor unit activity and reflects the fatigue of the motor unit developing from the very start of its activity. Therefore, the duration of action potentials ilustrates the process of fatigue more properly than the amplitude of the potentilas. A closer relation between a decrease in tetanic tension and an increase in action potential duration than that between a decrease in tetanic tension and a decrease in action potential amplitude has been noted in experiments presented here. Motor unit action potential latency undergoes prolongation in a portion of fast motor units. This increase in latency has resulted probably from the slowed down conduction velocity of action potentials along muscle fibres. For this reason, they reach the electrodes with increasing delay. Alterations in action potential amplitude within a single fatigued tetanus of a fatigue test were described in some fast units also by other authors (Gardiner and Olha 1987). However, a datailed analysis of the problem would requaire application of more perfect techniques. In order to sum up, we conclude that our results have confirmed our earlier observations on the time course of changes in tetanic tension during the fatigue test (Grottel and Celichowski 1990, Celichowski 1992). Thus, tension of unfused tetani in fast motor units has been decreasing in the first 2-3 s, which has been followed by an increase and, finally, another long decrease. In parallel, the duration in action potentials has been increasing monotonously and their amplitude has been decreasing monotonously in the majority of motor units. The results indicate that no clear-cut relation can be observed in action potential time course on one hand, and the time course on unfused tetani of motor units on the other. ACKNOWLEDGEMENT
This ivestigation was partly supported by the grant R.P. 111.52. REFERENCES Bagust J., Lewis D.M., Luck J.C. (1974) Post-tetanic effects in motor units of fast and slow twich muscle of the cat. J. Physiol. 237: 115-121.
Bergstrom M., Hultman E. (1986) Relaxation time during intermittent isometric contraction in subjects with different capacity for oxidative work. Acta Physiol. Scand. 127: 107-1 10. Bigland-Ritchie B., Johansson R., Lippold O.C.J., Woods J.J. (1983) Contractile speed and E M G changes during fatigue of sustained maximal voluntary contractions. J. Neurophysiol. 50: 313-324. Bigland-Ritchie B., Woods J.J. (1983) Changes in muscle contractile properties and neural control during human muscular fatigue. Muscle Nerve 7: 691-699. Burke R.E., Levine D.N., Tsairis B., Zajac F.E. (1973) Physiological types and histochemical profiles in motor units of the cat gastrocnemius. J. Physiol. 234: 723-748. Celichowski J. (1992) Motor units of medial gastrocnemius muscle in the rat during the fatigue test. 1. Time course of unfused tetanus. Acta Neurobiol. Exp. 52: 17-21 Claman H.P., Robinson A.J. (1985) A comparison of electromyographic and mechanical fatigue properties in motor units of the cat hindlimb. Brain Res. 327: 203-219. Close R., Hoh I.F.Y. (1968) The after-effects of repetitive stimulation on the isometric twich contraction of rat fast skeletal muscle. J. Physiol. 197: 461-477. Dubose L., Schelhorn T.B., Claman H.P. (1987) Changes in contractile speed of cat motor unts during activity. Muscle Nerve 10: 744-752. Enoka R.M., Rankin L.L., Joyner M.J., Stuart D.G. (1988) Fatigue related changes in neuromuscular excitability of rat hindlib muscles. Muscle Nerve 11: 1123-1 132. Enoka R.M., Rankin L.L., Stuart D.G., Volz K.A. (1989) Fatigability of rat hindlib muscle: associations between electromyogram and force during a fatigue test. J. Physiol. 408: 251- 270. Gardiner P.F., Olha A.E. (1987) Contractile and electromyographic characteristics of rat plantaris motor unit types during fatigue in situ. J. Physiol: 385: 13-34. Grottel K., Celichowski J. (1988) Contraction time and contraction delay of motor units in rat's medial gastrocnemius muscle. Biol. Sport 5: 285-295. Grottel K., Celichowski J. (1990) Division of motor units in medial gastrocnemius muscle of the rat in light of variability of their principal properties. Acta Neurobiol. Exp. 50: 39-55. Grottel K., Celichowski J., Anissimova N. (1990) The course of motor unit twich in dependence on muscle streching force. Studies on medial gastrocnemius muscle of the rat. Acta Neurobiol. Exp. 50: 57-68. Grottel K., Celichowski J., Kowalski K. (1986) Spetial analysis of motor unit potentials of the rat medial gastrocnemius. Acta Physiol. Pol. 37: 219-227. Gydikov A,, Kostov K., Kossev A., Kosarov D. (1984) Estimation of the speeding velocity and the parameters of the muscle potentials by averaging the summated electromyogram. Electromyogr. Clin. Neurophysiol. 24: 191-212. Hanson J. (1974) The effects of repetitive stimulation on the action potential and the twich of rat muscle. Acta Physiol. Scand. 90: 387-400. Hultman E., Sjoholm H. (1983) Electromyogram, force and relaxation time during and after continuous electrical stimulation of human skeletal muscle in situ. J. Physiol. 339: 33-40. Kanda K., Nomoto E., Asaki S. (1985) Physiological and histochemical properties of motor units in the rat medial gastrocnemius muscle. Neurosci. Res. Suppl. 1: S55. Kernell D., Ducati A., Sjoholm H. (1975) Properties of motor unit in the first deep lumbrical muscle of the cat's foot. Brain Res. 98: 37-55. Kernell D., Eerbeek D., Verhey B.A. (1983) Motor unit categorization on basis ofcontractile properties: an experimental analysis of the composition of the cat's m. peroneus longus. Exp. Brain Res. 50: 21 1-219. Khan A.R., Bengtsson B. (1985) Effects of fatigue on electrical responses of frog muscle fibre. Acta Physiol. Scand. 124, Suppl. 542: 324.
Motor unit action potentials in fatigue test Kukulka C.G., Russel A.G., Moore M.A. (1986) Electrical and mechanical changes in human soleus muscle during sustained maximum isoelectric contractions. Brain Res. 362: 47- 54. Lannegran J., Westerblad H. (1987)Action potential fatigue in single skeletal muscle fibres of Xenopus. Acta Physiol. Scand. 129: 311-318. Lindstrom L. Magnusson R., Petersen J. (1979) Muscular fatigue and action potential conduction velocity changes studied with frequency analysis of EMG signals. Elektromyogr. 10: 341-356. Reinking R.M., Stephens J.A., Stuart D.G. (1975)The motor units of cat medial gastrocnemius: problem of their categorization on the basis of mechanical properties. Exp. Brain Res. 23: 301-3 13.
155
Sandercock T.G., Faulkner J.A., Albers J.W., Abrecht P.H. (1985) Single motor unit and fiber action potentials during fatigue. J. Appl. Physiol. 58: 1073-1079. Stilberg E. (1966) Propagation velocity in human muscle fibres in situ. Acta Physiol. Scand. 287, Suppl. 1: 112.
Received 10 M u y 1991, uccepted 3 September 1991