ORIGINAL ARTICLE
European Journal of Cardio-Thoracic Surgery 44 (2013) 104–110 doi:10.1093/ejcts/ezs624 Advance Access publication 23 January 2013
Changes in pulmonary function tests predict radiological response to chemotherapy in malignant pleural mesothelioma† Giuseppe Marullia,*, Francesco Di Chiaraa, Fausto Braccionia, Egle Perissinottoa, Giulia Pasellob, Adolfo G. Favarettob, Cristiano Bredaa and Federico Reaa a b
Department of Cardiothoracic and Vascular Sciences, University of Padua, Padua, Italy Department of Clinical Oncology, Veneto Oncologic Institute, Padua, Italy
* Corresponding author. Department of Cardio-Thoracic and Vascular Sciences, Division of Thoracic Surgery, Padua University Hospital, via Giustiniani, 2-35100 Padova, Italy. Tel: +39-049-8212237; fax: +39-049-8212249; e-mail:
[email protected] (G. Marulli). Received 20 July 2012; received in revised form 17 October 2012; accepted 2 November 2012
Abstract OBJECTIVES: Response to chemotherapy in malignant pleural mesothelioma (MPM) is usually evaluated by radiological criteria, but no common agreement exists on their validity, yet. The cytoreductive effect of chemotherapy on pleural thickening may make the lung more expansible, reducing the restrictive ventilatory impairment. The aim of this study was to evaluate the changes in pulmonary function following chemotherapy in patients with MPM and to correlate these findings with radiological changes. METHODS: Between 2004 and 2011, 62 consecutive patients (74% males, median age 63 years) were prospectively investigated. Modified RECIST criteria were used for radiological evaluation of response to chemotherapy. All patients underwent pulmonary function tests before and after three cycles of platinum-based chemotherapy. Changes between baseline and post-chemotherapy pulmonary function values (Δ) and their differences were assessed by means of Student’s paired and unpaired t-test, respectively. Receiver operating characteristic (ROC) curve analysis was performed on spirometric parameters significantly associated with response. RESULTS: Thirty (48.4%) patients had a radiological stable disease (S), 23 (37.1%) a partial response (R) and 9 (14.5%) a progressive disease (P). ΔFEV1%pred (R: 18.1 ± 18.5%; S: 0.5 ± 9.3%; P: −11 ± 13.5%; P < 0.0001), ΔFVC%pred (R: 16.1 ± 11.8%; S: 0.4 ± 11.2%; P: −9.2 ± 14.6%; P < 0.0001) and ΔVC%pred (R: 12.9 ± 15.7%; S: 1.5 ± 12.1%; P: −6.1 ± 13.2%; P = 0.001) were significantly associated with radiological response. A significant correlation was observed between ΔFEV1%pred (r = 0.46, P = 0.01), ΔFVC%pred (r = 0.43, P = 0.02) and % change in linear tumour measurement. ROC curve analysis using dichotomized radiological response (P/S vs R) as classification variables showed AUC = 0.88 (95%CI: 0.77–0.95) for ΔFEV1%pred (optimal cut-off value: +7%, sensitivity: 83%, specificity: 82%, PPV: 73%, NPV: 89%) and AUC = 0.86 (95%CI: 0.75–0.94) for ΔFVC%pred (optimal cut-off value: +6%, sensitivity: 82%, specificity: 74%, PPV: 64%, NPV: 88%). CONCLUSIONS: Dynamic lung volumes and radiological changes after chemotherapy seem directly related. Lung function changes could be an additional tool to better evaluate the response to chemotherapy in MPM. Keywords: Malignant pleural mesothelioma • Chemotherapy • Pulmonary function test • Radiological assessment
INTRODUCTION Malignant pleural mesothelioma (MPM) is an aggressive tumour associated with poor prognosis. The incidence of MPM is increasing throughout most of the world, and is expected to rise in the next 10–20 years as a result of widespread exposure to asbestos in the past decades [1]. There is no definite standard of care for MPM. Owing to advanced disease at presentation, systemic chemotherapy is the only treatment option for the majority of these patients [2]; in a minority of cases who are eligible for surgery, chemotherapy may be adopted both as adjuvant option [3] or induction therapy [4, 5]. The introduction, in the last † Presented at the 20th European Conference on General Thoracic Surgery, Essen, Germany, 10–13 June 2012.
years, of new active drugs [6] in the treatment of MPM underlined the need for accurate techniques for evaluating response in this disease. The radiological assessment of change in tumour size is actually the standard way to evaluate the efficacy of chemotherapeutic agents in solid tumours such as MPM [7, 8]. Imaging of MPM however, is still challenging for imaging specialists and clinicians due to the anatomical location and unique circumferential and axial growth pattern of this tumour [9]. Multiple thoracic levels may be involved; while there are anatomical landmarks in the upper and mid-thorax, in the lower thorax there are few landmarks where levels of measurement can be reproducibly identified [10]. The presence of simultaneous pleural effusion, atelectasis and chest wall invasion often
© The Author 2013. Published by Oxford University Press on behalf of the European Association for Cardio-Thoracic Surgery. All rights reserved.
G. Marulli et al. / European Journal of Cardio-Thoracic Surgery
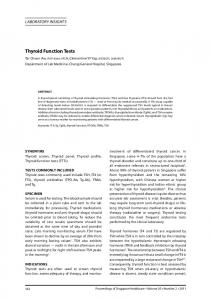
Figure 1: Relative variation (in percentage of the basal value) of respiratory function parameters on the basis of radiological response. DLCO: single-breath carbon monoxide diffusion capacity; FEV1: forced expiratory volume in 1 second; FVC: forced vital capacity; PD: progressive disease; PR: partial response; TLCP: total lung capacity; SD: stable disease; VC: vital capacity.
creates difficulties in distinguishing the tumour from uninvolved adjacent tissue. Furthermore, in early-stage disease, the tumour rind may be difficult to visualize, thus complicating tumour measurements. MPM usually grows around and within the pleural cavity, with concentric thickening and contraction of the pleura, involvement of the interlobar fissures and infiltration of the mediastinum, chest wall and diaphragm. The progressive thickening of the parietal and visceral pleura and the frequent association of pleural effusion determine the incarceration and rigidity of the lung with atelectasis and difficult expansion. Dyspnoea is the most common symptom of the restrictive lung function associated with MPM. Pulmonary function tests (PFTs) are the most commonly used indicators of changes in lung function. To date, few studies have assessed the modifications of respiratory function after chemotherapy in MPM and in particular, the relationship between radiological and functional variations. The aim of this study was to evaluate the effect of chemotherapy on lung function and correlate it with radiological response in patients with MPM.
MATERIALS AND METHODS Between 2004 and 2011, 62 consecutive patients affected by MPM were enrolled in this prospective study at the Department of Cardio-Thoracic and Vascular Sciences, University of Padua, Italy. Table 1 shows the general characteristics of the study
Table 1:
General characteristics of study population
Gender Male Female Age (years) Median (range) Asbestos exposure Yes Occupational Environmental No Smoke Yes No Histotype Epithelioid Sarcomatoid Biphasic Desmoplastic Clinical IMIG stage I II III Performance status (ECOG) 0 1
46 (74.2%) 16 (25.8%) 63 (40–76) 55 (88.7%) 45 (81.8%) 10 (18.2%) 7 (11.3%) 31(50.0%) 31 (50.0%) 56 (90.4%) 2 (3.2%) 2 (3.2%) 2 (3.2%) 3 (4.8%) 17 (27.5%) 42 (67.7%) 40 (64.5%) 22 (35.5%)
population. Inclusion criteria were International Mesothelioma Interest Group (IMIG) [11] clinical stage I–III, patients fit to receive chemotherapy (neoadjuvant in the majority of patients
THORACIC
105
106
G. Marulli et al. / European Journal of Cardio-Thoracic Surgery
scheduled for further surgery or definitive for some patients without a planning for surgery) with an Eastern Cooperative Oncology Group (ECOG) performance status before chemotherapy of 0–1, the absence of significant pleural effusion before and after chemotherapy potentially interfering with radiological evaluation and respiratory function, no significant adverse events during chemotherapy potentially affecting the performance at PFTs, no continuous administration of corticosteroids. All patients were initially characterized by history, clinical evaluation and imaging (chest X-ray, computed tomography (CT) scan). Pleural biopsies, and eventually talc pleurodesis, were performed during video-assisted thoracoscopic surgery (VATS). PFTs were performed in all patients after at least 2 weeks from VATS (in absence of pleural effusion verified by chest CT scan). Chemotherapy regimens consisted of a combination of pemetrexed 500 mg/m2 plus cysplatinum 75 mg/m2 or carboplatinum AUC5 on Day 1 q3 weeks for three cycles: 4 weeks after the last chemotherapy administration, a new CT scan and PFTs were performed at no >2 weeks from each other. Measurements of slow and forced vital capacity (FVC), forced expiratory volume in 1 s (FEV1), total lung capacity (TLC) and single-breath carbon monoxide diffusion capacity (DLCO) were collected using a spirometer (Biomedin, Padova, Italy) with a standardized method [12–14]. Interpretation of the spirometric data was performed following the ERS/ATS Guidelines [15]. The radiological response to treatment was evaluated using the modified RECIST criteria [16] as follows: tumour thickness perpendicular to the chest wall or mediastinum was measured in two positions at three separate levels on transverse cuts of CT scan. The sum of the six measurements defined a pleural unidimensional measure. Transverse cuts at least 1 cm apart and related to anatomical landmarks in the thorax were chosen to allow reproducible assessment at later time points. If measurable tumour was present, transverse cuts in the upper thorax, above the level of division of the main bronchi were preferred. At reassessment, pleural thickness was measured at the same position, at the same level and by the same observer. This was not necessarily the greatest tumour thickness at that level. Nodal, subcutaneous and other bidimensionally measurable lesions were measured unidimensionally as per the RECIST criteria. Unidimensional measurements were added to obtain the total tumour measurement. Complete response was defined as the disappearance of all target lesions with no evidence of tumour elsewhere, and partial response was defined as at least a 30% reduction in the total tumour measurement. Progressive disease was defined as an increase of at least 20% in the total tumour measurement over the nadir measurement, or the appearance of one or more new lesions. Patients with stable disease were those who fulfilled the criteria for neither partial response nor progressive disease. All tumour response evaluations were conducted in one single institution (University of Padova) by using a Siemens Volume Zoom multidetector Spiral CT scan with 5-mm slices. The dimensions of the target lesions were obtained by means of computer-generated measurements by a single observer. Informed consent was obtained, and the study was approved by our Institutional Ethics Committee on Human Research.
Statistical methods Descriptive analyses were performed on quantitative and qualitative variables for the total sample. Quantitative variables were
reported as mean values ± standard deviations for baseline and follow-up assessments, while for binary or categorical responses, the proportion of events was expressed as percentage. The normality of quantitative variables distribution was verified by means of the Shapiro–Wilk test. The difference of variables before and after chemotherapy was expressed as absolute value (follow-up value – basal value) and relative ratio (with reference to basal value). Mean values of differences with 95% confidence intervals (95% CI) were also performed, on the total sample and by response group. Changes between basal and follow-up values were assessed by means of Student’s paired t-test. Difference in change of respiratory function based on radiological response ( partial response, stable disease and progressive disease) was tested by means of analysis of variance (ANOVA) for unbalanced data. Linear logistic regression analysis was adopted to verify the association between radiological response and functional variations. For respiratory variables with changes significantly associated with response, the receiver operating characteristic (ROC) curve analysis was performed using dichotomized response (stable disease and progressive disease = 0, partial response = 1). The area under the curve (AUC) was estimated with 95% CI, the best predictive value was estimated for each variable and sensitivity, and specificity positive and negative predictive values were computed for each cut-off. Statistical significance of difference between AUCs was also estimated. For each test, a two-tailed P-value lower than 0.05 was considered statistically significant. Statistical analyses were performed using the SAS rel. 9.13 (SAS Institute, Cary, NC, USA).
RESULTS Thirty-two (51.6%) patients received three cycles of carboplatin and pemetrexed, and 30 (48.4%) patients received three cycles of cysplatinum and pemetrexed. Twenty-three (37.1%) patients had an partial response to chemotherapy, 30 (48.4%) had an stable disease and 9 (14.5%) had a progressive disease. No difference was found when comparing the two treatment protocols in terms of radiological response to treatment. Before chemotherapy, 43 (69.4%) patients had a restrictive ventilatory deficit, 5 (8%) patients had a mixed restrictive and obstructive ventilatory deficit and 14 (22.6%) had a normal spirometry. In Table 2, the
Table 2: Lung function parameters evaluated on overall patients before and after chemotherapy Parameters VC (l) VC (% pred) FVC (l) FVC (% pred) FEV1 (l) FEV1 (% pred) TLC (l) TLC (% pred) DLCO (ml/min/mmHg) DLCO (% pred)
Pre-chemotherapy Post-chemotherapy P 2.73 ± 0.66 75.44 ± 14.01 2.59 ± 0.65 73.84 ± 13.85 2.09 ± 0.51 74.61 ± 14.37 4.70 ± 0.95 77.22 ± 12.66 17.98 ± 4.59 61.65 ± 15.14
2.83 ± 0.67 77.17 ± 18.95 2.69 ± 0.66 76.86 ± 16.05 2.17 ± 0.52 77.91 ± 16.41 4.90 ± 0.93 80.69 ± 12.92 18.02 ± 5.45 61.68 ± 21.28
0.04 0.04 0.05 0.03 0.04 0.02 0.05 0.04 0.58 0.95
DLCO: single-breath carbon monoxide diffusion capacity; FEV1: forced expiratory volume in 1 second; FVC: forced vital capacity; TLC: total lung capacity; VC: vital capacity.
comparison between the pulmonary function parameters before and after chemotherapy is reported: a significant increase in the percentage of predicted FEV1, VC, FVC and TLC was observed in the overall study population. The stratified analysis by radiological response to chemotherapy in all variables showed a significant improvement in FEV1, FVC and VC (both absolute and percentage of predicted values) only in subjects with an partial response, while the respiratory function remained unchanged in patients with stable disease and worsened in patients with progressive disease. These results were found when we analysed both the absolute difference in mean values (Table 3) and the relative difference (in percentage) compared with the basal value (Fig. 1). The linear logistic regression analysis showed a direct correlation between the ΔFEV1% and the Δ% in total tumour measurement (r = 0.46, P = 0.01) and between the ΔFVC% and the Δ% in total tumour measurement (r = 0.43, P = 0.02). Results from ROC curve analysis are reported in Fig. 2: by dichotomization of radiological response ( partial response vs stable disease and progressive disease), a cut-off of +7% ΔFEV1 for responders best predicted the higher area under the curve (AUC: 0.88, 95% CI: 0.77–0.95; sensitivity: 0.83, specificity: 0.82), the optimal cut-off for ΔFVC was +6% (AUC: 0.86, 95% CI: 0.75–0.94; sensitivity: 0.82, specificity: 0.74) and for ΔVC it was +3% (AUC: 0.76, 95% CI: 0.64–0.86; sensitivity: 0.73, specificity: 0.74).
DISCUSSION MPM is an aggressive and fatal tumour of the pleural layers for which few therapeutic options are available. Chemotherapy is considered the main treatment for the majority of patients who are diagnosed with advanced disease, or in case of early disease, it may be adopted as inductive or adjuvant modality in association with surgery. The development in the last years of more effective chemotherapy regimens [6] that improve symptoms and prolong survival has renewed interest in the methods for the assessment of the response to chemotherapy in MPM. Contrast-enhanced CT is the primary imaging technique for the evaluation of MPM and plays a critical role in diagnosis, prognostication, prediction and measurement of response to therapy and monitoring of disease recurrence after aggressive surgical management [17]. The assessment of response to chemotherapy treatment with criteria based on CT measurements is challenging in MPM, due to its pattern of growth, and several radiological response systems have been proposed over the years [10, 17]. In 1981, the World Health Organization (WHO) established a first proposal of tumour response assessment based on measurement of bidimensional lesions by CT scans before and after chemotherapy [18]. These criteria were poorly suited to the specific pattern of growth of MPM. Later, the Response Evaluation Criteria in Solid Tumours (RECIST) [19] guidelines adopted a unidimensional tumour measurement technique of the longest diameter of the lesions. The corresponding response criteria defined the partial response as a ≥30% decrease in the sum of the unidimensional measurements of lesions on serial CT scans and defined progression of disease as a ≥20% increase in the summed unidimensional measurements. Recently, Byrne and Nowak [16], validated an alternative unidimensional measurement technique on 73 patients affected by MPM and treated with chemotherapy. This ‘modified RECIST’ technique provided tumour thickness measurement perpendicular to the chest wall or mediastinum (i.e.
107
short-axis dimension instead of long-axis diameter) in two positions at three separate levels on transverse CT slices. The same response criteria as RECIST were used and the response according to these modified RECIST criteria predicted longer patient survival and improved respiratory function, with an increase of forced vital capacity during treatment. Although modified RECIST criteria are being used in most current trials, several criticisms have been raised on their clinical applicability based on the high grade of inter-observer variability [20, 21]. In our study, a single observer evaluated all the CT scans pre- and postchemotherapy, undertaking all measures and thus avoiding this possible bias. While radiological tumour response and progression directly reflect changes in tumour bulk, they are most clinically useful when they relate closely to other measures of a patient’s condition. Patient benefit in MPM may include an improvement in survival or lung function, and improvement in symptom control or quality of life. Thus, it is important that any valid measurement of response should reflect changes in these parameters. MPM is a highly symptomatic malignancy, and dyspnoea is one of the most common symptoms. The pleural mass and thickening in MPM usually determine compression and atelectasis of the lung, making the lung stiffer. Moreover, pleural tumour mass can reduce the expansion of the chest cage and diaphragm impairing the strength of the respiratory muscles. All these alterations can impair the respiratory mechanics, reducing the efficacy of the ventilatory pump and determining a restrictive or mixed respiratory impairment. PFTs are the most reliable indicators of changes in lung function and may indirectly add information about the effectiveness of treatments. We hypothesized that, in MPM patients, the reduction of pleural mass and thickening by chemotherapy may improve the efficiency of the ventilatory pump, thus leading to improvement of lung function performance. Some studies have demonstrated that patients with lung cancer receiving platinum-based chemotherapy have favourable effects in spirometric performance with an increase in FEV1 and FVC, probably by ameliorating bronchial obstruction caused by tumour extension [22]. Few studies have evaluated the variation of respiratory function after chemotherapy in patients with MPM. In a previous preliminary study on patients submitted to induction chemotherapy for MPM, we observed an overall improvement in lung function parameters and exercise capacity [23]. We suggested that the improvement in lung volumes is directly related to a cytoreductive effect of chemotherapy on the tumour mass, giving the lung more expansibility and reducing the restrictive ventilatory impairment. When we considered the relationship between the radiological response to chemotherapy and the variation in lung volumes, the stratified analysis showed a significant improvement in FEV1, FVC and VC only in subjects with a partial response, supporting our hypothesis. A similar result has been described by Byrne and Novak [24], who observed a significant and progressive (at each cycle of chemotherapy) increase in FVC in those patients with partial response to chemotherapy. Paoletti et al. [24] reported on changes in several functional parameters (VC, FVC and FEV1) in patients treated in the phase III study of pemetrexed/cisplatin vs cisplatin. Responders in both treatment groups had a significant improvement in PFTs in comparison with patients with stable disease; in addition, patients with stable disease had better PFTs than those with progressive disease. This result may be clinically relevant because patients with no objective tumour response can have symptomatic improvement. A similar finding was observed in our study where the changes in FEV1, FVC and VC were
THORACIC
G. Marulli et al. / European Journal of Cardio-Thoracic Surgery
108
G. Marulli et al. / European Journal of Cardio-Thoracic Surgery
Table 3: Difference (absolute value) of respiratory function parameters before and after chemotherapy on the basis of radiological response Parameters VC (l) VC (% pred) FVC (l) FVC (% pred) FEV1 (l) FEV1 (% pred) TLC (l) TLC (% pred) DLCO (ml/min/mmHg) DLCO (% pred)
partial response
stable disease
progressive disease
0.34 ± 0.38 9.11 ± 11.02 0.35 ± 0.22 11.17 ± 8.21 0.31 ± 0.24 12.04 ± 10.01 0.42 ± 0.74 6.70 ± 11.96 1.19 ± 3.82 5.04 ± 16.03
0.01 ± 0.34 0.71 ± 9.41 −0.006 ± 0.31 −0.007 ± 8.59 −0.001 ± 0.22 −0.006 ± 7.43 0.09 ± 0.72 1.75 ± 11.18 0.31 ± 5.04 0.88 ± 18.77
−0.16 ± 0.35 −4.38 ± 8.27 −0.23 ± 0.35 −6.77 ± 9.07 −0.23 ± 0.29 −8.03 ± 9.03 −0.06 ± 1.01 −0.71 ± 16.08 −1.77 ± 4.72 −6.30 ± 19.70
P 0.0006 0.001