Geoderma 163 (2011) 283–290
Contents lists available at ScienceDirect
Geoderma j o u r n a l h o m e p a g e : w w w. e l s ev i e r. c o m / l o c a t e / g e o d e r m a
Changes in soil structure following passage of a tracked heavy machine A. Alaoui a,⁎, E. Diserens b a b
Hydrology Group, Department of Geography, University of Bern, Hallerstrasse 12, 3012 Bern, Switzerland Agroscope Reckenholz-Tänikon ART Research Station, CH-8356 Ettenhausen, Switzerland
a r t i c l e
i n f o
Article history: Received 22 December 2009 Received in revised form 27 April 2011 Accepted 28 April 2011 Available online 26 May 2011 Keywords: Golf course construction Tracked heavy machine Physical approach Hydraulic approach
a b s t r a c t Golf course construction with a tracked heavy machine (scrapedozer) involves soil treatment with a high risk of compaction, especially when the machine drives directly on subsoil. The aims of this study were i) to use a coupled physical and hydraulic approach to better evaluate the effect of soil deformation on soil structure, parameterized as bulk density (BD); penetration resistance (PR); pore size distribution (PSD), Brilliant Blue (BB) tracer distribution and infiltration capacity, following passage of the scrapedozer during golf course construction, ii) to evaluate the effect of initial soil conditions on changes in soil structure and iii) to provide comprehensive recommendations on the use of such heavy machines in golf construction operations. Special attention was paid to subsoil below 0.30 m since the topsoil layer is normally reconstructed after scraping. The compaction effect was more evident on wet trafficked plot, as clearly confirmed by the results of BD, PR and PSD (decrease of mesopores) while less pronounced effect was observed in moderately dry soil (MD) as shown by the PR and BB. The non-significant decrease in macropores on both plots between 0.30 and 0.40 m, on the one hand, and the discrepancy between BD and PR in indicating soil compaction for same soil layers on the other hand, can be attributed to the heterogeneity and/or to the cracking effect, depending on initial water content. In fact, soil cracking was observed in MD and may be attributed to the existence of microcracks visible at the soil surface which promote cracking at deeper levels. Although there was a notable increase in the PR in the topsoil at depths between 0 and 0.10 m for both trafficked plots, no significant increase was shown at this depth. This result may be attributed to the steel tracks that help to loosen the topsoil layer and consequently to diminish the effect of soil compaction. Based on the observed structural deterioration, the use of a lighter machine is recommended under wet soil conditions and also when the topsoil is scraped. © 2011 Elsevier B.V. All rights reserved.
1. Introduction Soil compaction has been recognized as a serious problem in mechanized agriculture and has an influence on many soil properties and processes (Koolen, 1974; Koolen and Vaandrager, 1984; Shafiq et al., 1994; Unger, 1996) as well as on crop yield (Arvidsson and Håkansson, 1996; Håkansson and Reeder, 1994; Shafer and Johnson, 1990, Soane and Van Ouwerkerk, 1995). To improve soil management and land use, it is necessary to evaluate the impact of soil compaction on soil structure. To date, a number of different parameters have been used for this purpose. The most common of these are bulk density, BD and total porosity, TP (Boone, 1988; da Silva et al., 1994), macroporosity (Alakukku, 1996), penetration resistance, PR (Pagliai, 1998), air permeability (Ball, 1981), saturated hydraulic conductivity (Alakukku, 1996), preconsolidation pressure (Horn, 1981), dye surface density (Alaoui and Goetz, 2008; Alaoui and Helbling, 2006; Kulli et al., 2003) and infiltration capacity (Alaoui and Helbling, 2006). Among these
⁎ Corresponding author. Tel.: + 41 31 6318557; fax: + 41 31 6318511. E-mail address:
[email protected] (A. Alaoui). 0016-7061/$ – see front matter © 2011 Elsevier B.V. All rights reserved. doi:10.1016/j.geoderma.2011.04.023
parameters, BD and TP are frequently used to evaluate soil compaction. However, for accurate assessment of changes in soil structure due to compaction, measurements of BD and TP are not sufficient (Dexter, 1997; Horn and Rostek, 2000; McQueen and Shepherd, 2002). In fact, heavy machine traffic does not always imply a significant modification of TP. PR is a useful measure of soil impedance to root growth (Bengough and Mullins, 1990). Since measurements of PR are relatively rapid they are suitable in detecting strength and structural discontinuities associated with wheel tracks and size of structural units (Lowery and Morrison, 2002). Kiliç et al. (2004) reported that PR was the most variable soil property, with regard to BD that was the lowest variable in their clayey loamy and loamy soils and that the majority of soil properties showed considerable spatial variability at small distances at 0.15–0.30 m depths. Lipiec and Hatano (2003) reported that one of the drawbacks of PR is its wide spatial variation because it is a point measurement rather than a bulk soil measurement. These parameters (BD/TP and PR) do not reflect the connectivity of pores, which is very important in determining the hydraulic conductivity function. From this perspective, investigation of the hydrodynamic change in soil water content in response to simulated rainfall offers invaluable additional information.
284
A. Alaoui, E. Diserens / Geoderma 163 (2011) 283–290
There are few studies dealing with soil compaction under tracked vehicles in general (e.g. Gassman et al., 1989; Karafiath, 1984) and for agricultural (e.g., Blunden et al., 1994; Keller et al., 2002; Kirby et al., 1997; Marsili and Servadio, 1996; Rusanov, 1991) and construction applications in particular (e.g. Berli et al., 2003; Berli et al., 2004). Golf course construction, especially with the scrapedozer, involves soil treatment with a high risk of compaction that has not previously been studied, especially because the scrapedozer drives directly on subsoil when soil is scraped off. Special attention has to be paid to subsoil since the topsoil layer is normally reconstructed after scraping. Dumbeck (1984) carried out traffic experiments on arable land with heavy excavators (weighing up to 47 mg, mean stress in the contact area up to 100 kPa) under dry (−300 to − 1000 hPa soil water potential) and wet (≈−60 hPa soil water potential) soil conditions. He found a decrease in the amount of macropores down to 0.65 m in the dry soil and to 1 m in the wet soil. The aims of this study were i) to use a coupled physical and hydraulic approach to better evaluate the effect of soil deformation especially in subsoil structure, parameterized as BD, PR, pore size distribution (PSD), Brilliant Blue (BB) tracer distribution and infiltration capacity, following passage of a tracked heavy machine (scrapedozer) during golf course construction, ii) to evaluate the effect of initial soil conditions on changes in soil structure and iii) to provide comprehensive recommendations on the use of such heavy machines in golf construction operations.
to 7 below 0.40 m. Two wetness statuses caused by the weather conditions were considered in this study: wet (W) and moderately dry (MD) corresponding to topsoil suctions of 62.5 and 88.3 hPa, respectively at 0.15 m (Table 2). The traffic was on the soil surface at 0 m and the two plots were subject to four passes. Topsoil corresponding to the plow layer was localized between 0 and about 0.25 m. The measurements of soil parameters were focused on subsoil between 0.30 and 0.40 m since the topsoil layer is scraped and reconstructed after the passage of the machine. The technical characteristics of the tracked vehicle are listed in Fig. 1. 2.2. Laboratory analysis BD and PSD were determined on samples (five per depth) of undisturbed soil with a diameter of 55 mm and height of 42 mm. The PSD was determined by a vacuum pressure membrane apparatus described by Dirksen (1999) with a hanging water column for a water suction h b 31.6 kPa and with a gas adsorption porosimetry using N2 for 31.6 kPa b h b 1585 kPa. BD and PSD were taken between 0.30 and 0.40 m depth. The samples were taken about 0.15 m apart in a horizontal direction. In this study, four pore classes were defined: i) wide macropores as the pores larger than 50 μm; ii) narrow macropores are between 30 and 50 μm; iii) mesopores are between 0.2 and 30 μm and iv) micropores are defined to be smaller than 0.2 μm. In this study, compaction effect will be considered using average pore size (APS) for each class of pores.
2. Material and methods 2.3. In-situ field experiments 2.1. Location and soil description The golf course to be constructed is located in Oberkirch, close to Sursee in the canton of Lucerne (Swiss topo coordinates: 222 675/ 650 675, Sheet 1129, 1:25 000, Sursee). Oberkirch is in the Swiss Midlands. The nearest weather stations are in Wynau (25 km to the north) and Lucerne (18 km to the south). The mean annual temperature lies between 9.2 °C (Wynau) and 9.8 °C (Lucerne), and total annual precipitation ranges from 1092 mm (Wynau) to 1215 mm (Lucerne). The estimated average vegetation period is 190 to 210 days per year, and the region around the golf course is classified as a “moderately wet zone” (no marked tendency to aridity or wetness). The soil is described as slightly pseudogleyed brown earth (stagnic Cambisol). Its texture consists of loam to a depth of 0.60 m and sandy silt below 0.60 m (data from the control plot, Table 1). Its organic carbon content (determined by weight loss on ignition) varies from 0.6% (topsoil) to 0.1% (subsoil). A pH of 5.6 was measured near the soil surface. The value slowly increased Table 1 Texture, organic carbon and pH of Oberkirch soil. Depth interval (m)
Particle size distribution (%)
Texture
Organic carbon OC (%)
pH
Clay (b 2 μm)
Silt (2–60 μm)
Sand (N 60 μm)
Control plot 0.00–0.15 0.30–0.40 0.40–0.60 0.60–1.00
20.0 22.6 15.5 13.5
40.0 39.5 42.8 51.2
40.0 37.9 41.7 35.3
Loam Loam Loam Silt loam
0.6 0.4 0.1 0.1
5.6 5.9 7.1 6.7
Wet (W) 0.10–0.15 0.30–0.35 N 0.35
20.0 22.4 n.a.
39.6 39.6 n.a.
40.4 38.0 n.a.
Loam Loam n.a.
0.5 0.4 n.a.
5.6 6.0 n.a.
Moderately dry (MD) 0.10–0.15 17.9 0.30–0.35 18.5 N 0.35 n.a.
36.9 35.5 n.a.
45.2 46.0 n.a.
Loam Loam n.a.
0.4 0.4 n.a.
5.6 5.9 n.a.
Textural classification was according to the USDA soil taxonomy; n.a.:not available.
2.3.1. Penetration resistance The penetration resistance (PR) was measured with a penetrologger set (Eijkelkamp, Giesbeek, The Netherlands) consisting of a penetrologger, a force sensor, a two-part probing rod, a cone with a crosssectional area of 1 x 10− 4 m 2, a depth reference plate at soil surface, a communication port and a GPS antenna. The cone is pushed slowly and regularly into the soil. The measured resistance to penetration and the GPS coordinates are stored in the internal logger of the penetrologger. The depth and the force resolutions are 0.01 m and 1 N respectively. PR was measured in W and MD. In each plot, PR was measured five times within a radius of 0.50 m down to a depth of 0.60 m. The five vertical measurements were averaged for each depth layer and the trafficked and the control plots were statistically compared. 2.3.2. Infiltration experiments From a pit, 1 m deep, four water content probes were horizontally installed under both multiple pass plots (under wet and moderately dry soil conditions) and the control plot (Alaoui and Eugster, 2004). The three plots were successively irrigated twice (5.05.2006 for the control plot, 6.05.2006 for W and 7.05.2006 for MD) with a rainfall simulator of 1 m2 area with intensities of 24 mm h− 1 for 1 h. The time interval between the two infiltration experiments was about 24 h. Water content was measured at the four depths of 0.20, 0.40, 0.50 and 0.70 m with Time Domain Reflectrometer (TDR) (CR10X & TDR100, Campbell Table 2 Overview on the experimental treatments. Soil conditions
Wet
Moderately dry
Soil plots Scrapedozer status Number of passes Traffic on Date of trafficking Depth (m) 0.15 0.35 0.55
W Loaded 4 Soil surface (0.00 m) 03.05.2006 Initial suction (hPa) 62.50 65.25 67.00
MD Loaded 4 Soil surface (0.00 m) 09.06.2006 Initial suction (hPa) 88.25 92.50 79.25
A. Alaoui, E. Diserens / Geoderma 163 (2011) 283–290
285
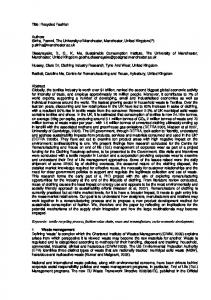
Fig. 1. Scrapedozer SR 1030 used in this study and its technical data.
Scientific Inc.), with 0.20 m wave guides (two parallel rods of 6 mm diameter). Calibration was performed according to Roth et al. (1990). The precision of the volumetric water content (θ) was assessed when flow had ceased, i.e. when a linear regression of θ(t) no longer showed a significant temporal trend. The standard errors sθ of various sets of 30 water content readings, collected during this study and previous ones, never exceeded 0.015 m3 m − 3. The instrument noise was thus set at dθ = 0.018 m 3 m− 3, and any variation in θ–measured using wave guides–that exceeded ± dθ was considered significant (Alaoui and Goetz, 2008). TDR measurements were made every 300 s. The results obtained will be analyzed according to the increase in θ during water infiltration (Δθi, defined as the difference between maximum water content and initial water content) and the decrease in θ after cessation of infiltration during the drainage phase (Δθd, defined as the difference between maximum water content and the lowest water content measured within 2 h after that the maximum water content was reached) (Alaoui and Helbling, 2006). Low values of Δθd will indicate the draining of fine pores, whereas high ones indicate the draining of larger pores such as macropores or cracks and indicate preferential flow (Alaoui et al., 2003). Zero values indicate that water is retained by capillarity and exclude preferential flow. 2.3.3. Dye tracer experiments A dye infiltration experiment was carried out in MD in order to visualize the heterogeneity of the tracer distribution pathways. In this perspective, 120 L of dye tracer solution were prepared by diluting 440 g of Brilliant Blue FCF powder, also known as food-dye E133 (Flury and Flühler, 1995), in ordinary tap water (concentration = 3.7 g L − 1). On 17th July 2006, 120 L of the prepared solution was applied to the soil surface of the control plot (Alaoui and Goetz, 2008) and on 24th July 2006 in moderately dry soil (multiple passes) for 3 h at a constant rate of 24 mm h − 1 using a rainfall simulator of 1 m 2 area. Being neutral or anionic (depending on the pH), Brilliant Blue (BB) is not heavily adsorbed by negatively charged soil constituents. One day after infiltration, a soil pit was excavated and six vertical profiles (0, 0.20, 0.40, 0.60, 0.80 and 1 m) were prepared. A rubber string grid (1.0 x 0.7 m) was attached in front of each profile. These profiles were then photographed with a digital camera (hp photosmart 945; resolution: 5 Mega pixels). The digitized 1 by 0.70 m cross section grid contained 70 squares. The resultant digital images have a resolution of approximately 2000 x 2000 pixels. 2.4. Image analysis and optical calibration The final coverage of the stained areas was subsequently determined from profile images according to the following descrip-
tion. The pictures were processed with the Photoshop CS2© image editing program following the procedure described by Alaoui and Goetz (2008). The saturation of the blue stains was maximized resulting in three colors (yellow, green and blue) and two tinges (light and dark blue). The brown color of the unstained soil areas was then removed. After that, it was easy to reduce the number of allowed colors; as a result, only the four BB related tints remained in the image. These colors were separated by cropping them one after the other and then pasting them into individual JPG files. By converting these pictures into grayscale images and applying tone value corrections, the tainted areas turned black, while the rest stayed white. The resulting patterns were then cut into 30 to 35 horizontal strips. Each profile had a surface of 0.70 m 2, but because these profiles had to be cut into strips only 2.33 x 10 − 2 m 2 could be examined at a time. The distribution of the dye coverage with depth was calculated for each image, by horizontally counting the pixels indicating stained soil for every pixel row of the image. In order to allow a quantitative insight with different BB concentrations, a calibration, linking specific colors with corresponding BB concentration ranges, had to be carried out. Ten standard solutions were therefore prepared (BB concentration: 0.1, 0.5, 1, 2, 4, 6, 20, 40, 80 and 150 g L − 1) and the soil samples were saturated therein for five to six days. After letting them dry for a couple of nights, about three millimeters of the bottom surface of each sample had to be scratched off with a knife, in order to obtain smooth and homogenous surfaces. These were then photographed with the same camera, under the same light conditions as in the field. To compare the multiple pass plots with the control plot, the mean concentration of all six vertical profiles of each plot was calculated for each concentration class and each depth layer. The surface density of BB was then estimated to a depth of 0.70 m in both control and MD plots. 3. Results and discussion A heterogeneous structure in non-destructed (structured) soil creates generally suitable conditions for its transmitting, exchange and agronomic functions. Changes in the structure due to deformation can affect soil functions extensively, depending on compaction type. In this study, we consider trafficking effect as a result of compaction and/or loosening. Compaction is considered when BD and PR increase and APS (macropores/mesopores), infiltration capacity and dye coverage decrease, whereas loosening is considered if the inverse phenomenon occurs. The data of initial suction before the start of the experiments indicated homogeneous distribution of soil water content throughout soil profiles of both wet and moderately dry plots (Table 2). This fact
286
A. Alaoui, E. Diserens / Geoderma 163 (2011) 283–290
Fig. 2. Bulk density (median values) for A) wet soil, W and B) moderately dry soil, MD as compared to control plot; s.: significant (95%), n.s.: not significant (95%).
shows that the PR measurements were not influenced by the difference in water content of the soil horizons.
different soil attributes (BD, water content, organic matter and texture) at the same spatial location (Vaz et al., 2001).
3.1. Bulk density and penetration resistance
3.2. Infiltration experiments
According to the statistical analysis, BD is significantly higher on the trafficked plot W compared to the control plot and reaches a value of 1.59 g/m 3. These results show a severe trafficking effect between 0.30 and 0.40 m in W, whereas no differences were recorded between the moderately dry topsoil MD and the control plot (Fig. 2). PR analyses show that the most important trafficking effects were observed between 0.10 and 0.30 m in W and between 0.10 and 0.20 m in MD (Fig. 3). Although there was a notable increase in the PR in the topsoil between 0 and 0.10 m for both trafficked plots, no significant increase was noted at this depth. This result may be attributed to the steel tracks that help to loosen the topsoil layer and consequently to diminish the effect of soil compaction. In wet plot W, a tendency for an inverse phenomenon occurred between 0.30 and 0.40 m showing a looser soil layer which contradicts the results of BD for same soil layer. It is known that PR is a highly variable soil property since it is usually determined from local smallscale measurements. Hence, difficulties in relating PR to other soil parameters can be attributed mostly to soil spatial variability, because available measurement techniques prevent determination of the
Fig. 4 shows water content evolution on A) the control plot, B) in the W, and C) in MD plot. The control plot exhibits a significant increase in water content at a depth of 0.25 m during the first run, showing that water flows at this depth. Similarly, in W, a significant increase of water content is observed only at 0.25 m depth showing similar behavior as the control plot. In comparison, MD shows a significant increase at 0.35 m depth and has a different reaction by comparison with W in terms of frequency (significant Δθi at 0.25 and 0.35 m depths and during both infiltrations) and magnitude (high values of Δθd). In fact, in MD the water content dropped drastically after rainfall ceased, as is characteristic of rapid flow (Thomas and Phillips, 1979), confirming aeration of the soil during drainage of both infiltrations I and II. The decrease in water content Δθd after cessation of infiltration was 0.6% at a depth of 0.25 m and 5.6% at a depth 0.35 m and may reflect the rapid aeration of cracks probably due to soil cracking. On the control plot, measured Δθd during run 1 was 0.4% at a depth of 0.25 m. This did not occur in wet soil W, in which Δθd was 0% throughout the soil profile excluding any rapid flow (Alaoui et al., 2003). This fact may confirm the compaction effect up to 0.25 m in W.
Fig. 3. Penetration resistance measured in A) wet soil, W and B) moderately dry soil, MD; s.: significant (95%), n.s.: not significant (95%).
A. Alaoui, E. Diserens / Geoderma 163 (2011) 283–290
287
Fig. 4. Infiltration experiments in the control plot (A), in wet soil, W (B) and in moderately dry soil, MD (C); Water content (m3 m− 3) vs. time (s).
Fig. 5. Surface density of the Brilliant Blue (%) vs. depth in the control plot and multiple passes plot; for A) total concentration, B) concentration class between 0.1 and 0.5 g/L and C) concentration class between 0.5 and 4 g/L; s.: significant (95%), n.s.: not significant (95%).
288
A. Alaoui, E. Diserens / Geoderma 163 (2011) 283–290
In view of these results, the infiltration experiments clearly show the trafficking effect in W and in MD in a different way.
images alone because the concentration classes were not linked to the pore sizes. 3.4. Pore size distribution
3.3. Dye tracer experiments Because of the large area of soil investigated, the dye tracer images obtained give a more general view of the change in soil structure that made the heterogeneous tracer distributions visual for each excavated section. The tracer penetrated deeply into the matrix, covering a range of a given pore volume class. Any change in soil structure due to loading will alter the ratio between the different BB concentration ranges. When considering total concentration (cumulated concentrations of all classes) (Fig. 5A), a decrease of about 38% in the topsoil between 0 and 0.28 m and of about 5% between 0.28 and 0.44 m was observed in the trafficked plot MD by comparison with the control plot, showing evident soil compaction to this depth. When considering the concentration classes separately, the surface density of the concentration class between 0.1 and 0.5 g L − 1 increased significantly in MD between depths of 0 and 0.28 m (Fig. 5B) due probably to the high diffusion of the tracer in compacted soil. In contrast, the surface density of the concentration class between 0.5 and 4 g L − 1 decreased significantly between depths of 0 and 0.35 m (Fig. 5C) showing evident trafficking effect (compaction and or loosening) to this depth. Fig. 6A shows a dense stained surface between 0 and 0.28 m on the control plot, which was notably reduced in MD due to compaction (Fig. 6B). Below this depth, more localized preferential pathways with very limited lateral exchange with the matrix are visible in MD compared to the control plot. Kulli et al. (2003) attributed such preferential pathways to the presence of local ponding on the dense compacted topsoil layer, which enhances preferential flow in the compacted plots. The authors did not interpret the preferential pathways as a direct consequence of compaction (or cracking), as they have no specific measurements to confirm this. From Fig. 4C it is obvious that preferential pathways exist even after loading. However, the nature of these relict voids cannot be shown from the tracer
A comparison of the topsoil of W with the control plot showed that total porosity was reduced by about 2.6% (from 43.8 to 41.2%). In fact, in addition to the significant reduction in mesopores, the non-significant decrease in macropore volume (Fig. 7A) should contribute to reducing total porosity. The only clear compaction which was likely due to the trafficking was reflected in the significant reduction in mesopores in W. A similar reduction in macropores was likely on the same plot but the evidence was less consistent. In order to clearly state the change in PSD, it would be necessary to measure this parameter in the topsoil between 0 and 0.25 m, since the measurements were performed below the plow layer. The absence of a significant reduction in macropore volume between 0.30 and 0.40 m of both trafficked plots on the one hand, and the discrepancies in the results between BD and PR in indicating compaction effect for same soil layers on the other hand (Fig. 8), may be due to the following facts: i) Minor effects have been concealed by the rather wide scatter of the measured values, which was primarily due to a high degree of short-range spatial variability in these parameters. Similar observations were made by Berli et al. (2004). The authors performed experiments with heavy machines (25 mg to 38 mg weight) at three different test sites under “Wet” and “Dry” soil conditions. Their BD data showed that the only clear compaction, which was likely due to the trafficking, occurred at one site under wet soil conditions in topsoil up to a depth of 0.37 m. They attributed the lack of significant and consistent compaction effects on topsoil on the other trafficked plots to the spatial variability of soil properties and to the heterogeneous distribution of the pressure beneath the track (Berli et al., 2004). ii) Direct observation of the appearance of cracks (Fig. 9) due to the trafficking permits us to assume an additional cracking process that may counterpoise the compaction effect and conceals the
Fig. 6. 2D-Tracer distribution (vertical sections) in A) control plot and B) moderately dry soil (MD).
A. Alaoui, E. Diserens / Geoderma 163 (2011) 283–290
289
Depth: 0.30 - 0.40 m
Fig. 7. Pore size distribution (PSD) in A) wet soil (W) and B) moderately dry soil (MD) vs. control plots; s.: significant (95%), n.s.: not significant (95%); wide macropores are defined as the pores larger than 50 μm, narrow macropores are between 30 and 50 μm, mesopores are between 0.2 and 30 μm and micropores are smaller than 0.2 μm.
total disappearance of macropores. The cracking effect was more pronounced in dry soil, as observed from the rapid decrease in water content during drainage, as is typical of the aeration of cracks or large pores. In fact, micro-cracks were observed at the soil surface of the control plot under dry soil conditions and may promote cracking at greater depths. The BB image analysis showed similar behavior reflected by the change in the ratio between the different concentration classes (Figs. 5 and 8), which cannot be directly attributed to a given size of voids or cracks but reflects a change in soil structure.
Fig. 8. Synthesis of results.
In view of the results presented in Fig. 8, the heterogeneity may be a more probable cause of the non-significant reduction of macropore volume in W, whereas the cracking effect can be viewed as a more probable one in MD. Given that the passage of the machine exceeds the four passes considered in this study, the compaction effect could be more extensive and deeper than that was observed in our case. 4. Conclusions The aims of this study were: i) to evaluate the effect of soil deformation on soil structure, ii) to evaluate the effect of initial soil conditions on the changes in soil structure and iii) to provide comprehensive recommendations on the use of such heavy machines in golf construction operations. This study shows that the effect of soil compaction was more evident on wet trafficked plot W, as clearly confirmed by the results of bulk density, BD (0.30–0.40 m), penetration resistance, PR (0.10– 0.30 m) and pore size distribution, PSD (0.30–0.40 m). In comparison, a less pronounced effect was shown in the moderately dry soil MD as shown from the PR and BB. The analysis of BD and PSD did not show evident compaction in this case, even after four passes. In addition to the non significant decrease in macropores in both plots, BD and PR did not indicate soil compaction for same soil layers. These unexpected results can be attributed to the heterogeneity and/ or to cracking effect depending on initial water content. Further investigations are needed to confirm this. Attributing a pore size value
Fig. 9. Illustration of cracks in moderately dry soil (MD) following the passage of the machine from left to right.
290
A. Alaoui, E. Diserens / Geoderma 163 (2011) 283–290
(derived from PSD analysis) to each concentration class (derived from surface density of Brilliant Blue) using appropriate calibration would give more quantitative insight into the changes in soil structure and would address the problem of spatial heterogeneity that complicates the use of BD, PR and PSD in such heterogeneous soils. Although there was a notable increase in the PR in the topsoil between 0 and 0.10 m for both trafficked plots, no significant increase was shown, probably due to the additional effect of the steel tracks that contribute to loosen topsoil and consequently to diminish the effect of soil compaction. According to the observed structural deteriorations, it is necessary i) to use a lighter machine for golf construction to minimize the compaction effect, especially when soil is scraped to a depth of 0.20 m or deeper; and ii) to use the machine under dry soil conditions, since it appears that the compaction is less pronounced in this case. Acknowledgments This study was supported in part by AgroLab Swiss GmbH. We thank Mijo Josic for the laboratory analysis. References Alakukku, L., 1996. Persistence of soil compaction due to high axle load traffic: I. Shortterm effects on the properties of clay and organic soils. Soil Till. Res. 37, 211–222. Alaoui, A., Goetz, B., 2008. Dye tracer and infiltration experiments to investigate macropore flow. Geoderma 144, 279–286. Alaoui, A., Helbling, A., 2006. Evaluation of soil compaction using hydrodynamic water content variation: comparison between compacted and non compacted soil. Geoderma 134, 97–108. Alaoui, A., Eugster, W., 2004. Dual-porosity modelling of groundwater recharge: testing a quick calibration using in situ moisture measurements, Areuse River Delta, Switzerland. Hydrogeol. J. 12, 464–475. Alaoui, A., Germann, P., Jarvis, N., Acutis, M., 2003. Dual-porosity and kinematic wave approaches to assess the degree of preferential flow in an unsaturated soil. Hydrol. Sci. J. 48 (3), 455–472. Arvidsson, J., Håkansson, I., 1996. Do effects of soil compaction persist after ploughing? Results from 21 long-term field experiments in Sweden. Soil Till. Res. 39, 175–197. Ball, B.C., 1981. Pore characteristics of soils from two cultivation experiments as shown by gas diffusivities and permeabilities and air-filled porosities. J. Soil Sci. 32, 465–481. Bengough, A.G., Mullins, C.E., 1990. Mechanical impedance to root growth: A review of experimental techniques and root growth responses. J. Soil Sci. 41, 341–358. Berli, M., Kulli, B., Attinger, W., Keller, M., Leuenberger, J., Flühler, H., Springman, S.M., Schulin, R., 2004. Compaction of agricultural and forest subsoils by tracked heavy construction machinery. Soil Till. Res. 75, 37–52. Berli, M., Kirby, J.M., Springman, S.M., Schulin, R., 2003. Modelling compaction of agricultural subsoils by tracked heavy construction machinery under various moisture conditions in Switzerland. Soil Till. Res. 73, 57–66. Blunden, B.G., Mcbride, R.A., Daniel, H., Blackwell, P.S., 1994. Compaction of an earthy sand by rubber tracked and tired vehicles. Australian J. Soil Res. 32 (5), 1095–1108. Boone, F.R., 1988. Weather and other environmental factors influencing crop responses to tillage and traffic. Soil Till. Res. 11 (3/4), 283–358. da Silva, A.P., Kay, B.D., Perfect, E., 1994. Characterization of the least limiting water range of soils. Soil Sci. Soc. Am. J. 58 (6), 1775–1781. Dexter, A.R., 1997. Physical properties of tilled soils. Soil Till. Res. 43 (1–2), 41–63.
Dirksen, Ch., 1999. Soil Physics Measurements. Catena Verl. GeoEcology paperback, Reiskirchen, Germany. ISBN: 3-923881-43-3. Dumbeck, G., 1984. Einfluss aussergewöhnlicher Druckbelastung auf das Bodengefüge und die Durchwurzelung. Mitteilungen Deutschen Bodenkundlichen Gesellschaft 40, 61–62. Flury, M., Flühler, H., 1995. Tracer characteristics of Brilliant Blue FCF. Soil Sci. Soc. Am. J. 59, 22–27. Gassman, P.W., Erbach, D.G., Melvin, S.W., 1989. Analysis of track and wheel soil compaction. Trans. ASAE 32 (1), 23–29. Håkansson, I., Reeder, R.C., 1994. Subsoil compaction by vehicles with high axle load — extent, persistence and crop response. Soil Till. Res. 29, 277–304. Horn, R., 1981. Eine Methode zur Ermittlung der Druckbelastung von Böden anhand von Drucksetzungsversuchen. Zeitschrift Kulturtechnik Flurbereinigung 22 (1), 20–26. Horn, R., Rostek, J., 2000. Subsoil compaction processes — state of knowledge. In: Horn, R., van den Akker, J.J.H., Arvidsson, J. (Eds.), Subsoil Compaction — Distribution, Processes and Consequences. : Adv. Geoecol., vol. 32. Catena, Reiskirchen, Germany, pp. 44–54. Karafiath, L.L., 1984. Finite element analysis of ground deformation beneath moving track loads. Proceedings of the Eighth International Conference of the ISTVS, Cambridge, England, pp. 277–290. Keller, T., Trautner, A., Arvidsson, J., 2002. Stress distribution and soil displacement under a rubber-tracked and a wheeled tractor during ploughing, both on-land and within furrows. Soil Till. Res. 68, 39–47. Kiliç, K., Özgöz, E., Akba, F., 2004. Assessment of spatial variability in penetration resistance as related to some soil physical properties of two fluvents in Turkey. Soil Till. Res. 76 (1), 1–11. Kirby, J.M., Blunden, B.G., Trein, C.R., 1997. Simulating soil deformation using a criticalstate model. II. Soil compaction beneath tyres and tracks. Eur. J. Soil Sci. 48, 59–70. Koolen, A.J., 1974. A method for soil compactibility determination. J. Agric. Eng. Res. 19, 271–278. Koolen, A.J., Vaandrager, P., 1984. Relationships between soil mechanical properties. J. Agric. Eng. Res. 29, 313–319. Kulli, B., Gysi, M., Flühler, H., 2003. Visualizing soil compaction based on flow pattern analysis. Soil Till. Res. 70, 29–40. Lipiec, J., Hatano, R., 2003. Quantification of compaction effects on soil physical properties and crop. Geoderma 116, 107–136. Lowery, B., Morrison Jr., J.E., 2002. Soil penetrometers and penetrability. Book Series In: Dane, J.H., Topp, G.C. (Eds.), Methods of Soil Analysis: Part 4, Physical Methods: Soil Sci. Soc. of Am., vol. 5, pp. 363–388. Madison, WI. Marsili, A., Servadio, P., 1996. Compaction effects of rubber or metal-tracked tractor passes on agricultural soils. Soil Till. Res. 37 (1), 37–45. McQueen, D.J., Shepherd, T.G., 2002. Physical changes and compaction sensitivity of a fine-textured, poorly drained soil (Typic Endoaquept) under varying durations of cropping Manawatu Region New Zealand Soil Till. Res. 63, 93–107. Pagliai, M., 1998. Soil porosity aspects. Int. Agrophys. 4, 215–232. Roth, K., Schulin, R., Flühler, H., Attinger, W., 1990. Calibration of time domain reflectrometry for water content measurement using a composite dielectric approach. Water Resour. Res. 26, 2267–2274. Rusanov, V.A., 1991. Effect of wheel and track traffic on the soil and crop growth and yield. Soil Till. Res. 19, 131–143. Shafer, R.L., Johnson, C.E., 1990. Soil dynamics and cropping systems. Soil Till. Res. 16, 143–152. Shafiq, M., Hassan, A., Ahamad, S., 1994. Soil physical properties as influenced by induced compaction under laboratory and field conditions. Soil Till. Res. 29, 13–22. Soane, B.D., Van Ouwerkerk, C., 1995. Implications of soil compaction in crop production for quality of the environment. Soil Till. Res. 35, 5–22. Thomas, G.W., Phillips, R.E., 1979. Consequences of water movement in macropores. J. Environ. Qual. 8, 149–152. Unger, P.W., 1996. Soil bulk density, penetration resistance, and hydraulic conductivity under controlled traffic conditions. Soil Till. Res. 37, 67–75. Vaz, C.M.P., Bassoi, L.H., Hopmans, J.W., 2001. Contribution of water content and bulk density to field soil penetration resistance as measured by a combined cone penetrometer — TDR probe. Soil Till. Res. 60, 35–40.