Changes in tuition policy natural policy experiments in five countries AUGUST 2004
Changes in tuition policy natural policy experiments in five countries AUGUST 2004
Conducted by: Watson Scott Swail, Ed. D. and Donald E. Heller, Ph. D. Educational Policy Institute
Canada Millennium Scholarship Foundation 1000 Sherbrooke West Suite 800 Montreal, QC H3A 3R2
Published in 2004 by The Canada Millennium Scholarship Foundation 1000 Sherbrooke Street West, Suite 800, Montreal, QC, Canada H3A 3R2 Toll Free: 1-877-786-3999 Fax: (514) 985-5987 Web: www.millenniumscholarships.ca Email:
[email protected] Does Money Matter: Millennium Research Series Number 14
National Library of Canada Cataloguing in Publication
Educational Policy Institute Watson Scott Swail, Ed. D. and Donald E. Heller, Ph. D. Changes in Tuition Policy: Natural Policy Experiments in Five Countries
Includes bibliographical references. ISSN 1704-8435 Millennium Research Series (Online) Cover Design: Interpôles Layout Design: Charlton + Company Design Group
The opinions expressed in this research document are those of the authors and do not represent official policies of the Canada Millennium Scholarship Foundation, and other agencies or organizations that may have provided support, financial or otherwise, for this project.
Table of Contents Introduction . . . . . . . . . . . . . . . . . . . . . . . . . . . . . . . . . . . . . . . . . . . . . . . . . . . .1 Background . . . . . . . . . . . . . . . . . . . . . . . . . . . . . . . . . . . . . . . . . . . . . . . . . . . . .3 The Case Studies . . . . . . . . . . . . . . . . . . . . . . . . . . . . . . . . . . . . . . . . . . . . . . . . .7 Tuition Freeze: Quebec . . . . . . . . . . . . . . . . . . . . . . . . . . . . . . . . . . . . . . . . . . . .9 Tuition Freeze: British Columbia . . . . . . . . . . . . . . . . . . . . . . . . . . . . . . . . . . . . .13 Tuition Reduction: Newfoundland and Labrador . . . . . . . . . . . . . . . . . . . . . . . . . .19 Tuition Reduction: Manitoba . . . . . . . . . . . . . . . . . . . . . . . . . . . . . . . . . . . . . . . .23 Introduction of Tuition Fees: England . . . . . . . . . . . . . . . . . . . . . . . . . . . . . . . . .27 Introduction of Tuition Fees: Australia . . . . . . . . . . . . . . . . . . . . . . . . . . . . . . . . .31 Elimination of Tuition Fees: Ireland . . . . . . . . . . . . . . . . . . . . . . . . . . . . . . . . . . .35 Tuition Experiments in a Decentralized Environment: United States . . . . . . . . . . . .39 Summary and Discussion . . . . . . . . . . . . . . . . . . . . . . . . . . . . . . . . . . . . . . . . .…47
Appendix 1: Price Sensitivity and Post-Secondary Education . . . . . . . . . . . . . . . . .51 Appendix 2: Tables . . . . . . . . . . . . . . . . . . . . . . . . . . . . . . . . . . . . . . . . . . . . . .55
References . . . . . . . . . . . . . . . . . . . . . . . . . . . . . . . . . . . . . . . . . . . . . . . . . . . . .65
ACKNOWLEDGEMENTS We wish to acknowledge a host of people who were helpful in leading us to appropriate data sources, who provided us with data directly or who helped us understand the policy issues from an internal perspective. First, we would like to acknowledge the assistance of Kathleen Hadford, who conducted background research for this project. In Canada, we wish to thank: Jean Pierre Dufort, Ministère de l’Éducation, Direction des statistiques et des études quantitatives, Quebec City, Quebec
Erika Shaker, Director, Education Project, Canadian Centre for Policy Alternatives (CCPA), Ottawa, Ontario Dan Smith, Senior Policy Analyst, Council on Post-Secondary Education (COPSE), Winnipeg, Manitoba Paul Vigneau, Secrétaire-coordonnateur, Committee on the Financial Accessibility of Education, Province of Quebec, Sainte-Foy, Quebec In the international arena we wish to thank:
Harry Hitchman, Manager, Accountability Branch, Ministry of Advanced Education, Province of British Columbia, Victoria, British Columbia
John Ainley, Deputy Director, Australian Council for Educational Research, Victoria, Australia
Ben Levin, Professor, University of Manitoba, Winnipeg, Manitoba
Denise Bamford, Information Provision Manager, Higher Education Statistics Agency (HESA), Gloustershire, UK
Lori McElroy, Manager, Education and Labour Market Research, CEISS — Research and IT Solutions, Victoria, British Columbia
Nicholas Barr, Professor of Public Economics, London School of Economics, London, England
Geoff Newman, Manager, Division of Corporate Planning and Research Department of Youth Services and Post-Secondary Education, Newfoundland and Labrador, St. John’s, Newfoundland and Labrador Herb O’Heron, Senior Analyst, Association of Universities and Colleges of Canada, Ottawa, Canada Bruce Proctor, Advanced Education and Training, Government of Manitoba, Winnipeg, Manitoba Brenda Rowe, Planning and Research Analyst, Department of Youth Services and Post-Secondary Education, St. John’s, Newfoundland and Labrador
Bruce Chapman, Director, Centre for Economic Policy Research, Research School of Social Sciences, Australian National University, Canberra, Australia Fergal Costello, Head of Policy and Planning, Higher Education Authority, Dublin, Ireland Geoff Izzard, Department of Education, Science and Training, Commonwealth of Australia, Canberra, Australia Barry McGaw, Deputy Director for Education, OECD, Paris, France Hans Vossensteyn, Research Associate, Center for Higher Education Policy Studies (CHEPS), Universiteit Twente, Enschede, Netherlands
1
INTRODUCTION Demand for higher education has increased steadily over the last decade. In Canada and the United States, enrolment in the 1990s reached all-time highs, as did the proportion of students to the general population within certain age groups. In European and other industrialized nations, enrolment also increased. Because public higher education systems rely heavily on public funding to subsidize the cost of instruction, the expansion of higher education has placed a heavy burden on governments at a time when demand for other services is also growing. This has forced governments to reconsider their education subsidies. In many countries, public policy has moved toward shifting more of the cost of higher education from taxpayers to students and parents. In addition to easing fiscal pressure on governments, this change reflects the growing sense that individuals, who gain great benefit from public education, should pay some portion of the total cost. Historically, that share was relatively small; but because enrolment was also small on a per-capita basis, the burden on taxpayers was limited. Recent government budget problems and growing attendance, however, have increased it considerably. In Canada, the percentage of university revenues garnered from student fees increased from 13 to 20 per cent between 1991–92 and 2001–02. The total revenue from these fees doubled in constant dollars during this period (Statistics Canada, 2003). In the U.S., the tuition fee share of revenue rose
from 21 to 29 per cent between 1980–81 and 1995–96 (NCES, 2002, p. 373). Even in Europe, where a free education system has been an important part of the culture, user fees are slowly being introduced. It has been the common understanding that when tuition increases, enrolment decreases. Affluent students are, naturally, less likely to change their plans because of price increases; tuition requires a proportionately smaller expenditure on their part. In California, for example, the net price of post-secondary attendance (after all grants are considered) requires 45 per cent of a low-income family’s annual income, but only 12 per cent from a high-income family (Swail, Gladieux and Lee, 2001). Thus, the impact of tuition or fee increases can be much worse for lowerincome students and their families, potentially decreasing enrolment from that group (Heller, 1997, 1999). It is argued that even with financial aid, the “sticker-shock” of higher tuition fees can push away people who are adverse to risk and to cost (Advisory Committee on Student Financial Assistance, 2001). Around the world, governments are torn between serving the public good by making higher education affordable for all and paying for their burgeoning education systems. Contradictory approaches to tuition policy have developed. Several jurisdictions have frozen, reduced or eliminated tuition and fees in recent years. Others have introduced tuition fees for the first time, to reduce the burden on the taxpayer and levy a greater share of the responsibility of post-secondary financing on students and families.
C H A N G E S I N T U I T I O N P O L I C Y: N AT U R A L P O L I C Y E X P E R I M E N T S I N F I V E C O U N T R I E S
2
THIS STUDY
PROJECT LIMITATIONS
This study was conducted for the Canada Millennium Scholarship Foundation to examine the relationship between tuition pricing and enrolment trends in 10 jurisdictions, (reflecting a variety of policy shifts) around the world (Table 1). In Canada, Quebec and British Columbia froze tuition at different times in the 1980s and 90s. Manitoba and Newfoundland reduced tuition fees in the late 1990s and early 2000s, but Ireland went further, abolishing tuition fees in 1996.
Because tuition and fee charges are mostly, although not exclusively, an issue of university-level education, we have not looked at community colleges and vocational/technical colleges. We also did not consider financial aid programs because of the difficulty of collecting appropriate data. We have not explored issues related to socio-economic status, family income or visible minorities. Therefore, there are no comments on how tuition policy affects the composition of the student body. We strongly encourage future studies to consider these issues for analysis.
TABLE 1: FIVE POLICY STRATEGIES IN TEN JURISDICTIONS POLICY
JURISDICTION
Tuition Freezes
Quebec and British Columbia
Tuition Reductions
Manitoba and Newfoundland and Labrador
Abolition of Tuition Fees
Ireland
Introduction of Tuition Fees
United Kingdom and Australia
Tuition in a Competitive,
United States (Massachusetts,
Free Environment
Virginia and California)
On the other hand, Australia introduced tuition fees in the mid-1980s, and raised them in 1989 and 1996. At the end of the 1990s, the United Kingdom introduced tuition fees for the first time. In the United States, Massachusetts, Virginia and California were selected because in the 1990s, these states opted to reduce tuition prices. To analyze the impact of fees on enrolment, we collected data from each jurisdiction on fees, enrolment, public post-secondary expenditures and post-secondary participation rates. As much as possible, we collected data preceding and following the policy shift in an attempt to define the trend.
READING THIS REPORT As you read this report, please note that we have adjusted all trends data using the current population indices of respective countries. We tried to use similar data whenever possible. However, we were occasionally forced to use what was made available to us by the many participating organizations.
3
Background Today, more countries are using a combination of tuition and student aid programs to regulate and influence enrolment in higher education, and level the playing field so that opportunity for higher education is more fairly distributed across income levels. In the United States and Canada, tuition fees are standard in the post-secondary system and they are becoming more common elsewhere in the world. According to Vossenstyn (2000), there are three reasons for this. First, students who pay tuition receive a high return on their investment, thus they should bear part of the responsibility for its cost. Second, tuition allows competition in higher education by pricing institutions against each other, giving students choice, even within a government monopoly. And third, a user-fee system generally makes students take their studies more seriously. The principal criticism of tuition fees is that they can be significant barriers to post-secondary access. The following pages provide a brief review of literature related to tuition pricing and student enrolment. A number of studies in the U.S. have confirmed that when tuition fees increase, enrolment decreases in a variable proportion. The landmark study of price sensitivity in higher education was the meta-analysis conducted by Leslie and Brinkman (1987). They studied public and private twoand four-year institutions to come up with their “student price response coefficient,” a measure of the change in post-secondary participation of 18–24 year olds for every $100 increase in tuition fees. They found that a $100 increase in tuition fees resulted in a 0.7 per cent decrease in enrolment. Many subsequent studies have been conducted with similar methodology and produced similar findings — economist Tom Kane
found in 1995 that a $1,000 (1991 dollars) increase in tuition at four-year institutions resulted in an enrolment decline of 1.4 per cent. Recently, however, more conservative findings have suggested that senior students, who have already invested considerable time and money, are less likely to change direction because of a tuition increase. Or it may be the conservative findings are caused by the increased value of a post-secondary degree over the past two decades. According to Heller, “During the two decades covered by this study, the wage premium earned by those who attended college compared to those who did not grew substantially. Clearly, even if nothing else had changed in the ensuing time period, students likely understood the increased importance of a college education in the labour markets. Thus, they are more likely to suffer tuition increases than their predecessors a generation or more earlier.” (Heller, 1999, p. 82.) Taken together, the studies of the 1980s and 1990s came to the same conclusion: that increases in tuition fees decrease enrolment. In 1997, Heller listed five key observations based on his meta-analysis of price-response findings: 1. Increases in tuition lead to declines in enrolment. 2. Decreases in financial aid may lead to declines in enrolment. 3. Low-income students are more sensitive to changes in tuition and aid than other students. 4. Black students were more sensitive to tuition and aid changes, while the evidence for Hispanic students was mixed. 5. Students in community colleges were more sensitive to tuition and aid changes.
4
C H A N G E S I N T U I T I O N P O L I C Y: N AT U R A L P O L I C Y E X P E R I M E N T S I N F I V E C O U N T R I E S
Beyond the U.S., research on price sensitivity is limited. Michael and Scully (1999) conducted a study of tuition fees and enrolment in Ontario between 1977–87 and 1996–97. They found that a 10 per cent increase in university tuition in Ontario caused full-time enrolment to increase by 0.5 per cent and part-time enrolment to decrease by 2.1 per cent. They concluded this was because the university system in Ontario, as in other provinces across Canada, has been so heavily subsidized that enrolment rises regardless of tuition increases, because the perceived value of the a university education is higher than the opportunity cost, a comment that resonates with Heller’s (1999) assertion. In a separate study, price was found to have a much greater impact on part-time students than on full-time students. Drewes and O’Heron (1999) did a study of the large decline in part-time students between 1992 and 1998. Based on a regression analysis, they concluded that the reduction in part-time students would have been halved if tuition fees had remained constant from 1992 to 1996. Outside of North America, price elasticity research is even more limited, partly because tuition fees are relatively new in many countries and partly because post-secondary funding is in flux as governments look to ways to curtail spiralling costs. Australia, Austria, the United Kingdom, Poland and Russia have introduced or re-introduced fees over the past few years, many central European countries are considering doing so and the Netherlands and Portugal have dramatically increased fees. (Vossenstyn, 2000).
Higher education in many countries has seen a large increase in demand in recent years, largely because of the growing market for more highly educated workers. The “college wage premium,” the amount that a post-secondary graduate compared to someone with only a high school diploma, has greatly increased over the last two decades. While there has been some response on the part of suppliers, it has not been nearly as great as the increase in demand. In short, higher education is not a typical good or service, because of two important characteristics that distinguish it from other services: it is not motivated by profit, for the most part, and there are barriers to entry. Not just anyone can open a university, however many students seek admission. For more on price sensitivity and post-secondary education, please see Appendix 1.
THE ECONOMICS OF HIGHER EDUCATION Before we discuss these questions, we will take a brief review of the economics of higher education, and why and how tuition, fees, and demand work within that system. In a typical market for a good or service, the price paid and the quantity purchased is determined by the intersection of the supply and demand curves. Demand curves are typically downward sloping — as the price of a good goes up, consumers are willing to purchase fewer of them. Supply curves, in contrast, are generally upward sloping – as price increases, producers are willing to supply
BACKGROUND
more of the good or service. The intersection of the two, or the equilibrium point, determines the price and quantity in the market. If consumer demand for a good increases, due for example to some new information about the good, then the demand curve shifts outward, as shown below from D0 to D1. Assuming no other changes in the market for the good, the effect of this shift is to establish a new equilibrium point, increasing both the price (from P0 to P1) and quantity (from Q0 to Q1) in the market. In a typical market, the increase in demand would result, after some lag, in a response on the part of suppliers. Existing producers may increase their capacity in order to supply more of the good to the market, and new suppliers would enter the market. This would result in an outward shift of the supply curve, from S0 to S1, thus establishing a new market equilibrium. This new equilibrium would reflect both a decrease in the price from the second equilibrium point (from P1 to P2) and a further increase in quantity (from Q1 to Q2). However, the supply of higher education is not like that of a typical good or service in the economy. Higher education has two important characteristics that distinguish it from other services: • The supply is much more inelastic than most goods i.e., the supply curve is more vertical and a shift upward in price results in a relatively smaller increase in the quantity producers are willing to supply.
5
PRICE SENSITIVITY PART I
Price
S0
Equilibrium point
P0
D0
0
Q0
Quantity
PRICE SENSITIVITY PART II
Price
S0
P1
New equilibrium point
P0
D1 D0
0
Q0
Q1
Quantity
PRICE SENSITIVITY PART III
Price
S0 S1
P1 New equilibrium point
P2 P0
D1 D0
0
Q0
Q1
Q2
Quantity
6
C H A N G E S I N T U I T I O N P O L I C Y: N AT U R A L P O L I C Y E X P E R I M E N T S I N F I V E C O U N T R I E S
• There are relatively large barriers to entry to the higher education market. The first condition occurs largely because of the mission of most colleges and universities, whether government-controlled or private non-profit institutions. The mission of these institutions is not to maximize profits or even revenues, but rather, to achieve a certain level of quality in the provision of teaching, research and public service. Thus, since they are not profit- or revenuemaximizing entities, there is little incentive to increase the supply of higher education they are willing to provide.1 The second condition, the barriers to entry, exists for two reasons. First, in most countries, governments control the licensing of tertiary education institutions. One cannot simply open up a university and offer degrees without government licensure authority. Nongovernmental accrediting agencies, such as those found in the United States, also have authority over the ability of higher education institutions to qualify for government assistance in the form of student aid. Second, the costs of starting up a traditional college or university are relatively high and make it difficult for new providers to enter the market. The advent of wholly Internet-based institutions, however, is beginning to lower these barriers. Higher education in many countries has seen a large increase in demand in recent years. In the United States, for example, this growth in demand has been due largely to the demands of labor markets for more highlyeducated individuals. The college wage premium — the amount that a college graduate
earns compared to someone with only a high school diploma — has greatly increased over the last two decades. While there has been some response on the part of suppliers, it has not been nearly as great in magnitude as the increase in supply. The impact of these changes on the higher education market is shown below. The increase in demand is again reflected in the shift outward of the demand curve from D0 to D1, causing an initial increase in the price (from P0 to P1) and quantity (from Q0 to Q1) in the market. As described earlier, the supply curve is relatively inelastic (more vertical) and is unlikely to shift outward very much due to barriers to entry in the market. Thus, after producers do respond, the new equilibrium — with a price of P2 and quantity of Q2 — reflects a much larger proportional increase in the price than in the quantity, as compared with the original equilibrium points of P0 and Q0.
PRICE SENSITIVITY PART IV
Tuition
S0 S 1
P1
New equilibrium
P2 P0
D1 D0
0
Q0 Q1 Q2
# of students attending college
1. This is not true, of course, of for-profit colleges and universities. As profit-maximizing firms, they do have incentives to increase the supply they are willing to provide as the price increases. However, the for-profit sector is a very small portion of the higher education market in most countries. In the United States, for example, this sector accounts for less than three per cent of enrolment (Digest of Education Statistics).
7
THE CASE STUDIES We did eight case studies for this report: four Canadian provinces, Ireland, the United Kingdom, Australia and the United States, where we did one case study on three states — Virginia, California and Massachusetts.
CANADA Although funding for all levels of education comes from a combination of local, provincial and federal budgets, education is a provincial responsibility in Canada. The provinces set policies and programs from kindergarten through post-secondary education and resist involvement by the federal government. The education systems in the provinces are more similar than dissimilar, except in the province
of Quebec, which has developed a system that differs significantly in terms of the pathway to and through post-secondary studies. This study looks at four of the 10 Canadian provinces. Two, Quebec and British Columbia, have used tuition freezes over the past 10–20 years. Both Manitoba and Newfoundland recently reduced tuition fees.
9
Tuition Freeze: Quebec POLICY BRIEF Tuition was essentially frozen in Quebec between 1972 and 1989; a series of increases began in the 1990-91 academic year. Four years later, tuition was frozen again and, apart from minor corrections, the freeze was still in place by spring 2003. However, tuition freezes only apply to Quebec students. Outof-province and international students pay more tuition than Quebecers.
BACKGROUND Quebec is Canada’s largest province by area and the second most populous, with 7.4 million people, or 24 per cent of the total population. Quebec differs in language and culture from the other provinces; 81.4 per cent of its residents speak French as their first language. The province has consistently had one of Canada’s most progressive education systems.
EDUCATION PRIMER Quebec’s public education system offers six years of elementary education and five years of secondary education. Of the 69 school boards in the province, 60 are officially French and nine are English. Aboriginallanguage schooling is available in selected areas. Approximately 1.35 million students attend more than 2,500 public schools, while eight per cent of Quebec students attend a private school (Quebec, 2002). The post-secondary system is divided between colleges and universities. A year at a community college, or CEGEP (a French acronym for general and technical colleges),
is a prerequisite for university education. Of 63 colleges in the province, 52 are CEGEPs while the remaining 11 are not. In 2001–02, there were 206,069 students attending college in Quebec (Quebec, 2002). The CEGEP system was introduced in 1967 to provide a better transition from secondary school to post-secondary education and the workforce. At CEGEPs students enrol either in pre-university or technical career education, but receive common generaleducation courses. Approximately 45 per cent of CEGEP students are in the pre-university track (Federation des Cegeps, 2003). There are nine universities with 18 branch campuses in Quebec. In 2000–01, 58.7 per cent of Quebec youth went on to college or pre-university, a slight decline since the mid1990s, but stable since 1997–98. Two-thirds of pre-university students finish the program and receive their Diploma of College Studies (DCS). Approximately 36 per cent of all Quebec youth enrol in university, of whom two-thirds (65.8 per cent) receive a Bachelor’s degree.
POST-SECONDARY TRENDS Between 1972–73 and 1989–90, university tuition fees in Quebec remained steady at approximately $500 per year; measured in constant dollars, education got steadily cheaper. But then a series of increases were levied by the provincial government; in 1990–91 alone, tuition fees rose 74 per cent (from $519 to $904) from the previous year. The total increase between the 1989–90 and 1994–95 was 190 per cent beyond inflation, equivalent to $1,303 in 2002 dollars.
C H A N G E S I N T U I T I O N P O L I C Y: N AT U R A L P O L I C Y E X P E R I M E N T S I N F I V E C O U N T R I E S
10
When tuition hit $1,700 in 1994–95, a new freeze was put in place by the Parti Québécois government. Tuition remained the same in 1995–96, and was reduced by 6.2 per cent in 1996–97. It went back up 12.9 per cent the next year, but has remained static since at $1,851. Compared to the rest of Canada, tuition in Quebec remains a bargain (Figure 1). FIGURE 1:
UNIVERSITY DOMESTIC TUITION CHARGES, QUEBEC, ONTARIO AND CANADA, 1990–91 TO 2002–03 (CONSTANT 2002 DOLLARS)
5000 Canada Ontario
Enrolement
4000
Quebec
3000
2000
1000 90–91
92–93
94–95
96–97
98–99
00–01
02–03
Source: Statistics Canada, Annual Tuition and Additional Fee Survey.
The annual tuition increases during the 1990s and early 2000s show that, with the exception of the 75 per cent increase in 1990-91, Quebec fee increases were comparable to or lower than those in other parts of the country.
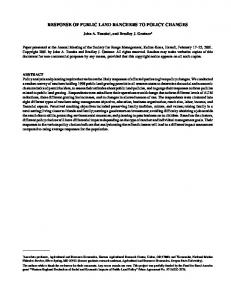
POLICY IMPACT Figure 2 shows changes in tuition charges compared with full- and part-time university enrolment over a 12-year period beginning in 1990–91. During the period of large-scale tuition increases in the early 1990s, full-time enrolment initially increased and then levelled off at approximately 140,000 students, where it remains. Part-time enrolment, however, decreased significantly, from 121,282 in 1990–91 to 93,900 in 2001–02, a decline of 23 per cent.
TUITION FREEZE: QUEBEC
UNIVERSITY DOMESTIC TUITION CHARGES (CURRENT AND CONSTANT 2002 DOLLARS) AND FULL-TIME AND PART-TIME UNIVERSITY ENROLMENTS, QUEBEC, 1990–91 TO 2001–02
2,500
160,000 140,000
Tuition
2,000
120,000 100,000
1,500
80,000 1,000
60,000 40,000
500
University Enrolment
FIGURE 2:
11
20,000 -
-
90–91 91–92 92–93 93–94 94–95 95–96 96–97 97–98 98–99 99–00 00–01 01–02 Tuition Charges (current)
Tuition Charges (constant)
Full-time
Part-time
Source: Statistics Canada, Annual Tuition and Additional Fee Survey; Statistics Canada, University Student Information System (USIS).
The enrolment changes seen in Quebec are similar to those in Canada and Ontario (Figure 3). Since 1990–91, the enrolment patterns in these three jurisdictions were essentially the same, although the decreases in Quebec during the mid-1990s were slightly larger than Ontario and Canada. FIGURE 3:
ANNUAL PER CENT CHANGE IN UNIVERSITY FULL TIME EQUIVALENT ENROLMENTS IN QUEBEC, ONTARIO AND CANADA, 1990–91 TO 2001–02
5.0
Annual Per Cent Change
Canada Ontario
2.5
Quebec
0.0
-2.5
-5.0 90–91 91–92
92–93 93–94 94–95 95–96
96–97 97–98 98–99 99–00
Source: Statistics Canada, University Student Information System (USIS).
00–01 01–02
C H A N G E S I N T U I T I O N P O L I C Y: N AT U R A L P O L I C Y E X P E R I M E N T S I N F I V E C O U N T R I E S
12
Figure 4 illustrates a more complex look at the interaction between tuition, full-time equivalent enrolment and provincial expenditures for PSE in Quebec. During the early 1990s, while tuition rose expeditiously, enrolment also increased. However, enrolment changes often run against tuition increases in Quebec and it is difficult to find a pattern that suggests tuition has an influence on enrolment behaviour.
Annual Per Cent Change
FIGURE 4:
ANNUAL PER CENT CHANGE IN UNIVERSITY DOMESTIC TUITION CHARGES, FTE ENROLMENT, AND PROVINCIAL EXPENDITURES ON POST-SECONDARY EDUCATION, QUEBEC, ONTARIO, AND CANADA, 1990–91 TO 2002–03 (BASED ON CONSTANT DOLLARS)
40
Tuition Charges (Constant)
30
FTE Enrolment Provincial Expenditures (constant)
20 10 0 -10 91–92
93–94
95–96
97–98
99–00
01–02
Source: Statistics Canada, Annual Tuition and Additional Fee Survey; Statistics Canada, University Student Information System (USIS); Statistics Canada, CANSIM II, tables 478-0004 and 478-0007.
Figure 4 also shows that Quebec’s annual expenditures on post-secondary education fluctuate greatly. After adjusting for inflation, total spending per full-time university student decreased significantly over time. On a per student basis, total expenditures declined 17 per cent in constant dollars between 1990–91 and 2001–02.
DISCUSSION Increasing tuition has not had a great impact on university attendance in Quebec, although there are fewer part-time students. It may be that because Quebec has almost always had a low-tuition policy and a commitment to tuition freezes, the perception is that postsecondary studies are generally affordable.
The low level of tuition also makes it a small proportion of total income, which likely reduces its importance as a factor when students make decisions about post-secondary education in Quebec. As well, there may be a common perception that post-secondary education is worth the cost. It seems likely that the greater barrier to access in Quebec is the number of spaces in post-secondary institutions. Enrolment cannot increase if no additional space is added. The Quebec government has kept university education affordable for students, but overall spending on post-secondary education is falling, so its low-tuition policy has not increased the percentage of youth attending university.
13
Tuition Freeze: BRITISH COLUMBIA POLICY BRIEF There were two tuition freezes in British Columbia in the 1990s. The first began in 1992–93 and lasted for two years. After two years of moderate increases, another freeze was imposed and remained until 2001–02, when tuition was reduced by five per cent.2
BACKGROUND Four million people, or 13 per cent of Canada’s population, reside in British Columbia.
EDUCATION PRIMER British Columbia has a traditional kindergarten to 12 public school system, with an enrolment of 623,344 students (fall 2002–03), plus an additional 65,935 attending private or home-schooling (B.C. Ministry of Education, 20033). The province has 28 public post-secondary institutions, including four traditional universities, two specialized universities, five university colleges, eleven colleges, three provincial institutes, the Open Learning Agency (OLA) and two Aboriginal institutes (Council of Ministers of Education, Canada, 2001). In addition, B.C. also has private institutions offering post-secondary credentials (Fisher, Rubenson, and Mattia, 2001). The University of British Columbia is the largest in the province, with 30,604 full-time
equivalent spaces in 1999–00. The other traditional universities in the province are the University of Victoria, Simon Fraser University, the University of Northern British Columbia and Royal Roads University. In 1989, the first university colleges were created; in partnership with a university, they could award Baccalaureate degrees. In 1994, legislative amendments gave university colleges the authority to award degrees on their own.
POST-SECONDARY TRENDS Tuition increased during the early 1980s in British Columbia, reaching a high of a 31 per cent jump in 1984–85 (except for the years of the first tuition freeze). It stabilized after that but grew at a rate of five to 10 per cent for much of the next decade. Beginning in 1995–96, the province froze university tuition fees at $2,500 for two semesters,4 until 2001–02, when fees were deregulated. With inflation considered, tuition and fees actually decreased by $350 in constant 2002 dollars during the period between 1995–96 and 2001–02. Comparatively, tuition growth across Canada and in British Columbia’s neighbouring province, Alberta, rose at much higher rates (Figure 5). Although tuition increases across the country and in Alberta levelled off in a similar pattern to B.C., the freeze in B.C. was a far greater limit on post-secondary costs than other provinces.
2. The official reduction was five per cent, but the actual enrolment-weighted decrease was 2.5 per cent. 3. http://www.bced.gov.bc.ca/k12datareports/02sldtxt/1555c.txt 4. As mentioned in the data sources, tuition fees are enrolment-weighted and, as a result, vary slightly from year to year.
C H A N G E S I N T U I T I O N P O L I C Y: N AT U R A L P O L I C Y E X P E R I M E N T S I N F I V E C O U N T R I E S
14
FIGURE 5:
UNIVERSITY DOMESTIC TUITION CHARGES, BRITISH COLUMBIA, ALBERTA AND CANADA, 1990–91 TO 2002–03 (CONSTANT 2002 DOLLARS)
5,000
Constant 2002 Dollars
Canada British Columbia
4,000
Alberta
3,000
2,000
1,000 90–91
92–93
94–95
96–97
98–99
00–01
02–03
Source: Statistics Canada, Annual Tuition and Additional Fee Survey.
FIGURE 6:
ANNUAL PER CENT CHANGE IN UNIVERSITY DOMESTIC TUITION CHARGES, BRITISH COLUMBIA, ALBERTA AND CANADA, 1990—91 TO 2002—03 (BASED ON CURRENT DOLLARS)
25
Annual Per Cent Change
Canada
20
British Columbia
15
Alberta
10 5 0 -5 90–91
92–93
94–95
96–97
98–99
Source: Statistics Canada, Annual Tuition and Additional Fee Survey.
00–01
02–03
TUITION FREEZE: BRITISH COLUMBIA
15
POLICY IMPACT During the tuition increases of the early 1990s and through the freezes that followed, full-time and part-time university enrolment increased in British Columbia. At the start of the 1990s, 42,096 full-time students and 19,433 part-time students attended university in B.C., the equivalent of 48,573 full-time students. By the end of the 1990s, the 3–4 per cent annual increases in fulltime enrolment began to stabilize, comparatively speaking, at rates of 0–2 per cent. By 1999–00, full-time enrolment had reached 54,056 and part-time enrolment 23,744. By 2001–02, over 66,000 FTEs were enrolled at B.C.’s universities.
UNIVERSITY DOMESTIC TUITION CHARGES (CURRENT AND CONSTANT 2002 DOLLARS) AND FULL-TIME AND PART-TIME UNIVERSITY ENROLMENTS, BRITISH COLUMBIA, 1990–91 TO 2001–02
3,500
60,000
3,000
50,000
Tuition
2,500
40,000
2,000 30,000 1,500 20,000
1,000
University Enrolment
FIGURE 7:
10,000
500
-
90–91
92–93
94–95
96–97
98–99
00–01
Tuition Charges (current)
Tuition Charges (constant)
Full-time
Part-time
Source: Statistics Canada, Annual Tuition and Additional Fee Survey; Statistics Canada, University Student Information System (USIS).
This 36.9 per cent growth in FTE enrolment was by far the largest percentage increase in Canada. Nationally, the country experienced an 8.7 per cent increase between 1990–91 and 2001–02. Alberta had the second greatest growth spurt at 17.6 per cent. Except in 1992–93, as tuition fees increased every year in the early 90s, so did provincial spending on post-secondary education (controlled for inflation), and it continued to rise when the freezes took effect in 1995–96. In 1997–98, when fees decreased by 2.3 per cent, the province increased spending by 11.3 per cent. Two years later, with fees still frozen, expenditures increased again by 12.1 per cent, followed by two years of seven per cent increases.5
5. In the late 1990s, the province committed itself to developing a university college system, which provides both trade and university education, conferring certificates, licenses and degrees. This accounts for part of the substantial growth in spending.
C H A N G E S I N T U I T I O N P O L I C Y: N AT U R A L P O L I C Y E X P E R I M E N T S I N F I V E C O U N T R I E S
16
FIGURE 8:
ANNUAL PER CENT CHANGE IN UNIVERSITY DOMESTIC TUITION CHARGES, FTE ENROLMENT AND PROVINCIAL EXPENDITURES ON POST-SECONDARY EDUCATION, BRITISH COLUMBIA, 1990–91 TO 2001–02 (BASED ON CONSTANT DOLLARS)
15
Annual Per Cent Chage
Tuition Charges (Constant)
10
FTE Enrolment Provincial Expenditures (constant)
5
0
-5 91–92
93–94
95–96
97–98
99–00
01–02
Source: Statistics Canada, Annual Tuition and Additional Fee Survey; Statistics Canada, University Student Information System (USIS); Statistics Canada, CANSIM II, Tables 478-0004 and 478-0007.
However, on a per-student basis, provincial funding was flat in the early 1990s, and declined for two years after the tuition freeze took effect, not beginning to climb until 1997–98, from $16,774 in 1996–97 to $22,603 in 2001–02 (constant 2002 dollars).
FIGURE 9:
TOTAL PSE EXPENDITURES PER FULL-TIME UNIVERSITY STUDENT IN BRITISH COLUMBIA, 1990–91 TO 2001–02 (CONSTANT 2002 DOLLARS)
Expenditures Per FT Student
25,000 20,000 15,000 10,000 5,000 -
90–91
91–92
92–93 93–94
94–95
95–96
96–97
Source: Statistics Canada, CANSIM II, tables 478-0004 and 478-0007.
97–98
98–99 99–00
00–01
01–02
TUITION FREEZE: BRITISH COLUMBIA
17
DISCUSSION British Columbia did a good job of keeping university education more affordable during the 1990s. The government held tuition increases back, and even increased spending on post-secondary education. At the time, the province had the third lowest tuition fees in the nation, behind Quebec and Newfoundland. (In 2002–03, it ranks fourth.) However, there is little evidence to suggest the tuition freezes had any impact on enrolment in British Columbia, since some of the growth in the percentage of full-time university students to the 20–24 year-old population in the province (from 18 per cent to 22 per cent between 1990–91 and 2002–03) was during the heavy tuition increases in the early 1990s. The increases in enrolment may have happened because of demographic change, or because young people were more motivated to seek higher education.
The impact of tuition increases on enrolment may become more clear in the next few years. In January 2002, the government announced cuts of 20–40 per cent across all government sectors and ministries, including cuts in youth employment programs ($13 million and 10,000 student jobs), work study programs, the elimination of the firstyear student grant program and a three-year freeze on institutional budgets. A month later, deregulation of tuition fees was announced, ending the tuition freeze and allowing institutions to set their own fees. In the year after, average enrolment-weighted tuition fees rose 25 per cent, and in some instances doubled or tripled. Tuition in the University of British Columbia’s MBA program rose 321 per cent (Doherty-Delorme and Shaker, 2003).
19
Tuition Reduction: Newfoundland and Labrador POLICY BRIEF
EDUCATION PRIMER
University tuition rose for many years in the province of Newfoundland and Labrador until a provincial government was elected, promising to reduce tuition by 25 per cent over three years. The first decrease of 10 per cent was introduced in 2001–02, followed by a second 10 per cent reduction in 2002–03. A final cut of five per cent was planned for the 2003–04 academic year. These reductions and freezes came at a time of student protests and a growing public consciousness of the escalating costs of university education in the province. At the time, it was estimated that university students in Newfoundland were graduating with $23,000 in debt.6
Newfoundland had 326 public kindergarten to grade 12 schools serving 86,898 students in 2001–02. The student body has declined precipitously over the past ten years, to 30 per cent less than in 1990–91. The high school graduation rate of 75.2 per cent in the province is considerably lower than most other provinces, and is exceptionally low for males (67.5 per cent) (Government of Newfoundland and Labrador (2003). Newfoundland has one university, Memorial University in St. John’s, and one college — the College of the North Atlantic, which has branch campuses throughout the province. In 2002–03, 12,562 full-time and 2,156 part-time students attended Memorial University, representing about one-third of all college-aged youth in the province (20–24 years old).
BACKGROUND The province of Newfoundland and Labrador has 533,800 residents (2001), one-third of whom live in St. John’s, the capital. The population has been slowly declining: the college-age population has decreased approximately four per cent per year in each of the last 10 years. The primary industries in the province include fishing, mining and offshore oil.
POST-SECONDARY TRENDS In the mid-1990s, post-secondary education in Newfoundland was in dire straits. The decline of the college-age population meant enrolment either declined or remained stagnant. In 1995–96, full-time enrolment declined by 8.7 per cent and bottomed out at 12,025. Part-time enrolment declined at greater rates, including three years of 20 per cent reductions in the mid-1990s. By the end of the decade, full-time enrolment was at the same level as at the start, and part-time enrolment was cut by half, from 4,023 to 1,932.
6. Students graduated with an average debt load of $22,591 at Memorial University, based on analysis conducted by the Newfoundland and Labrador Department of Education. See Postsecondary Indicators ’98 (http://www.gov.nf.ca/youth/pub/ind97/INDEX.HTM) page 108 for direct reference.
C H A N G E S I N T U I T I O N P O L I C Y: N AT U R A L P O L I C Y E X P E R I M E N T S I N F I V E C O U N T R I E S
20
Meanwhile, university tuition and fees in the province doubled (constant dollars) during the 1990s, from $1,680 in 1990–91 to $3,517 (Figure 10 and Figure 11). In five of 10 years, tuition and fee charges experienced doubledigit increases, including back-to-back years of 17 and 19 per cent (1996–97 and 1997–98).
As can be seen in the two figures, tuition trends between Newfoundland and Labrador, close neighbour Nova Scotia and Canada were similar up until 1996–97. All jurisdictions experienced 10 per cent (average) increases during the early to mid-1990s.
FIGURE 10: UNIVERSITY TUITION FEES, NEWFOUNDLAND AND LABRADOR, NOVA SCOTIA AND CANADA, 1990–91 TO 2002–03 (CONSTANT 2002 DOLLARS)
6,000
Constant 2002 Dollars
Canada Nova Scotia
5,000
Newfoundland and Labrador
4,000 3,000 2,000 1,000 90–91
92–93
94–95
96–97
98–99
00–01
02–03
Source: Statistics Canada, Annual Tuition and Additional Fee Survey.
FIGURE 11: ANNUAL PER CENT CHANGE IN DOMESTIC TUITION CHARGES (2002 DOLLARS), NEWFOUNDLAND AND LABRADOR, NOVA SCOTIA AND CANADA, 1990–91 TO 2002–03
20
Annual Per Cent Change
Canada Nova Scotia Newfoundland and Labrador
10
0
-10 90–91
92–93
94–95
96–97
98–99
Source: Statistics Canada, Annual Tuition and Additional Fee Survey.
00–01
02–03
TUITION REDUCTION: NEWFOUNDLAND AND LABRADOR
Beginning in 1997–98, tuition fees remained virtually level for four years. At that point, the provincial government introduced the fee reduction initiative. As Figure 10 and Figure 11 show, the similarities in tuition trends between Newfoundland, Nova Scotia and Canada end in 2002. While Canada’s average rate of tuition increase moderated, Newfoundland’s decreased.
POLICY IMPACT Full-time and part-time enrolment has begun to increase at Memorial University. In 2002–03, full-time enrolment reached 12,562, up 2.7 per cent from the previous year. Parttime enrolment climbed 4.8 per cent. In total,
21
FTE enrolment at Memorial University was up 2.8 per cent in 2002–03, the largest increase since 1992–93, despite the continuing reduction in the post-secondary-age population. The ratio of full-time university students to college-age population in the province is now at 34 per cent. This continues an upward trend which began in the mid-1990s. Whether the enrolment increase is attributable to fee reductions or national trends is unclear. Between 1992–93 and 1997, postsecondary funding declined by 25 per cent, from $195 million to $147 million (inflation adjusted). Total government spending per full-time university student, our proxy for comparing post-secondary investment across years, averaged $14,852 in 1990–91 (constant
FIGURE 12: ANNUAL CHANGES IN UNIVERSITY FTE ENROLMENT IN NEWFOUNDLAND, NOVA SCOTIA AND CANADA, 1990–91 TO 2001–02
Annual Per Cent Change
10
Canada Nova Scotia Newfoundland and Labrador
5
0
-5
-10 90–91 91–92 92–93 93–94 94–95 95–96 96–97 97–98 98–99 99–00 00–01 01–02 Source: Statistics Canada, Annual Tuition and Additional Fee Survey; Statistics Canada, University Student Information System (USIS); Statistics Canada, CANSIM II, Tables 478-0004 and 478-0007; Statistics Canada, Labour Force Survey, Table 282-0002.
C H A N G E S I N T U I T I O N P O L I C Y: N AT U R A L P O L I C Y E X P E R I M E N T S I N F I V E C O U N T R I E S
22
dollars). Ten years later, the average expenditure dropped to $12,536. However, between 2000–01 and 2001–02, funding increased from $153.4 to $164.5 million, a 7.3 per cent increase above inflation. On a per-student basis, total funding increased from $12,536 to $13,450. Figure 13 shows annual per cent changes in tuition, enrolment and expenditures in Newfoundland. Teamed with the tuition increases up to the latter 1990s were decreases in provincial spending. Enrolment declined during this period. In 1998–99, when expenditures began to increase and tuition fees stabilized, so did enrolment. By 2002–03, following increases in expenditures and decreases in tuition, Newfoundland posted the largest enrolment increase in a decade.
DISCUSSION Unemployment is relatively steady at about 16 per cent in Newfoundland, which could mean enrolment increases are a result of economic conditions: during the 1990s, drops in unemployment coincided with reductions in university enrolment, but it is difficult to be sure the two were related. The greatest concern with any type of tuition reduction plan is whether revenue lost to the institution will be replenished. The previous government of Newfoundland promised to ensure Memorial University received more funding than before, even discounting lost tuition revenue, but the new Conservative government elected in late 2003 may change that.
FIGURE 13: ANNUAL PER CENT CHANGES IN UNIVERSITY TUITION FEES, FTE ENROLMENT AND PSE EXPENDITURES, 1991–92 TO 2001–02
Annual Per Cent Chage
20 15
Tuition Charges (Constant)
10
FTE Enrolment Provincial Expenditures (constant)
5 0 -5 -10 -15 91–92
93–94
95–96
97–98
99–00
01–02
Source: Statistics Canada, Annual Tuition and Additional Fee Survey; Statistics Canada, University Student Information System (USIS); Statistics Canada, CANSIM II, tables 478-0004 and 478-0007; Statistics Canada, Labour Force Survey, Table 282-0002.
23
Tuition Reduction: Manitoba POLICY BRIEF In the early 1990s, tuition and fee charges at Manitoba’s universities rose precipitously, with annual increases averaging 20 per cent between 1990–91 and 1992–93, after which they rose at five to six per cent annually. Enrolment also declined several times during this period (1996–97 being the exception). A further double-digit increase in 1999–00 led to student protests. However, in 1999 the New Democratic Party won the provincial election and rolled back tuition by 10 per cent in 2000–01 at all universities and colleges in the province, and has kept them frozen since.
EDUCATION IN MANITOBA There are approximately 700 public schools in 50 school districts in Manitoba, serving 206,653 elementary and secondary students. Approximately 84 per cent of these youth graduate from high school (Statistics Canada, 1996, page 7), half going on to some form of post-secondary study (Bowlby and McMullen, 2002, p. 46). This matriculation rate is among the lowest in Canada. Manitoba has four universities, three in the Winnipeg area, which is the largest city in the province, with over 700,000 of the province’s 1.1 million inhabitants. The
University of Manitoba in Winnipeg is the largest, with over 32,000 students (22,495 FTE). The others are the University of Winnipeg, Brandon University and the francophone Collège universitaire de SaintBoniface. A total of 48,000 students attend university in the province, equivalent to 32,504 full-time. There are more than 13,000 students in community colleges.
POST-SECONDARY TRENDS Figure 14 illustrates the trend in actual tuition and fee charges at Manitoba universities between 1981–82 and 2001–02. During the 1990s, average tuition at Manitoba universities jumped 78 per cent after controlling for inflation. By 1999–00, inflation-adjusted tuition and fee charges were $3,747 per academic year, almost double the $1,890 charged a decade earlier. After the policy shift in 2000–01, tuition and fees in Manitoba were cut 10 per cent and have been frozen since. This trend can be seen in Figure 15, while comparative average tuition charges in Canada and neighboring Saskatchewan continue to rise. Manitoba’s tuition policy does allow for marginal adjustments to tuition charges to account for inflationary pressures, as well as special-case increases in certain departments (e.g., Dentistry).7
7. The government has provisions in its tuition policy for special-case scenarios that demand increases, mostly in professional schools, such as dentistry and medicine, where costs cannot necessarily be controlled. In those cases, the institutions and/or department must make a case to the provincial government. Some of the criteria include: demonstration that the number of students supported has increased; sufficient labour market demand that students could get jobs and pay back student aid; that higher fees would not have an adverse effect on accessibility; that the program had incurred especially high costs..
C H A N G E S I N T U I T I O N P O L I C Y: N AT U R A L P O L I C Y E X P E R I M E N T S I N F I V E C O U N T R I E S
24
FIGURE 14: ANNUAL PER CENT CHANGE IN TUITION AND FEE CHARGES IN MANITOBA, 1981–82 TO 2001–02 (CURRENT DOLLARS)
25
Annual Per Cent Change
20 15 10 5 0 -5 -10 81–82
83–84
85–86
87–88
89–90
91–92
93–94
95–96
97–98
99–00
01–02
Source: Statistics Canada, Annual Tuition and Additional Fee Survey.
FIGURE 15: ANNUAL DOMESTIC UNIVERSITY TUITION AND FEE CHARGES IN MANITOBA, SASKATCHEWAN AND CANADA, 1990–91 TO 2002–03 (CONSTANT 2002 DOLLARS)
5000 Canada Saskatchewan
Tuition
4000
Manitoba
3000
2000
1000 90–91
92–93
94–95
96–97
98–99
Source: Statistics Canada, Annual Tuition and Additional Fee Survey.
00–01
02–03
TUITION REDUCTION: MANITOBA
25
POLICY IMPACT Before tuition was cut and then frozen in Manitoba, university enrolment declined and then became stagnant. The introduction of reduced tuition coincided with a dramatic increase in the post-secondary population. In the first year of the policy, enrolment grew 3.9 per cent, equivalent to approximately 1,000 full-time students (the headcount was 1,700). The following year, enrolment
increased an additional 6.5 per cent, or 1,861 FTEs (with a headcount of 2,911). In 2002-03, FTE enrolment increased another 8.8 per cent. In total, FTE enrolment increased by 18 per cent, or 5,033 students, in three years. The number of students at university increased 21 per cent or by 8,462 part- and full-time students.
FIGURE 16: ANNUAL PER CENT CHANGE IN UNIVERSITY TUITION CHARGES, FTE ENROLMENT AND PROVINCIAL EXPENDITURES, 1996–97 TO 2002–03 (CONSTANT 2002 DOLLARS)
15
Annual Per Cent Change
Tuition Charges (Constant)
10
FTE Enrolment Provincial Expenditures (Constant)
5
0
-5 96–97
97–98
98–99
99–00
00–01
01–02
02–03
Source: Statistics Canada, Annual Tuition and Additional Fee Survey; Statistics Canada, University Student Information System (USIS); Statistics Canada, CANSIM II, tables 478-0004 and 478-0007; Statistics Canada, Labour Force Survey, Table 282-0002.
C H A N G E S I N T U I T I O N P O L I C Y: N AT U R A L P O L I C Y E X P E R I M E N T S I N F I V E C O U N T R I E S
26
DISCUSSION The tuition reduction was driven by an outcry against rising post-secondary costs and an interest in increasing access to higher education in Manitoba. At first glance, it seems to have been a success: university and college enrolment has risen upwards of 20 per cent. However, whether it has improved access for Aboriginal and low-income groups remains unknown. To ensure universities could keep up with demand, the provincial government posted a 21.6 per cent increase in capital and operating grants to institutions to coincide with the
tuition reduction, injecting $65 million, or about $200 per university FTE student, into the system (see Figure 17). However, there have been no further increases, so when increased enrolment is considered, provincial funding for post-secondary education actually decreased 7.9 and 4.4 per cent in 2001–02 and 2002–03, respectively. Regardless of whether enrolment trends continue upward, operational funding for post-secondary education in Manitoba will remain an issue.
FIGURE 17: ANNUAL PER CENT CHANGE IN POST-SECONDARY FUNDING AND ANNUAL PER CENT CHANGE IN POST-SECONDARY FUNDING PER UNIVERSITY FTE IN MANITOBA, 1997–98 TO 2002–03.
30 Total Funding Change
Enrolments
20
Change per FTE
10
0
-10 97–98
98–99
99–00
00–01
01–02
02–03
Source: Council on Post-Secondary Education (COPSE), Winnipeg, MB (www.copse.mb.ca)
27
INTRODUCTION OF TUITION FEEs: ENGLAND POLICY BRIEF In 1997, the British government announced a plan to introduce tuition fees (initially £1,000 annually) in the 1998–1999 academic year. The plan was a response to strong demands for new resources for higher education after years of decline in support. The number of students doubled between 1980 and 1997, but spending on higher education dropped by 40 per cent on a perstudent basis in that time (Walker, 1997). As well, faculty salaries could not compete internationally and staff salaries were below other sectors. To be competitive and reach the goal of 50 per cent of the college-age population enrolled in higher education, new
sources of revenue were needed. The policy change shifted some of the cost of higher education from taxpayers, who were paying for over 70 per cent of post-secondary education, to graduates, who benefit greatly from increased employability after university. The United Kingdom is a complex case study, partly due to the fast-paced nature of the changes to higher education funding, but also because the components of the U.K. — Scotland, Northern Ireland, Wales and England — set their own rules within the overall framework of higher education. This section, therefore, looks only at universities in England itself.
EDUCATION PRIMER Ninety per cent of children in primary and secondary education in England attend state schools, which follow a national curriculum and are financed by national and local taxes. At the age of 16, most students write General Certificate of Secondary Education exams. At that point, some students leave school, some go to technical college and the remainder continue at high school for two more years and to take Advanced Level exams to qualify for university. About 40 per cent of students are routinely denied admission to their first choice institution (Vossenstyn, 2000), suggesting a high demand for higher education in Britain.
Post-secondary education in England comprises two main sectors: higher education (universities and former polytechnic institutions) and further education (vocational training and tutorial colleges). There are 76 universities in England (including the Open University, which has an “open” admissions system) and 52 “other higher education institutions,” with over two million students enrolled. About 41 per cent of graduating secondary students enter post-secondary education at the university level and 25 per cent enter at the non-university level (Greenaway and Haynes, 2000). The total number of students
28
C H A N G E S I N T U I T I O N P O L I C Y: N AT U R A L P O L I C Y E X P E R I M E N T S I N F I V E C O U N T R I E S
enrolled in higher education increased by over 50 per cent between 1990 and 1996. However, barriers to access by socioeconomic group remain. While four out of five 18-year olds from senior managerial and professional backgrounds enter higher education, barely one in ten from unskilled and partly skilled backgrounds do (Greenaway and Haynes, 2000). Expenditure on universities in the U.K. as a percentage of GDP is the lowest of all industrialized countries, at just 1.0 per cent of the GDP, compared to 1.7 per cent for the other member countries of the Organization for Economic Cooperation and Development overall and just over a third of what the U.S. invests (2.7 per cent) (OECD, 2003). Per-student expenditure ($7,225) in the U.K. in 1995 was 60 per cent of the average for the OECD ($12,018). By comparison, the U.S. spending per student was at $19,965, although less than half of that comes from public funding. Public funding comes primarily in the form of block grants and indirect support through fees paid by Local Education Authorities for low-income students, and from annual block grants from the Higher Education Funding Council for England, of which about 85 per cent goes to universities. A further five per cent comes from funds to encourage enrolment by students from neighborhoods with historically low higher education participation rates. Meanstested grants and student loans provide indirect public funding to universities. Overall, 72 per cent of student costs were funded by public resources in 1995 (Greenaway and Haynes, 2000).
In 1997 the government proposed that students should make a contribution to the costs of their post-secondary education to take the burden off lower-income taxpayers. (On average those with a higher education qualification earn around 50 per cent more than non-graduates.) (The Future of Higher Education, 2003.) The maximum tuition fee is £1,100, covering between 20–25 per cent of the average cost of a student’s education (Barr, 2003). Means-tested grants are available to cover up to the entire amount of tuition. Thirty-six per cent of total public expenditure on higher education is allocated to financial aid for students (including student loans), the highest percentage of OECD countries (Future of Higher Education, 2003). Over £400 million in public funding is spent to pay the fees in full for families with incomes below £20,000 and in part for those with incomes between £20,000 and £30,000.
POST-SECONDARY TRENDS Because the introduction of tuition is relatively new in the U.K., it is not clear whether it has had an impact on enrolment. As can be seen in Figure 18, full-time university enrolment stayed relatively flat before, during and after the introduction of fees before the 1999–00 academic year. In 2001–02, enrolment did increase by three per cent. Part-time enrolment increased 20 per cent during the 2000–01 year, and 9 per cent in 2001–02. It’s possible the part-time increase consists of individuals switching to part-time because of the increase in cost.
INTRODUCTION OF TUITION FEES: ENGLAND
29
1,200,000
13,500 Tuition Introduction
Enrolment
1,000,000
13,000
800,000
12,500
600,000
12,000
400,000
11,500
200,000
11,000
Expenditure per full-time student
FIGURE 18: U.K. FULL- AND PART-TIME UNIVERSITY ENROLMENT TRENDS, PLUS HIGHER EDUCATION EXPENDITURES PER STUDENT, 1995–96 TO 2001–02
10,500
95–96 Full-time
96–97
97–98
98–99
Part-time
99–00
00–01
01–02
Expenditures per FT student
Source: Higher Education Statistics Agency (HESA) On-Line Information Services. (www.hesa.ac.uk/holisdocs/pubinfo/stud.htm). Table 0a — All Students by Institution, Mode of Study, Level of Study, Gender and Domicile 2001/02; Income and Expenditure data files (http://www.hesa.ac.uk/holisdocs/pubinfo/fin.htm)
Between 1994–95 and 2000–01, expenditures for higher education increased from £11.3 billion to £13.5 billion (constant 2001 pounds), an increase of 18 per cent. The three largest annual increases occurred in the year tuition was introduced and the two years following (1998–99 to 2000–01). Data for 2001–02 were unavailable for this analysis. Total average expenditures per full-time university student went up considerably after the policy shift (six per cent in 1999–00 and four per cent in 2000–01).
DISCUSSION The trend lines are short for British data, but it seems the introduction of student fees has had little impact on student enrolment in England. Higher education has certainly become more costly, on average, for students, but it is difficult to state how much
worse off lower-income students are. In the aggregate, more students are pursuing post-secondary degrees. What we do understand is that higher education in the U.K., as in most countries, has moved to a model of shared responsibility, getting more expensive for students and families and likely to continue to do so. However, the government is spending more per student than ever before and its maintenance grants for low-income students show political awareness toward underclasses in England. In January 2003, however, the secretary of state for education and skills proposed new public funding initiatives for academic year 2006–07. They would increase students’ contributions, but would abolish up-front payment of tuition fees and defer student contributions to after graduation through the tax system (The Future of Higher Education, 2003).
31
INTRODUCTION OF TUITION FEEs: Australia POLICY BRIEF Partial fees were standard in Australia until 1973 when they were eliminated except for some contributions to fund student facilities (Chapman, 2001). In 1986 an acrossthe-board user fee of $250 (in 1986 dollars) per student was introduced. (Unless otherwise noted, all dollars in this chapter refer to Australian dollars.) However, this relatively small fee was important in setting the stage for historic shifts in tuition policy in Australia. In response to dramatically rising postsecondary enrolment, the Labor government introduced the Higher Education Contribution Scheme (HECS) in 1986, which charged students about a quarter of the average cost of tuition (about $1,800 per year in 1989). The scheme also implemented the world’s first income-contingent loans, where students only had to repay their loans after their earnings reached a threshold of about $21,500 (1988 dollars) (Woodard, 2000). Students were not charged interest. The new approach was applied to all Bachelor’s programs but
not graduate work, continuing education or vocational and training courses. In December 1996, the Conservative government of Prime Minister John Howard approved a three-year, US$640-million cut in federal spending on universities. It also increased fees an average of 40 per cent. (As well, graduates had to start repaying loans at a much lower income threshold.) There were discounts for paying upfront. At the same time, different prices were introduced for different programs. The 1996 system is still in place, and the spring 2003 fee schedule is depicted in Table 2. Once universities meet their enrolment target for government-funded students, they may choose to offer places at full fees, up to a limit of 25 per cent of the number of places for domestic students in any given course. International students also pay full fees. A variety of grants, scholarships, bursaries and loans are available, as well as money to cover transportation, medical, pharmaceutical and remote area costs.
TABLE 2: TUITION BANDS FOR AUSTRALIAN UNIVERSITIES, SPRING 2003 BAND 1
$3,680
BAND 2
$5,242
Arts, Humanities, Social Studies/Behavioural Sciences, Education, Visual/Performing Arts, Nursing, Justice and Legal Studies Mathematics, Computing, other Health Sciences, Agriculture/Renewable Resources, Built Environment/Architecture, Sciences, Engineering/Processing, Administration, Business and Economics
BAND 3
$6,136
Law, Medicine, Medical Science, Dentistry, Dental Services and Veterinary Science
Source: (HECS, 2003) HECS Information 2003 (http://www.hecs.gov.au/pubs/hecs2003/default.htm)
C H A N G E S I N T U I T I O N P O L I C Y: N AT U R A L P O L I C Y E X P E R I M E N T S I N F I V E C O U N T R I E S
32
EDUCATION PRIMER colleges. In 1997, half of all 20- to 24-yearolds participated in some form of higher education (ICHEFAP, 2003). Sixty-five per cent of all entrants to university-level education successfully complete a first degree, slightly lower than the OECD average of 67 per cent (Greenaway and Haynes, 2000). The federal government funds public higher education. The expenditure per full-time student in Australian universities is $11,572, slightly lower than the OECD average of $12,018, but significantly higher than both Ireland ($7,249) and the UK ($7,225). About 65 per cent of the funding comes from public sources (Greenaway and Haynes, 2000).
Education in Australia is offered at both government and non-government schools and is compulsory from the age of six, but most children start a preparatory or kindergarten year at age five in government and non-government schools. State and territory governments have major responsibility for government school education and contribute substantially to non-government schools. The federal government provides additional funding. Secondary education is compulsory through age 15 in all states except Tasmania, where it extends to 16. At the post-secondary level, Australia has 38 universities, seven federally-funded colleges and one private university. There are also private institutions such as theological
FIGURE19: AUSTRALIAN HIGHER EDUCATION ENROLMENT, 1980 TO 2000
450,000
Number of Students
HECS
HECS II
Full-time
400,000
Part-time
350,000
External
300,000 250,000 200,000 150,000 100,000 50,000 0 1980
1982
1984
1986
1988
1990
1992
1994
1996
1998
2000
Source: Commonwealth Department of Education, Science, and Training (DEST). Higher Education Students Time Series Tables. Selected Higher Education Statistics 2000, http://www.detya.gov.au/highered/statistics/timeseries/’TBL 1’!B1
INTRODUCTION OF TUITION FEES: AUSTRALIA
33
POST-SECONDARY TRENDS
DISCUSSION
As Figure 19 shows, higher education enrolment, especially full-time, increased dramatically over the two decades beginning in 1980, when full-time enrolment more than doubled from 179,478 to 407,877 and parttime enrolment increased from 114,434 to 192,247 (68 per cent). In 1986, the introduction of the $250 fee was followed by significant increases in full-time enrolment — by nine per cent in 1987 and eight per cent in 1988. When the contribution scheme was introduced in 1989, charging a universal fee of approximately $1,800, enrolment increased by 7.4, 10.1, and 9.7 per cent in the next three years. It has never declined, although the rate of increase went down a bit between the years 1992 and 1994. In 1996, when cuts to higher education and a new fee structure dramatically increased the cost of university education, enrolment went up 4.8 per cent in 1996 and 5.1 per cent in 1997. Since then, enrolment has returned to nominal, one to two per cent increases. Cost increases, then, coincided with university enrolment rising by 25 per cent. The proportion of low socio-economic-status students did not change significantly as a result of price increases (Vossensteyn, 2000). The increase in student contributions corresponded with a significant decrease in government money for higher education, which dropped from 77.2 per cent of costs in 1989 to 53.8 per cent in 1997. Federal funding decreased further to 46 per cent in 2000. On a per-student basis, however, total operating revenue remained relatively constant between 1994 and 2000. Students made up the difference.
The implementation of the Higher Education Contribution Scheme in 1989 resulted from a growing demand for higher education caused by demographic shifts, a widely held view that the tax-funded system in place was regressive and across-the-board social program cuts (Chapman and Ryan, 2003). Despite Australia’s introduction of tuition in 1986 and increases in 1989 and 1996, university enrolment exploded across the country, perhaps because of the demographic changes, or perhaps because students knew that university was their ticket to greater opportunity. However, the increase was also supposed to encourage participation by low-income and Aboriginal people, through its various grant schemes and incomecontingent loan-repayment strategy. Andrews (1999) says no progress has been made by those groups and that participation of lowincome students has remained steadily low since the 1980s. Contrarily, Chapman and Ryan (2003) found that the system did not discourage students from participating in university, not even those from low-income backgrounds. In fact, enrolment in 1999 was more equal, by socio-economic status, than it was in the late 1980s. However, in June 2003, Australia announced that tuition fees at universities will be deregulated. The expected outcome of this is increases in tuition and fees, with students bearing most of the burden of these new costs.
35
Elimination OF TUITION FEEs: ireland POLICY BRIEF In 1996, Ireland abolished tuition fees for first-time students in full-time, approved undergraduate courses. The government’s decision to abolish undergraduate tuition in state-run institutions resulted from “widespread concern about the equity of the student grant schemes” (White Paper, 1995, p.106). The initiative aimed to remove psychological, as well as financial, barriers to participation. Fees were cut in half for the 1995/96 academic year, and the remainder cut the following fall. Students still pay fees to cover registration, examinations and student services, which can be as much as 600 to 800 Euros per year, a sizable sum. To qualify a student must be a first-time undergraduate, Irish or a national of another EU state; have lived in the EU for at least three of the five years before starting the course and not be repeating the year. Students enrolled at private colleges or in a second undergraduate program must pay tuition. Students who meet certain income criteria are open to maintenance grants and other special grants.
EDUCATION PRIMER There are approximately 3,200 publicly funded elementary and secondary schools which serve 98 per cent of Irish students. Secondary education is compulsory to age 15 and culminates in the Junior Certificate examination; 96 per cent of those who get the certificate proceed directly to either a
two-year Leaving Certificate program or to an optional Transition Year program followed by a two-year Leaving Certificate program (Department of Education and Science, 1995). The traditional leaving certificate prepares students for full access to post-secondary education, as does the Vocational program (but with vocational training as well). For the period 1996–1998, about 80 per cent of the age cohort completed the Leaving Certificate cycle (Clancy, 2001). About 40 per cent of the age cohort advanced to post-secondary education (Clancy, 2001). In 1998, a total of 32,724 students were admitted as new entrants to an undergraduate program in Ireland. In 1998, eight universities and 13 institutes of technology accounted for 93 per cent of all new entrants to the first year of an undergraduate program (45 and 48 per cent respectively) (Clancy, 2001).
POST-SECONDARY TRENDS In the last 50 years, Ireland has experienced a sixteen-fold increase in enrolment in its post-secondary education system, a larger increase than most of the rest of Europe (there was an eleven-fold increase in the U.K.). The growth reflects increasing retention rates in secondary school and demographic shifts such as significant growth in female enrolment. Public expenditure on higher education has also increased substantially in this time period, both in absolute terms and as a proportion of the total budget for education (White Paper, 1995).
C H A N G E S I N T U I T I O N P O L I C Y: N AT U R A L P O L I C Y E X P E R I M E N T S I N F I V E C O U N T R I E S
36
In Figure 20, the two sets of bars represent enrolment in primary (first) and secondary (second) education. The two lines represent Higher Education Authority (university) enrolment and total third-level (college and trades) enrolment, respectively. The figure clearly illustrates the consistent decline in primary school enrolment since 1990–91 and in secondary schools since 1996–97. Postsecondary enrolment, on the other hand, has increased four to five per cent per year for the past decade, a 75-per-cent increase in total.
600,000
140,000 “Free Fees”
120,000
500,000
100,000
400,000
80,000 300,000 60,000 200,000
40,000
100,000
20,000 0
0
HEA and total third level enrolment
First and second level enrolment
FIGURE 20: FULL-TIME ENROLMENT IN FIRST-, SECOND- AND THIRD-LEVEL EDUCATION, 1990–91 TO 2000–01
90–91 91–92 92–93 93–94 94–95 95–96 96–97 97–98 98–99 99–00 00–01 Total 1st Level
Total 2nd Level
H.E.A. Institutions
Total 3rd Level
Source: The Department of Education and Science, Statistics Section, www.education.ie
Figure 20 shows no evidence of a shift in enrolment before or after Ireland dropped tuition; rather, the proportion of 19-year-old students in full-time public education in Ireland has increased in all years except for 1995–96 and 2000–01 when it dropped one per cent. The worry, of course, is that without revenue from tuition fees, funding for postsecondary education will fall. In Figure 21,
two measures of expenditures are provided: total expenditures (solid line) and per pupil expenditures (bars). The year the tuition cut was implemented, total post-secondary spending increased by 14 per cent to 692 million, followed in the second year by a 23 per cent increase to 853 million. In 2000–01, the Irish government spent 1.3 million on postsecondary education.
E X A M I N AT I O N O F T U I T I O N F E E S : I R E L A N D
37
FIGURE 21: PUBLIC EXPENDITURES PER THIRD-LEVEL PUPIL/STUDENT AND TOTAL EXPENDITURES (IN MILLIONS), IN CONSTANT 2001 DOLLARS
1,400 “Free Fees”
7000
1200
6000
1000
5000
800
4000 600
3000 2000
400
1000
200
0
Total expenditure (in millions)
Expenditure per pupil/student
8000
0 90–91 91–92 92–93 93–94 94–95 95–96 96–97 97–98 98–99 99–00 00–01 Per Pupil
Total Expenditures
Source: The Department of Education and Science, Statistics Section, www.education.ie
DISCUSSION Tuition removal was designed to make education an avenue of opportunity for all students in Ireland and post-secondary enrolment is at an all-time high. The upward trend was on track before fees were cut, but it is possible the change in tuition policy kept it going even when secondary enrolment started falling. However, it has not solved the problem that working-class Irish don’t enrol in university. People from all socio-economic groups are going to university in greater numbers in Ireland, but the greatest increase in participation was among students from professional backgrounds. A reduction of over 2,000 per year has certainly increased the affordability of university, but critics claim the grants intended to support students during the school year are “inadequate as a realistic source of financial support for students from
disadvantaged backgrounds,” (Osborne and Leith, 2000, p. 23). The down side to free tuition is that it gives general subsidies, supporting students who can afford the cost of higher education at the cost of less aid for students and families who can’t. It remains to be seen how long Ireland can afford to carry the full cost of postsecondary education. As this report is being written, the Irish Prime Minister is floating the idea of reintroducing fees. Critics say that would lead to a brain-drain and discourage families who are sending children to university for the first time. Ireland’s free tuition policy is correlated to increased enrolment, even among the lowincome population. However, there is no evidence that the increases were caused by the cut in fees, since the trend was evident before the policy was introduced.
39
Tuition Experiments in a Decentralized Environment: United States POLICY BRIEF The United States, in contrast to most other countries in the world, has a highly decentralized — and quite diverse — system of post-secondary education. The federal government has no constitutional role in education; states operate the individual systems. As well, the U.S. also has a very strong private (non-governmental) higher education sector; in the fall of 2000, approximately 20 per cent of all undergraduates were enrolled in private institutions.8 This paper looks only at undergraduate tuition in public higher education. Public higher education institutions have historically subsidized tuition, keeping prices low in comparison to private universities. Over the last two decades, however, tuition prices have seen large increases relative to general inflation in the economy. From 1980 to 2001, tuition prices in public four-year institutions increased 363 per cent, while the Consumer Price Index (the general measure of inflation used in the country) increased only 115 per cent. Among the states, however, a number of quite different tuition-pricing strategies have evolved over the years, which have led to a broad range of prices for public colleges and universities. For example, this academic year, the tuition at flagship, research-intensive
public universities ranged from a low of $2,581 at the University of Florida to a high of $8,994 at the University of Vermont, with a median tuition of $4,196.9 In community colleges (two-year, or “associate degree” institutions), the prices ranged from $330 in California to $4,429 in New Hampshire, with a median of $1,806.
EDUCATION PRIMER Because the U.S. has separate education systems in its 50 states and its territories, a distinct U.S. perspective on post-secondary education is difficult. However, state-run education is more similar than it is different. For instance, all states have public education systems that run from kindergarten to grade 12, divided into elementary (K–5), middle (6–8) and high school (9–12). After high school, students may choose to attend public or private post-secondary institutions within their state or beyond, depending on their interest and ability to pay. In total, there are over 3,500 public and private non-profit institutions in the U.S., serving almost 15 million students each year (NCES, 2001). Of these, approximately 1,300 institutions serving 11 million students are publicly operated.
8. The private sector includes both non-profit and for-profit institutions. Of all undergraduates enrolled in private institutions in 2000, approximately 85 per cent were enrolled in non-profit colleges and universities. 9. All the tuition prices discussed here are for students who are residents of the state in which they attend college. Most public institutions charge a much higher rate for students who attend the university after attending high school in a different state. All figures are given in U.S. dollars.
C H A N G E S I N T U I T I O N P O L I C Y: N AT U R A L P O L I C Y E X P E R I M E N T S I N F I V E C O U N T R I E S
40
For the most part, post-secondary admissions are open, which means most students with high school graduation can gain access. However, 20 per cent of four-year post-secondary institutions are selective, and generally require students to write an entrance exam.
POST-SECONDARY TRENDS During the last economic recession in the United States in the late 1980s and early 1990s, tuition prices in many states increased quite rapidly. When the economy improved in the mid-1990s, some states began to reduce the rate of increase in prices, or in some cases, actually reduce prices, while other states continued increasing prices, though at a slower rate of growth. In this study, we examine the experiences of three states which increased their tuition prices at rates higher than the national average and compare them to the rest of the nation. The three states — California, Massachusetts, and Virginia — are the first, 12th and 13th
TABLE 3:
largest states in the U.S., ranked by population. During the recession, when tuition prices at flagship institutions increased 60 per cent from 1987 to 1994 in the other 47 states, the price at the University of California increased 195 per cent.10 Table 15 also shows the changes in tuition prices following the end of the recession, with prices decreasing or staying about the same in the three states, while prices continued to increase in the rest of the country. The three states decreased tuition when their economies improved by greatly increasing appropriations to higher education in order either to cut tuition prices or hold them constant. The hope was that lower prices would encourage students who had not enrolled due to the price increases of earlier years. This policy response on the part of the three states was consistent with the existing research of the impact of tuition prices on college enrolment,11 which, as already discussed, shows that other things being equal, rising tuition prices tend to depress college enrolments. We have plotted
PER CENT TUITION CHANGES, CALIFORNIA, MASSACHUSETTS, VIRGINIA AND ALL OTHER STATES, 1987 TO 2001 (BASED ON CONSTANT 2001 DOLLARS)
1994 TO 2001
1987 TO 1994 Flagship Institutions California Massachusetts Virginia All other States
195% 173 89 60
Other 4-year Community Institutions Colleges
142% 161 73 70
290% 163 78 72
Flagship Institutions
(5%) (5) (5) 55
Other 4-year Community Institutions Colleges
2% (3) 0 47
(15%) (7) (15) 35
Source: Washington Higher Education Coordinating Board. (various years). Washington state tuition and fee report. Olympia: Author.
10. “1987” refers to the 1987–1988 academic year. 11. For reviews of this literature, see L. L. Leslie & P. T. Brinkman (1988). The Economic Value of Higher Education. New York: American Council on Education/Macmillan Publishing, and Heller, D. E. (1997). Student Price Response in Higher Education: An Update to Leslie and Brinkman. Journal of Higher Education, 68(6), 624–659. Other factors than just tuition prices affect whether students enrol in college or not. This will be discussed later in this section.
T U I T I O N E X P E R I M E N T S I N A D E C E N T R A L I Z E D E N V I R O N M E N T: U N I T E D S TAT E S
enrolment and tuition price data for the last decade (up to the most recent data available), to examine trends in each state, then compared data from the remaining 47 states. Figure 22 shows the trend data for the state of California. Total undergraduate enrolment in public colleges and universities is plotted by the heavy line (and marked on the left axis), and the average tuition price paid is plotted by the lighter line in current and real dollars (and marked on the right
41
axis). The tuition prices are the average tuition prices paid, weighted by the enrolment in each institution or sector.12 As the recession continued in the early 1990s, tuition prices rose, with the average price paid by all students increasing from approximately $620 to a high of $950 in 1995. When times got better, the three public systems in the state — the University of California, the California State University and the California community colleges reduced their tuition prices.
FIGURE 22: ENROLMENT AND TUITION PRICE TRENDS IN CALIFORNIA, 1992 TO 2001
2,100,000
$1,200
2,000,000
$1,100 $1,000
1,900,000
$900 1,800,000 $800 1,700,000
$700
1,600,000
$600
1,500,000
$500 1992
1993
1994
1995
1996
1997
Total Enrolment
1998
1999
2000
2001
Average Tuition—2001 $
Source: Washington Higher Education Coordinating Board. (various years). Washington state tuition and fee report. Olympia: Author, and California Post-secondary Education Commission. (2003). CPEC student data [on-line data file]. Sacramento: Author. Retrieved, from the World Wide Web: http://www.cpec.ca.gov/OnLineData/FindRpt.asp
12. The average tuition price (and year-to-year change) is determined not just by the prices set in each sector, but also by the distribution of enrolment among the sectors. If enrolment in community colleges, which charge lower prices, grow faster than in four-year institutions, than the average price will be reduced (all other things being equal).
C H A N G E S I N T U I T I O N P O L I C Y: N AT U R A L P O L I C Y E X P E R I M E N T S I N F I V E C O U N T R I E S
42
The result of this agreement can be seen beginning in 1996. The average price paid (in current dollars) by an undergraduate attending one of the public institutions in the state declined in four of the next five years. In real dollars, after taking inflation into account, the average price fell 13 per cent from 1995 through 2001. Enrolment from 1995 increased by almost one-third by 2001, from approximately 1.6 million to 2.1 million students.
The patterns in Massachusetts and Virginia were similar (Figure 23 and Figure 24). Like California, Massachusetts began cutting prices in 1996, with decreases in all three sectors. Prices in Massachusetts also fell 13 per cent (26 per cent in real terms) from 1995 to 2001. At the same time, enrolment increased 22 per cent during this period, from a low of approximately 180,000 to 220,000 undergraduate students.
FIGURE 23: ENROLMENT AND TUITION PRICE TRENDS IN MASSACHUSETTS, 1992 TO 2001
$4,200
250,000
$4,000 230,000
$3,800 $3,600
210,000
$3,400 $3,200
190,000
$3,000 $2,800
170,000
$2,600 150,000
$2,400 1992
1993
1994
1995
1996
1997
Total Enrolment
1998
1999
2000
2001
Average Tuition—2001 $
Source: Washington Higher Education Coordinating Board. (various years). Washington state tuition and fee report. Olympia: Author; Massachusetts Board of Higher Education. (2003). Fall 2002 admissions and enrolment summary report. Boston: Author; Massachusetts Board of Higher Education. (2003). Massachusetts public higher education system annual (12 month) unduplicated enrolment undergraduate and graduate 1992–1993 to 2000–2001 [on-line data file]. Boston: Author. Retrieved, from the World Wide Web http://www.mass.edu; Massachusetts Board of Higher Education. (2003). Tuition and fees — 1988–2000 [on-line data file]. Boston: Author. Retrieved, from the World Wide Web http://www.mass.edu.
T U I T I O N E X P E R I M E N T S I N A D E C E N T R A L I Z E D E N V I R O N M E N T: U N I T E D S TAT E S
43
In Virginia, tuition prices were frozen from 1996 to 1998. After a slight increase in 1999, prices were cut approximately 20 per cent in both four-year institutions and community colleges in 2000, and were held there for two years. Enrolment in Virginia also grew coincident with the tuition freeze and reduction, increasing 16 per cent from approximately 250,000 students in 1995 to 290,000 students in 2002.
FIGURE 24: ENROLMENT AND TUITION PRICE TRENDS IN VIRGINIA, 1992 TO 2002
$2,600
300,000
$2,400
290,000
$2,200 280,000
$2,000 $1,800
270,000
$1,600
260,000
$1,400 250,000
$1,200
240,000
$1,000 1992
1993
1994
1995
1996
1997
1998
Total Enrolment
1999
2000
2001
2002
Average Tuition—2001 $
Source: State Council of Higher Education for Virginia (2003). 2002-2003 tuition and fees at Virginia’s statesupported colleges and universities. Richmond: Author, and State Council of Higher Education for Virginia (2003). Enrolment trends at Virginia’s public colleges and universities. Richmond: Author.
Tuition prices are not the only things that affect enrolment. Other factors, including student aid, demographics and economic conditions, are also factors. To try to isolate the impact on enrolment of the tuition price policies implemented in these three states, one can treat them as a natural experiment by comparing the pattern in each to the remainder of the states in the nation. Figure 25 plots the same trend data for the other 47 states (including the District of Columbia).
In contrast to California, Massachusetts and Virginia, tuition prices in the remainder of the United States grew steadily from 1992 through 1999 (the last year for which national enrolment data were available). The annual increases during this period ranged from a low of 3.1 per cent to a high of 9.2 per cent. Also in contrast to the three experiment states, undergraduate enrolment dropped slightly, one per cent nationally from 1995 to 1999.
C H A N G E S I N T U I T I O N P O L I C Y: N AT U R A L P O L I C Y E X P E R I M E N T S I N F I V E C O U N T R I E S
44
FIGURE 25: ENROLMENT AND TUITION PRICE TRENDS IN REMAINING STATES, 1992 TO 1999
$3,250
8,000,000
$3,000
7,900,000
$2,750 7,800,000
$2,500
7,700,000
$2,250 $2,000
7,600,000
$1,750
7,500,000
$1,500 1992
1993
1994
1995
1996
Total Enrolment
1997
1998
1999
Average Tuition—2001 $
Source: National Center for Education Statistics. (2002). Digest of education statistics, 2001. Washington, DC: U.S. Department of Education; Quantum Research Corporation. (2003). CASPAR database system [on-line data file]. Bethesda, MD: Author. Retrieved, from the World Wide Web: http://caspar.nsf.gov; Washington Higher Education Coordinating Board. (various years). Washington state tuition and fee report. Olympia: Author.
Economic conditions also affect postsecondary enrolment. When jobs become more plentiful, the opportunity cost of going to college rather than working increases. In the 10 years beginning in 1992, unemployment rates in the three states mirrored the nation as a whole — declining steadily after the recession of the early 1990s, reaching their lowest point in 2000 and then starting to increase again with the current recession in the U.S. It does not seem that local economic conditions in the three states are the cause of the difference in enrolment patterns. Enrolment is also affected by the size of the 18- to 24-year-old population. Other things
being equal, one would expect post-secondary enrolment to rise as the size of the collegeage cohort increases. However, in the decade we’re looking at, the population cohort decreased from 1992 and bottomed out in the middle of the decade, only starting to climb back as the children of the baby boomers began to reach college age (see Figure 26). In California, Massachusetts and Virginia enrolment climbed the whole time. It’s difficult to make the case that demographics are what drove enrolment growth. Funding for student financial aid can also influence enrolment. Student aid in our study states of California, Massachusetts and
T U I T I O N E X P E R I M E N T S I N A D E C E N T R A L I Z E D E N V I R O N M E N T: U N I T E D S TAT E S
45
FIGURE 26: 18- TO 24-YEAR-OLD POPULATION IN THREE STATES AND REMAINING STATES (INDEX – 1992 = 100)
105 CA MA
100
VA
95
Rest of U.S.
90 85 80 75 1992
1993
1994
1995
1996
1997
1998
1999
Source: United States Bureau of the Census. (2003). 1990 to 1999 Annual time series of state population estimates by age and sex. Washington, DC: Author. Retrieved, from the World Wide Web: http://eire.census.gov/popest/archives/state/st-99-09.txt
Virginia did go up, even more than in the rest of the country, but the increases were smaller in magnitude than the tuition decreases (even when measured on a perstudent basis). The likely outcome is that the greater-than-average aid increases in the three states worked with tuition decreases to increase enrolment.
DISCUSSION There are too many factors affecting a decision to go to university to attribute the rise in college enrolment in the three states exclusively to tuition cuts. However, when compared to post-secondary enrolment in the rest of the nation during the same time, and
to economic and demographic conditions facing the three states, there is compelling evidence that the price cuts were at least in part responsible for the increasing enrolment experienced in California, Massachusetts and Virginia in the 1990s.
47
Summary and Discussion The ten case studies presented in this paper give ample opportunities to consider the impact of tuition policy on enrolment in higher education — but they fall short of permitting a summary conclusion that freezing, reducing or introducing tuition fees will have a predictable effect. The fact is, there are many complex social issues that influence a decision to attend university; tuition is just one of them. As the chart below shows, when tuition fees were frozen, reduced or eliminated, enrolment generally increased, although some times by only a small amount. Two countries ran counter to expectations: England, where enrolment increased slightly when tuition was introduced for the first time, and Australia,
where it rose dramatically despite large fee increases. This suggests that variation and trends in enrolment are the result of a complex interaction of factors, only some of them based on price. As well, some argue that tuition fees have a relatively small effect on enrolment because they typically represent the smaller cost of attending a post-secondary institution. For many students, housing, travel, books and other associated costs far outstrip the cost of tuition. There are four explanations for the findings in our report: competition, institutional choice, supply and demand, and demographics. None is specific to any one jurisdiction.
TABLE 4: SUMMARY OF POLICIES, EXPECTED ENROLMENT RESPONSES AND ACTUAL ENROLMENT RESPONSES, BY JURISDICTION EXPECTED ENROLMENT JURISDICTION
POLICY SHIFT
Ireland
Abolition
Quebec
Freeze
British Columbia
Freeze
England
Increase
Australia
Increase
Newfoundland & Labrador
Reduction
Manitoba
Reduction
Massachusetts
Reduction
California
Reduction
Virginia
Reduction
RESPONSE
ACTUAL RESPONSE
– marginal increase marginal increase
A COMPETITIVE MARKET In the U.S. higher education acts like an open, competitive market. Between private and public universities, and with many other states to choose from, U.S. students have a wide choice of schools in their price range.
For example, Virginia students have a choice of 96 public post-secondary institutions, 15 of which are universities (NCES, 2001). Even within the public sector prices fluctuate greatly, in part due to demand, and then there
48
C H A N G E S I N T U I T I O N P O L I C Y: N AT U R A L P O L I C Y E X P E R I M E N T S I N F I V E C O U N T R I E S
are 46 private four-year institutions within the state.13 Virginia, with a total population of 7 million (compared to Canada’s 30 million), has significantly more post-secondary education options than the whole of Canada. California students have a choice of 419 public institutions and 199 private institutions. Students in the U.S. have far more choice than in any other nation in the world, which allows for a price sensitivity that is not at play in other countries.
DEMAND-SIDE MARKET Demand can far outstrip the anticipated effect of price variations. In both England and Australia, where large-scale price increases were realized, enrolment should have been threatened. Certainly, in Australia, higher tuition was problematic for some students, but the dominant mindset seems to have been that they knew they needed credentials to get good jobs — in other words, the students clearly understood that the cost of not going to university was much higher than the cost of going. We can also see the evidence of demand in several jurisdictions where enrolment was increasing long before fees were reduced or frozen. Of course, in both England and Australia, capacity also grew so more people could get post-secondary education.
CONSTRAINED RESOURCES It is possible that enrolment doesn’t respond to price changes because of limits on capacity. Most post-secondary systems are government run, on limited budgets. They can’t expand infinitely to accommodate all those who want to attend. In an open-market system, this lag in supply would generally
raise the commodity, in this case, tuition. We see this with respect to Ivy-League institutions in the U.S., where demand is so high that universities can charge almost what they want, with tuition approaching US$40,000 per year. However, in a government-controlled, non-competitive system, the price may remain the same—even decline—without any possibility of enrolment increases because the spaces do not exist. When capacity is expanded, as in England and Australia, pent up demand means tuition increases don’t discourage students. Discussions with analysts in Canadian provinces, including Manitoba and Newfoundland, suggest the capacity problem trumps all other factors related to expanding opportunity, and is an increasing challenge for policymakers and administrators.
DEMOGRAPHICS Enrolment is also affected by demographic trends. Post-secondary enrolments have been on an upswing for the better part of two decades in most industrialized nations. Much of the new growth comes from individuals of lower- and middle-income backgrounds — those who either had no or limited access to post-secondary education before. Because these groups represent a large part of a nation’s population, a small change in participation rate among them can considerably increase post-secondary enrolment. On an aggregate basis, the enrolment rates of previously underrepresented groups are increasing. It was not the purpose of this study to explore that, but the impact of tuition increases on underrepresented groups is an important consideration in public policy. In fact, much of the public discussion about policy shifts in each of the jurisdictions in this
13. Public institutions are generally the most affordable institutions in the U.S. However, there are private institutions that provide enough need-based institutional aid that they can actually be a better bargain for students.
SUMMARY AND DISCUSSION
study, especially Ireland, England and Australia, is on affordability and widening participation for groups who traditionally have not participated in post-secondary education. However, evidence suggests that introducing tuition has not made a great deal of difference in the participation rates of underrepresented groups. In the U.K., the percentage of enrolment of students from ethnic minority groups increased from 9.7 per cent in 1994–95 to 11.5 per cent in 2001–02.14 In Australia, there is no evidence that increasing tuition discouraged students from participating in university, including those from low-income backgrounds (Chapman and Ryan, 2003).
CONCLUDING THOUGHTS Governments play with tuition to effect a number of outcomes. Some want to encourage enrolment, some to reduce costs for students, while others wish to reduce taxpayer burden. In jurisdictions where freezes, reductions or abolition took place, the policy was about reducing the overall cost to students and families, and partially about increasing enrolment, access or both. In England and Australia, the policy debate centred on striking a balance between private and public responsibility for higher education, finding ways to reduce the burden on taxpayers, and affording a globallycompetitive system of higher education. Tuition cuts, however, can reduce the quality of education even as they make it more affordable. Freezes, reductions or elimination of fees can potentially leave the university with less money to do its work. Most governments will increase the transfers to the institutions to make up for this gap in funding. However, this is not always the case. In the
49
Canadian provinces where tuition was frozen or reduced, there were both increases and decreases in per-student expenditures. In the provinces where per-student funding was cut, there has been widespread concern about the quality of education (DohertyDelorme and Shaker, 2003). Larger class sizes, smaller faculties, less resources — these are all potential outcomes when budgets are cut. The same is true all over the world. These worries are rampant in Australia, the U.K., and the U.S. Gordon Winston, a well-known higher education economist, noted that during California’s effort to hold down public tuition fees in the 1990s, class sizes and the reliance on part-time and adjunct faculty members increased dramatically, as did cutbacks on course offerings. As Mr. Winston said, “It’s a quaint idea that somehow we can mandate prices without affecting quality” (Burd, 2003). Many consider higher education costs to be running out of control. The unfortunate reality is that our systems of finance may be as good as they ever get. The following figure illustrates two forecasts of tuition and fee charges at public U.S. universities, using enrolment-weighted baseline data from 2002–03. If a two-per-cent-above-inflation rate increase occurs, on average, tuition fees will double in the U.S. within 35 years. At four per cent above inflation, tuition will double in half that time. Both are quite conservative cost estimates; either way, the burden facing students will be twice as heavy in a relatively short period of time. And there isn’t much reason to think the trend to higher costs will derail. The impact of such increases could be limited by government-sponsored financial aid programs, but considering past trends, that’s unlikely to happen.
14. HESA Online Information Services (www.hesa.ac.uk/holisdocs/pubinfo/student/ethnic45.htm).
C H A N G E S I N T U I T I O N P O L I C Y: N AT U R A L P O L I C Y E X P E R I M E N T S I N F I V E C O U N T R I E S
50
FIGURE 27: INFLATION FORECAST OF TUITION AND FEE CHARGES AT U.S. FOUR-YEAR PUBLIC INSTITUTIONS, 2002–03 TO 2037–38
16,000
Tuition and Fee Charges
2% > Inflation 4% > Inflation Doubling Point
12,000
8,000 35yrs
18yrs
4,000 2002–03
2007–08
2012–13
2017–18
2022–23
2027–28
2032–33
2037–38
Academic Year Source: 2002–03 data from The College Board’s Trends in College Pricing 2002.
These trends are duplicated in other countries. If anything, the inflationary pressures are more severe in other industrialized nations, including Canada, Ireland, the U.K. and Australia. Other European and former Eastern Bloc nations will likely be hit hard as they shift from closed and highly selective universities to a more open system. Systems that make large-scale adjustments in tuition and fee charges need to remain committed to increasing the overall budgets of universities to ensure quality education. If governments continue to wean postsecondary institutions off public funds, the quality of education will surely suffer. Some jurisdictions and education systems are looking for more external support, such as research funding and other grants or gifts. In theory, this arrangement has merit.
In practice, the result has been a shift away from liberal arts courses and programs to those that are much more closely linked to the economy. With that kind of emphasis the risk is that higher education will become a higher form of vocational training. It is imperative that societies remain committed to higher learning in all its forms and to providing a quality education for all, while also working to control costs. This analysis has not dealt in any depth with the important issue of financial aid, although in most of the jurisdictions covered, financial aid programs changed along with tuition policy. The field would benefit from a more extensive look at the nexus between financial aid, tuition policies, enrolment trends and overall affordability measures.
51
APPENDIX 1: PRICE Sensitivity and post-secondary educATION In a typical market for a good or service, the price paid and the quantity purchased is determined by the intersection of the supply and demand curves. Demand curves are typically downward sloping — as the price of a good goes up, consumers purchase fewer of them. Supply curves, in contrast, are generally upward sloping — as price increases, producers are willing to supply more of the good or service. The intersection of the two, or the equilibrium point, determines the price and quantity in the market. If consumer demand for a good increases, the demand curve shifts outward, as shown below, from D0 to D1. Assuming no other changes in the market for the good, the effect of this shift is to establish a new equilibrium point, increasing both the price (from P0 to P1) and quantity (from Q0 to Q1) in the market. In a typical market, the increase in demand would result, after some lag, in a response on the part of suppliers. Existing producers may increase their capacity in order to supply more of the good to the market, and new suppliers would enter the market. This would result in an outward shift of the supply curve, from S0 to S1, thus establishing a new market equilibrium. This new equilibrium would reflect both a decrease in the price from the second equilibrium point (from P1 to P2) and a further increase in quantity (from Q1 to Q2).
PRICE SENSITIVITY PART I
Price
S0
Equilibrium point
P0
D0
0
Q0
Quantity
PRICE SENSITIVITY PART II
Price
S0
P1
New equilibrium point
P0
D1 D0
0
Q0
Q1
Quantity
C H A N G E S I N T U I T I O N P O L I C Y: N AT U R A L P O L I C Y E X P E R I M E N T S I N F I V E C O U N T R I E S
52
PRICE SENSITIVITY PART III
Price
S0 S1
P1 New equilibrium point
P2 P0
D1 D0
0
Q0
Q1
Q2
Quantity
PRICE SENSITIVITY PART IV
Tuition
S0 S 1
P1
New equilibrium
P2 P0
However, the supply of higher education is not like that of a typical good or service in the economy. Higher education has two important characteristics that distinguish it from other services: • The supply is much more inelastic than most good, i.e., the supply curve is more vertical and a shift upward in price results in a relatively smaller increase in the quantity producers are willing to supply. • There are relatively large barriers to entry to the higher education market. The first condition occurs largely because of the mission of most colleges and universities, whether government-controlled or private non-profit institutions. The mission of these institutions is not to maximize profits or even revenues, but rather, to achieve a certain level of quality in the provision of teaching, research and public service. Thus, since they are not profit- or revenue-maximizing entities, there is little incentive to increase the supply of higher education they are willing to provide.15
D1 D0
0
Q0 Q1 Q2
# of students attending college
15. This is not true, of course, of for-profit colleges and universities. As profix-maximizing firms, they do have incentives to increase the supply they are willing to provide as the price increases. However, the for-profit sector is a very small portion of the higher education market in most countries. In the United States, for example, this sector accounts for less than three per cent of enrolment (Digest of Education Statistics).
A P P E N D I X 1 : P R I C E S E N S I T I V I T Y A N D P O S T- S E C O N D A R Y E D U C AT I O N
The second condition, the barriers to entry, exists for two reasons. First, in most countries, governments control the licensing of tertiary education institutions. One cannot simply open up a university and offer degrees without government licensure authority. Non-governmental accrediting agencies, such as those found in the United States, also have authority over the ability of higher education institutions to qualify for government assistance in the form of student aid. Second, the costs of starting up a traditional college or university are relatively high and make it difficult for new providers to enter the market. The advent of wholly Internet-based institutions, however, is beginning to lower these barriers. Demand for higher education is on the increase in many countries, due largely to the demands of labour markets for more highlyeducated individuals. The college wage premium — the amount that a college graduate
earns compared to someone with only a high school diploma — has greatly increased over the last two decades. While there has been some response on the part of suppliers, it has not been nearly as great in magnitude as the increase in supply. The impact of these changes on the higher education market is shown below. The increase in demand is reflected in the shift outward of the demand curve from D0 to D1, causing an initial increase in the price (from P0 to P1) and quantity (from Q0 to Q1). Because the supply curve is relatively inelastic (more vertical) it’s unlikely to shift outward very much due to barriers to entry in the market. Thus, after producers do respond, the new equilibrium — with a price of P2 and quantity of Q2 — reflects a much larger proportional increase in the price than in the quantity, as compared with the original equilibrium points of P0 and Q0.
53
55
APPENDIX 2: Tables CANADA TUITION CHARGES, ENROLMENT FIGURES, DEMOGRAPHIC DATA AND FISCAL DATA FOR QUEBEC, 1990–91 TO 2001–02
TUITION TUITION CHARGES CHARGES (CURRENT) (CONSTANT)
FTE ENROLMENT
FULL-TIME
PART-TIME
20–24
FT ENROLMENT UNEMPLOYMENT RATE TO 20–24 AGE
PROVINCIAL EXPENDITURES (CONSTANT)
EXPENDITURES PER FT UNIV. STUDENT (CONSTANT)
1990–91
904
1,131
164,692
124,669 121,282
519,121
0.24
10.4
2,321,014
18,617
1991–92
1,311
1,588
169,501
129,993 119,722
502,740
0.26
12.1
2,382,671
18,329
1992–93
1,458
1,737
175,429
135,020 122,451
488,301
0.28
12.7
2,376,481
17,601
1993–94
1,550
1,827
176,625
137,750 117,804
478,944
0.29
13.3
2,485,256
18,042
1994–95
1,704
1,987
172,833
135,603 112,818
473,454
0.29
12.3
2,480,055
18,289
1995–96
1,703
1,951
168,932
132,927 109,106
473,206
0.28
11.4
2,364,414
17,787
1996–97
1,598
1,798
166,255
132,054 103,639
474,953
0.28
11.9
2,187,858
16,568
1997–98
1,803
2,006
164,411
131,074 101,021
482,252
0.27
11.4
2,274,763
17,355
1998–99
1,803
1,984
166,540
134,162
98,116
490,058
0.27
10.3
2,317,294
17,272
1999–00
1,813
1,948
169,751
137,224
98,566
2000–01
1,818
1,896
165,535* 133,268*
2001–02
1,842
1,889
170,550
139,563
499,648
0.27
9.3
2,136,506
15,569
97,779 * 507,194
0.26
8.4
2,101,326
15,768
93,900
0.27
8.7
2,155,437
15,444
513,246
* Enrolment data for 2000–01 in Quebec is not consistent with other years due to data collection problems at the Université de Montreal, resulting in a lower-than-normal enrolment count. Source: Statistics Canada, Annual Tuition and Additional Fee Survey; Statistics Canada, University Student Information System (USIS); Statistics Canada, CANSIM II, Tables 478-0004 and 478-0007; Statistics Canada, Labour Force Survey, Table 282-0002. ANNUAL PER CENT CHANGES IN TUITION CHARGES, ENROLMENT FIGURES, DEMOGRAPHIC DATA AND FISCAL DATA FOR QUEBEC, 1991–92 TO 2002–03
TUITION TUITION CHARGES CHARGES (CURRENT) (CONSTANT)
FTE ENROLMENT
FT ENROLMENT UNEMPLOYMENT RATE TO 20–24 AGE
PROVINCIAL EXPENDITURES (CONSTANT)
EXPENDITURES PER FT UNIV. STUDENT (CONSTANT)
FULL-TIME
PART-TIME
20–24
1991–92
44.9
40.5
2.9
4.3
-1.3
-3.2
7.7
1.7
2.7
-1.5
1992–93
11.2
9.4
3.5
3.9
2.3
-2.9
6.9
0.6
-0.3
-4.0
1993–94
6.3
5.2
0.7
2.0
-3.8
-1.9
4.0
0.6
4.6
2.5
1994–95
9.9
8.8
-2.2
-1.6
-4.2
-1.1
-0.4
-1.0
-0.2
1.4
1995–96
0.0
-1.8
-2.3
-2.0
-3.3
-0.1
-1.9
-0.9
-4.7
-2.7 -6.9
1996–97
-6.2
-7.8
-1.6
-0.7
-5.0
0.4
-1.0
0.5
-7.5
1997–98
12.9
11.5
-1.1
-0.7
-2.5
1.5
-2.2
-0.5
4.0
4.7
1998–99
0.0
-1.1
1.3
2.4
-2.9
1.6
0.7
-1.1
1.9
-0.5
1999–00
0.5
-1.9
1.9
2.3
0.5
2.0
0.3
-1.0
-7.8
-9.9
-2.9*
-0.8*
1.5
-4.3
-0.9
-1.6
1.3
4.7
-4.0
1.2
3.5
0.3
2.6
-2.1
2000–01
0.3
-2.7
-2.5*
2001–02
1.3
-0.4
3.0
* Enrolment data for 2000–01 in Quebec is not consistent with other years due to data collection problems at the Université de Montreal, resulting in a lower-than-normal enrolment count. Source: Statistics Canada, Annual Tuition and Additional Fee Survey; Statistics Canada, University Student Information System (USIS); Statistics Canada, CANSIM II, Tables 478-0004 and 478-0007; Statistics Canada, Labour Force Survey, Table 282-0002.
C H A N G E S I N T U I T I O N P O L I C Y: N AT U R A L P O L I C Y E X P E R I M E N T S I N F I V E C O U N T R I E S
56
TUITION CHARGES, ENROLMENT FIGURES, DEMOGRAPHIC DATA AND FISCAL DATA FOR BRITISH COLUMBIA, 1990–91 TO 2002–03
TUITION TUITION CHARGES CHARGES (CURRENT) (CONSTANT)
FTE ENROLMENT
FULL-TIME
PART-TIME
20–24
FT ENROLMENT UNEMPLOYMENT RATE TO 20–24 AGE
PROVINCIAL EXPENDITURES (CONSTANT)
EXPENDITURES PER FT UNIV. STUDENT (CONSTANT)
1990–91
1,808
2,260
48,509
42,096
19,433
235,617
0.18
8.6
760,791
18,073
1991–92
1,970
2,387
51,477
44,463
21,254
238,253
0.19
10.1
818,484
18,408
1992–93
2,128
2,535
52,422
45,649
20,524
245,053
0.19
10.2
803,394
17,599
1993–94
2,240
2,641
52,761
45,802
21,088
250,977
0.18
9.7
818,857
17,878
1994–95
2,434
2,839
54,853
47,696
21,687
254,336
0.19
9.0
842,646
17,667
1995–96
2,563
2,937
56,823
49,593
21,909
255,296
0.19
8.4
853,577
17,212
1996–97
2,577
2,901
59,160
51,566
23,013
260,376
0.20
8.7
864,983
16,774
1997–98
2,518
2,801
60,369
53,013
22,291
263,245
0.20
8.4
962,661
18,159
1998–99
2,525
2,778
61,534
54,039
22,711
262,335
0.21
8.8
974,321
18,030
1999–00
2,568
2,759
61,892
54,056
23,744
266,122
0.20
8.3
1,091,784
20,197
2000–01
2,592
2,703
62,200
54,218
24,189
269,186
0.20
7.2
1,168,809
21,558
2001–02
2,527
2,591
66,370
55,541
32,815
274,603
0.20
7.7
1,255,387
22,603
2002–03
3,165
3,165
62,212
62,212
—
281,167
0.22
8.5
—
—
Source: Statistics Canada, Annual Tuition and Additional Fee Survey; Statistics Canada, University Student Information System (USIS); Statistics Canada, CANSIM II, Tables 478-0004 and 478-0007; Statistics Canada, Labour Force Survey, Table 282-0002.
ANNUAL PER CENT CHANGES IN TUITION CHARGES, ENROLMENT FIGURES, DEMOGRAPHIC DATA AND FISCAL DATA FOR BRITISH COLUMBIA, 1991–92 TO 2002–03
TUITION TUITION CHARGES CHARGES (CURRENT) (CONSTANT)
FTE ENROLMENT
FULL-TIME
PART-TIME
20–24
FT ENROLMENT UNEMPLOYMENT RATE TO 20–24 AGE
PROVINCIAL EXPENDITURES (CONSTANT)
EXPENDITURES PER FT UNIV. STUDENT (CONSTANT)
1991–92
8.9
5.6
6.1
5.6
9.4
1.1
4.5
1.5
7.6
1.9
1992–93
8.0
6.2
1.8
2.7
-3.4
2.9
-0.2
0.1
-1.8
-4.4
1993–94
5.3
4.2
0.6
0.3
2.7
2.4
-2.0
-0.5
1.9
1.6
1994–95
8.7
7.5
4.0
4.1
2.8
1.3
2.8
-0.7
2.9
-1.2
1995–96
5.3
3.4
3.6
4.0
1.0
0.4
3.6
-0.6
1.3
-2.6
1996–97
0.5
-1.2
4.1
4.0
5.0
2.0
1.9
0.3
1.3
-2.5
1997–98
-2.3
-3.4
2.0
2.8
-3.1
1.1
1.7
-0.3
11.3
8.3
1998–99
0.2
-0.8
1.9
1.9
1.9
-0.3
2.3
0.4
1.2
-0.7
1999–00
1.7
-0.7
0.6
0.0
4.6
1.4
-1.4
-0.5
12.1
12.0
2000–01
0.9
-2.0
0.5
0.3
1.9
1.2
-0.8
-1.1
7.1
6.7
2001–02
-2.5
-4.1
6.7
2.4
35.7
2.0
0.4
0.5
7.4
4.8
2002–03
25.3
22.1
—
12.0
—
2.4
9.4
0.8
—
—
Source: Statistics Canada, Annual Tuition and Additional Fee Survey; Statistics Canada, University Student Information System (USIS); Statistics Canada, CANSIM II, Tables 478-0004 and 478-0007; Statistics Canada, Labour Force Survey, Table 282-0002.
A P P E N D I X 2 : TA B L E S
57
TUITION CHARGES, ENROLMENT FIGURES, DEMOGRAPHIC DATA AND FISCAL DATA FOR NEWFOUNDLAND AND LABRADOR, 1990–91 TO 2002–03
TUITION TUITION CHARGES CHARGES (CURRENT) (CONSTANT)
FTE ENROLMENT
FULL-TIME
PART-TIME
20–24
FT ENROLMENT UNEMPLOYMENT RATE TO 20–24 AGE
PROVINCIAL EXPENDITURES (CONSTANT)
EXPENDITURES PER FT UNIV. STUDENT (CONSTANT)
1990–91
1,344
1,680
13,800
12,472
4,023
50,407
0.25
16.9
185,237
14,852
1991–92
1,544
1,871
13,902
12,606
3,926
50,537
0.25
18.0
182,044
14,441
1992–93
1,700
2,025
14,515
13,068
4,385
50,738
0.26
20.2
194,627
14,893
1993–94
2,000
2,358
14,089
12,950
3,453
50,307
0.26
20.4
179,739
13,879
1994–95
2,150
2,508
14,106
13,174
2,823
48,614
0.27
20.2
174,064
13,213
1995–96
2,312
2,649
12,976
12,025
2,882
46,479
0.26
18.1
165,631
13,774
1996–97
2,701
3,041
13,054
12,335
2,179
44,414
0.28
19.3
152,008
12,323
1997–98
3,211
3,572
12,860
12,223
1,931
42,914
0.28
18.6
146,930
12,021
1998–99
3,216
3,539
12,763
12,133
1,909
40,810
0.30
18.0
152,099
12,536
1999–00
3,373
3,624
12,785
12,090
2,107
39,704
0.30
16.9
155,278
12,843
2000–01
3,373
3,517
12,877
12,239
1,932
38,697
0.32
16.7
153,434
12,536
2001–02
3,036
3,113
12,916
12,237
2,057
37,530
0.33
16.1
164,593
13,450
2002–03
2,729
2,729
13,273
12,562
2,156
36,730
0.34
16.9
—
—
Source: Statistics Canada, Annual Tuition and Additional Fee Survey; Statistics Canada, University Student Information System (USIS); Statistics Canada, CANSIM II, Tables 478-0004 and 478-0007; Statistics Canada, Labour Force Survey, Table 282-0002.
ANNUAL PER CENT CHANGES IN TUITION CHARGES, ENROLMENT FIGURES, DEMOGRAPHIC DATA AND FISCAL DATA FOR NEWFOUNDLAND AND LABRADOR, 1991–92 TO 2002–03
TUITION TUITION CHARGES CHARGES (CURRENT) (CONSTANT)
FTE ENROLMENT
FULL-TIME
PART-TIME
20–24
FT ENROLMENT UNEMPLOYMENT RATE TO 20–24 AGE
PROVINCIAL EXPENDITURES (CONSTANT)
EXPENDITURES PER FT UNIV. STUDENT (CONSTANT)
-2.8
1991–92
14.9
11.4
0.7
1.1
-2.4
0.3
0.8
1.1
-1.7
1992–93
10.1
8.2
4.4
3.7
11.7
0.4
3.3
2.2
6.9
3.1
1993–94
17.6
16.4
-2.9
-0.9
-21.3
-0.8
-0.1
0.2
-7.6
-6.8
1994–95
7.5
6.3
0.1
1.7
-18.2
-3.4
5.3
-0.2
-3.2
-4.8
1995–96
7.5
5.6
-8.0
-8.7
2.1
-4.4
-4.5
-2.1
-4.8
4.2
1996–97
16.8
14.8
0.6
2.6
-24.4
-4.4
7.3
1.2
-8.2
-10.5
1997–98
18.9
17.5
-1.5
-0.9
-11.4
-3.4
2.6
-0.7
-3.3
-2.5
1998–99
0.1
-0.9
-0.8
-0.7
-1.1
-4.9
4.4
-0.6
3.5
4.3
1999–00
4.9
2.4
0.2
-0.4
10.4
-2.7
2.4
-1.1
2.1
2.5
2000–01
0.0
-3.0
0.7
1.2
-8.3
-2.5
3.9
-0.2
-1.2
-2.4
2001–02
-10.0
-11.5
0.3
0.0
6.5
-3.0
3.1
-0.6
7.3
7.3
2002–03
-10.1
-12.3
2.8
2.7
4.8
-2.1
4.9
0.8
—
— —
Source: Statistics Canada, Annual Tuition and Additional Fee Survey; Statistics Canada, University Student Information System (USIS); Statistics Canada, CANSIM II, Tables 478-0004 and 478-0007; Statistics Canada, Labour Force Survey, Table 282-0002.
C H A N G E S I N T U I T I O N P O L I C Y: N AT U R A L P O L I C Y E X P E R I M E N T S I N F I V E C O U N T R I E S
58
TUITION CHARGES, ENROLMENT FIGURES, DEMOGRAPHIC DATA AND FISCAL DATA FOR MANITOBA, 1990–91 TO 2002–03
TUITION TUITION CHARGES CHARGES (CURRENT) (CONSTANT)
FTE ENROLMENT
FULL-TIME
PART-TIME
20–24
FT ENROLMENT UNEMPLOYMENT RATE TO 20–24 AGE
PROVINCIAL EXPENDITURES (CONSTANT)
EXPENDITURES PER FT UNIV. STUDENT (CONSTANT)
1990–91
1,512
1,890
25,031
19,698
16,162
83,281
0.24
9
323,966
16,447
1991–92
1,848
2,239
26,053
20,571
16,612
81,963
0.25
10
325,083
15,803
1992–93
2,160
2,574
26,189
20,575
17,013
81,434
0.25
10
320,471
15,576
1993–94
2,272
2,679
25,826
20,296
16,758
81,146
0.25
10
307,253
15,139
1994–95
2,393
2,791
27,188
22,962
12,806
80,617
0.28
9
292,508
12,739
1995–96
2,520
2,887
25,403
21,459
11,950
80,049
0.27
8
290,717
13,548
1996–97
2,689
3,027
29,374
23,576
17,571
79,587
0.30
9
288,956
12,256
1997–98
2,921
3,249
28,204
22,781
16,434
78,746
0.29
8
285,874
12,549
1998–99
3,149
3,466
28,066
22,629
16,476
78,103
0.29
9
305,128
13,484
1999–00
3,488
3,747
28,223
22,587
17,078
78,200
0.29
8
323,367
14,317
2000–01
3,219
3,356
29,321
23,403
17,933
77,956
0.30
7
363,040
15,513
2001–02
3,243
3,326
31,254
24,845
19,421
77,873
0.32
8
357,650
14,395
2002–03
3,248
3,248
33,473
26,247
21,897
78,432
0.33
9
—
—
Source: Statistics Canada, Annual Tuition and Additional Fee Survey; Statistics Canada, University Student Information System (USIS); Statistics Canada, CANSIM II, Tables 478-0004 and 478-0007; Statistics Canada, Labour Force Survey, Table 282-0002. Note:
Tuition data from 1997–98 to 2001–03 from the Council on Post-secondary Education (COPSE), Winnipeg, MB. This was substituted in for two reasons; first, data were available for 2002-03, which is important to the analysis of the Manitoba situations. Second, StatsCan data seems to undercount enrolment by about 15 per cent, which would influence our conclusions.
ANNUAL PER CENT CHANGES IN TUITION CHARGES, ENROLMENT FIGURES, DEMOGRAPHIC DATA AND FISCAL DATA FOR MANITOBA, 1991–92 TO 2002–03
TUITION TUITION CHARGES CHARGES (CURRENT) (CONSTANT)
FTE ENROLMENT
FULL-TIME
PART-TIME
20–24
FT ENROLMENT UNEMPLOYMENT RATE TO 20–24 AGE
PROVINCIAL EXPENDITURES (CONSTANT)
EXPENDITURES PER FT UNIV. STUDENT (CONSTANT)
1.5
0.3
-3.9
-2.8
0.1
-1.4
-1.4
-3.7
-0.5
-4.1
-2.8
1.3
11.6
-0.7
-4.8
-15.9
-6.7
0.4
-6.9
-0.6
-0.6
6.3
9.9
47.0
2.0
7.7
0.3
-0.6
-9.5
-3.4
-6.5
1.1
-4.4
-0.3
-1.1
2.4
-0.7
0.3
-0.3
-0.3
0.4
6.7
7.5
0.6
-0.2
3.7
1.4
-1.6
-0.5
6.0
6.2
3.9
3.6
5.0
1.2
2.4
-1.1
12.3
8.4
-0.9
6.6
6.2
8.3
2.0
4.1
0.5
-1.5
-7.2
-2.4
7.1
5.6
12.7
2.4
3.2
0.8
-100.0
-100.0
2.8
1.1
3.3
0.0
2.4
2.9
-1.4
-1.5
2.4
13.1
-23.6
-6.5
15.6 -4.0
6.7
-0.5
10.7
8.1
-7.7
-10.4
2001–02
0.8
2002–03
0.1
1991–92
22.2
18.5
4.1
1992–93
16.9
14.9
0.5
1993–94
5.2
4.1
-1.4
1994–95
5.3
4.2
5.3
1995–96
5.3
3.4
-6.6
1996–97
6.7
4.8
1997–98
8.6
7.4
1998–99
7.8
1999–00 2000–01
4.4
Source: Statistics Canada, Annual Tuition and Additional Fee Survey; Statistics Canada, University Student Information System (USIS); Statistics Canada, CANSIM II, Tables 478-0004 and 478-0007; Statistics Canada, Labour Force Survey, Table 282-0002. Note:
Tuition data from 1997–98 to 2001–03 from the Council on Post-secondary Education (COPSE), Winnipeg, MB. This was substituted in for two reasons; first, data were available for 2002–03, which is important to the analysis of the Manitoba situations. Second, StatsCan data seems to undercount enrolment by about 15 per cent, which would influence our conclusions. Thus, readers should be mindful of the large per cent increase in enrolment in 1996–97. This is a data issue and not a real change in enrolment.
A P P E N D I X 2 : TA B L E S
59
UNITED KINGDOM
ENROLMENT, PARTICIPATION, AND EXPENDITURES FOR HIGHER EDUCATION IN THE UK, 1995–96 TO 2000–01 UNIVERSITY ENROLMENT
PARTICIPATION
INCOME AND EXPENDITURES (CONSTANT 2001)
FTE ENROLMENT
FULL-TIME
PART-TIME
15-24 YEAR-OLD POPULATION
PER CENT OF FT STUDENTS VS. 15–24 YEAR-OLD POPULATION
1995–96
1,097,062
972,493
377,482
7,448,000
13%
11,450,293
11,330,467
11,651
1996–97
1,127,993
997,661
394,946
7,323,000
14%
11,603,479
11,445,880
11,473
1997–98
1,128,851
1,000,000
390,457
7,230,000
14%
12,025,705
11,693,933
11,694
1998–99
1,168,039
1,032,897
409,520
7,190,000
14%
12,355,457
12,164,001
11,777
1999–00
1,166,102
1,027,400
420,310
7,199,000
14%
12,868,229
12,846,074
12,503
2000–01
1,204,215
1,037,880
504,045
7,247,000
14%
13,493,919
13,544,483
13,050
2001–02
1,249,727
1,069,210
547,020
—
—
—
—
—
1996–97
3%
3%
5%
-2%
4%
1%
1%
-2%
1997–98
0%
0%
-1%
-1%
2%
4%
2%
2%
1998–99
3%
3%
5%
-1%
4%
3%
4%
1%
1999–00
0%
-1%
3%
0%
-1%
4%
6%
6%
2000–01
3%
1%
20%
1%
0%
5%
5%
4%
2001–02
4%
3%
9%
—
—
—
—
—
TOTAL INCOME
TOTAL EXPENDITURE
EXPENDITURES PER FT STUDENT
ANNUAL PER CENT CHANGE, 1996–97 TO 2001–02
Source: Higher Education Statistics Agency (HESA) On-Line Information Services. (www.hesa.ac.uk/holisdocs/pubinfo/stud.htm). Table 0a — All Students by Institution, Mode of Study, Level of Study, Gender and Domicile 2001/02; Higher Education Statistics Agency (HESA), Income and Expenditure data files (http://www.hesa.ac.uk/holisdocs/pubinfo/fin.htm)
C H A N G E S I N T U I T I O N P O L I C Y: N AT U R A L P O L I C Y E X P E R I M E N T S I N F I V E C O U N T R I E S
60
AUSTRALIA FTE, FULL-TIME AND PART-TIME ENROLMENT AT AUSTRALIAN UNIVERSITIES, 1981 TO 2000 ENROLMENT
ANNUAL PER CENT CHANGE
FTE
FULL-TIME
PART-TIME
EXTERNAL
TOTAL
FTE
FULL-TIME
PART-TIME
EXTERNAL
TOTAL
1981
217,900
178,826
118,405
39,471
336,702
0.3%
-0.4%
3.5%
10.8%
2.2%
1982
220,218
180,629
119,968
40,793
341,390
1.1%
1.0%
1.3%
3.3%
1.4%
1983
227,762
188,507
118,954
41,116
348,577
3.4%
4.4%
-0.8%
0.8%
2.1%
1984
234,833
195,787
118,320
43,266
357,373
3.1%
3.9%
-0.5%
5.2%
2.5%
1985
243,966
204,339
120,081
45,596
370,016
3.9%
4.4%
1.5%
5.4%
3.5%
1986
256,562
215,245
125,204
49,519
389,968
5.2%
5.3%
4.3%
8.6%
5.4%
1987
271,724
234,154
113,849
45,731
393,734
5.9%
8.8%
-9.1%
-7.6%
1.0%
1988
292,766
253,413
119,253
48,184
420,850
7.7%
8.2%
4.7%
5.4%
6.9%
1989
311,886
272,100
120,565
48,409
441,074
6.5%
7.4%
1.1%
0.5%
4.8%
1990
343,344
299,503
132,851
52,712
485,066
10.1%
10.1%
10.2%
8.9%
10.0%
1991
377,670
328,419
149,244
56,847
534,510
10.0%
9.7%
12.3%
7.8%
10.2%
1992
391,786
339,207
159,329
60,845
559,381
3.7%
3.3%
6.8%
7.0%
4.7%
1993
399,046
343,579
168,081
63,956
575,616
1.9%
1.3%
5.5%
5.1%
2.9%
1994
401,570
344,988
171,462
68,985
585,435
0.6%
0.4%
2.0%
7.9%
1.7%
1995
412,602
355,283
173,695
75,198
604,176
2.7%
3.0%
1.3%
9.0%
3.2%
1996
430,624
372,316
176,690
85,088
634,094
4.4%
4.8%
1.7%
13.2%
5.0%
1997
450,736
391,454
179,641
87,754
658,849
4.7%
5.1%
1.7%
3.1%
3.9%
1998
458,108
397,273
184,349
90,231
671,853
1.6%
1.5%
2.6%
2.8%
2.0%
1999
467,897
406,645
185,612
94,010
686,267
2.1%
2.4%
0.7%
4.2%
2.1%
2000
471,319
407,877
192,247
95,361
695,485
0.7%
0.3%
3.6%
1.4%
1.3%
Source: Selected Higher Education Statistics 2000, Department of Education, Training, and Youth Affairs, Commonwealth of Australia, 2001.
A P P E N D I X 2 : TA B L E S
61
UNIVERSITY EXPENDITURES FOR UNIVERSITY EDUCATION IN AUSTRALIA, 1994 TO 2001 (IN CONSTANT 2001 DOLLARS) CURRENT DOLLARS HIGHER EDUCATION FUNDING ACT GRANTS (EXCLUDING HECS) (OPERATING FUNDS)
SUB-TOTAL HECS
FEES AND CHARGES
OTHER
TOTAL OPERATING REVENUE
1994
3,989,168
877,660
741,878
1,274,673
6,883,379
1995
4,123,322
902,046
880,403
1,629,950
7,535,721
1996
4,361,511
932,780
1,077,934
1,679,357
8,051,582
1997
4,210,711
1,209,560
1,226,822
1,570,556
8,217,649
1998
4,040,528
1,450,988
1,355,833
1,608,342
8,455,692
1999
3,914,264
1,662,425
1,546,589
1,610,470
8,733,748
2000
3,912,870
1,675,697
1,697,446
2,041,654
9,327,667
2001
4,105,413
1,771,162
2,020,661
2,304,864
10,202,101
OTHER
TOTAL OPERATING REVENUE
CONSTANT 2001 DOLLARS HIGHER EDUCATION FUNDING ACT GRANTS (EXCLUDING HECS) (OPERATING FUNDS)
SUB-TOTAL HECS
FEES AND CHARGES
1994
4,788,416
1,053,503
890,517
1,530,060
8,262,496
1995
4,711,374
1,030,692
1,005,963
1,862,407
8,610,436
1996
4,908,966
1,049,862
1,213,236
1,890,149
9,062,213
1997
4,751,086
1,364,787
1,384,264
1,772,111
9,272,247
1998
4,488,002
1,611,680
1,505,987
1,786,461
9,392,130
1999
4,270,680
1,813,798
1,687,415
1,757,112
9,529,005
2000
4,035,054
1,728,023
1,750,451
2,105,407
9,618,935
2001
4,105,413
1,771,162
2,020,661
2,304,864
10,202,101
Source: Higher Education Annual Financial Reports, University Statistics Section, Department of Education, Science, and Training
C H A N G E S I N T U I T I O N P O L I C Y: N AT U R A L P O L I C Y E X P E R I M E N T S I N F I V E C O U N T R I E S
62
IRELAND ENROLMENT, PARTICIPATION AND EXPENDITURE DATA FOR THIRD-LEVEL EDUCATION IN IRELAND, 1990–91 TO 2000–01 ENROLMENT
PARTICIPATION IN FULL-TIME EDUCATION
FIRST LEVEL ENROLMENT
SECOND LEVEL ENROLMENT
H.E.A. ENROLMENT
THIRD LEVEL ENROLMENT
18 YEAR OLDS
1990–91
543,744
342,416
39,837
68,165
47.6
1991–92
534,269
348,917
43,741
74,449
1992–93
521,531
358,347
48,124
81,050
1993–94
505,883
367,645
51,343
1994–95
491,256
371,230
1995–96
478,692
369,865
1996–97
469,628
1997–98
EXPENDITURES TOTAL EXPENDITURES (MILLIONS)
19 YEAR OLDS
20 YEAR OLDS & OVER (9)
PER PUPIL
31.0
14.2
5,556
397
51.4
33.6
15.4
5,574
463
61.8
40.3
16.8
5,622
506
86,624
63.7
46.0
16.0
5,644
566
53,450
89,693
63.6
47.5
18.0
5,585
606
55,850
95,099
60.6
44.5
18.2
6,018
692
371,184
58,090
100,204
63.0
47.7
19.1
6,790
853
460,845
368,160
61,308
104,439
61.4
48.4
20.1
6,073
952
1998–99
452,533
362,051
63,737
108,509
63.2
47.3
20.5
6,477
1,010
1999–00
444,310
353,860
66,914
115,696
61.8
49.0
21.0
6,132
1,136
2000–01
439,560
345,384
69,254
119,991
62.1
48.0
21.0
6,287
1,267
Source: The Department of Education and Science, Statistics Section, www.education.ie
ANNUAL PER CENT CHANGE IN ENROLMENT, PARTICIPATION AND EXPENDITURES FOR THIRD-LEVEL EDUCATION IN IRELAND, 1990–91 TO 2000–01 ENROLMENT FIRST LEVEL ENROLMENT
SECOND LEVEL ENROLMENT
1991–92
-1.74
1992–93
-2.38
1993–94
PARTICIPATION IN FULL-TIME EDUCATION
H.E.A. ENROLMENT
THIRD LEVEL ENROLMENT
1.90
9.80
2.70
10.02
-3.00
2.59
1994–95
-2.89
1995–96 1996–97
EXPENDITURES
PER PUPIL
TOTAL EXPENDITURES (MILLIONS)
16.57
18 YEAR OLDS
19 YEAR OLDS
20 YEAR OLDS & OVER (9)
9.22
3.80
2.60
1.20
0.32
8.87
10.40
6.70
1.40
0.86
9.38
6.69
6.88
1.90
5.70
-0.80
0.39
11.71
0.98
4.10
3.54
-0.10
1.50
2.00
-1.05
7.21
-2.56
-0.37
4.49
6.03
-3.00
-3.00
0.20
7.75
14.09
-1.89
0.36
4.01
5.37
2.40
3.20
0.90
12.83
23.30
1997–98
-1.87
-0.81
5.54
4.23
-1.60
0.70
1.00
-10.56
11.64
1998–99
-1.80
-1.66
3.96
3.90
1.80
-1.10
0.40
6.65
6.02
1999–00
-1.82
-2.26
4.98
6.62
-1.40
1.70
0.50
-5.33
12.54
2000–01
-1.07
-2.40
3.50
3.71
0.30
-1.00
0.00
2.53
11.54
1990–91
Source: The Department of Education and Science, Statistics Section, www.education.ie
A P P E N D I X 2 : TA B L E S
63
UNITED STATES TUITION CHARGES, ENROLMENT FIGURES, DEMOGRAPHIC DATA AND FISCAL DATA FOR CALIFORNIA, VIRGINIA, MASSACHUSETTS, AND ALL OTHER US STATES (AGGREGATED), 1990–91 TO 2001–02 CALIFORNIA TUITION CHARGES
TUITION CHARGES (CONSTANT)
UNDERGRADUATE ENROLMENT (HEADCOUNT)
18–24 YEAR–OLD POPULATION
ENROLMENT PER 18–24 YEAR-OLD POPULATION
UNEMPLOYMENT RATE
STATE AID
STATE AID PER UNDERGRADUATE
1992–93
621
785
1,768,054
3,425,170
52%
9%
149,238
84
1993–94
856
1,054
1,628,271
3,327,546
49%
9%
207,969
128
1994–95
930
1,113
1,599,288
3,249,669
49%
9%
234,490
147
1995–96
948
1,105
1,591,710
3,170,388
50%
8%
235,582
148
1996–97
928
1,051
1,703,867
3,077,558
55%
7%
257,544
151
1997–98
938
1,044
1,719,171
3,013,123
57%
6%
284,410
165
1998–99
892
976
1,742,346
2,982,515
58%
6%
331,636
190
1999–00
845
899
1,821,911
3,050,146
60%
5%
369,785
203
2000–01
816
839
1,990,524
3,171,047
63%
5%
—
—
2001–02
827
827
2,094,324
3,318,684
63%
5%
—
—
VIRGINIA TUITION CHARGES
TUITION CHARGES (CONSTANT)
UNDERGRADUATE ENROLMENT (HEADCOUNT)
18–24 YEAR–OLD POPULATION
ENROLMENT PER 18–24 YEAR-OLD POPULATION
UNEMPLOYMENT RATE
STATE AID
STATE AID PER UNDERGRADUATE
1992–93
1,573
1,987
256,057
721,983
35%
6.4%
46,091
180
1993–94
1,828
2,250
251,722
702,968
36%
5.1%
45,309
180
1994–95
2,007
2,401
250,242
693,183
36%
4.9%
61,945
248
1995–96
2,078
2,421
248,866
685,233
36%
4.5%
54,646
220
1996–97
2,182
2,471
247,582
671,687
37%
4.4%
57,477
232
1997–98
2,174
2,420
255,853
659,229
39%
4.0%
74,400
291
1998–99
2,175
2,380
260,271
649,086
40%
2.9%
92,173
354
1999–00
2,206
2,345
267,566
648,469
41%
2.8%
103,301
386
2000–01
1,760
1,810
269,844
656,887
41%
2.2%
—
—
2001–02
1,754
1,754
281,122
673,268
42%
3.4%
—
—
MASSACHUSETTS TUITION CHARGES
TUITION CHARGES (CONSTANT)
UNDERGRADUATE ENROLMENT (HEADCOUNT)
18–24 YEAR–OLD POPULATION
ENROLMENT PER 18–24 YEAR-OLD POPULATION
UNEMPLOYMENT RATE
STATE AID
STATE AID PER UNDERGRADUATE
1992–93
2,869
3,624
219,098
710,201
52%
31%
46,091
210
1993–94
3,022
3,721
219,502
667,773
49%
33%
45,309
206
1994–95
3,449
4,128
179,627
631,306
49%
28%
61,945
345
1995–96
3,514
4,094
181,239
599,360
50%
30%
54,646
302
1996–97
3,367
3,814
200,154
567,346
55%
35%
57,477
287
1997–98
3,259
3,628
203,341
538,602
57%
38%
74,400
366
1998–99
3,140
3,435
213,058
511,122
58%
42%
92,173
433
1999–00
3,017
3,208
210,241
501,116
60%
42%
103,301
491
2000–01
2,996
3,080
217,615
505,584
63%
43%
—
—
2001–02
3,052
3,052
221,702
512,732
63%
43%
—
—
C H A N G E S I N T U I T I O N P O L I C Y: N AT U R A L P O L I C Y E X P E R I M E N T S I N F I V E C O U N T R I E S
64
TUITION CHARGES, ENROLMENT FIGURES, DEMOGRAPHIC DATA AND FISCAL DATA FOR CALIFORNIA, VIRGINIA, MASSACHUSETTS, AND ALL OTHER US STATES (AGGREGATED), 1990–91 TO 2001–02 (CONTINUED FROM PAGE 63) REMAINDER OF U.S. STATES TUITION CHARGES
TUITION CHARGES (CONSTANT)
UNDERGRADUATE ENROLMENT (HEADCOUNT)
18–24 YEAR–OLD POPULATION
ENROLMENT PER 18–24 YEAR-OLD POPULATION
UNEMPLOYMENT RATE
STATE AID
STATE AID PER UNDERGRADUATE
1992–93
1,898
2,398
7,985,468
21,977,490
36%
7.5%
1,920,184
240
1993–94
2,029
2,498
7,948,086
21,653,976
37%
6.9%
2,120,369
267
1994–95
2,144
2,566
7,953,170
21,401,884
37%
6.1%
2,452,551
308
1995–96
2,213
2,578
7,929,012
21,284,944
37%
5.6%
2,501,524
315
1996–97
2,416
2,736
7,854,877
21,080,185
37%
5.4%
2,641,687
336
1997–98
2,564
2,854
7,903,154
20,901,359
38%
4.9%
2,854,300
361
1998–99
2,668
2,920
7,734,537
20,699,887
37%
4.5%
3,074,368
397
1999–00
2,827
3,006
7,810,291
20,780,305
38%
4.2%
3,398,906
435
2000–01
2,914
2,995
8,061,666
21,142,683
38%
4.0%
—
—
Sources: United States Bureau of the Census. (2003). 1990 to 1999 Annual time series of state population estimates by age and sex. Washington, DC: Author; United States Bureau of Labor Statistics. (2003). Labor force statistics from the Current Population Survey; National Center for Education Statistics. (2002). Digest of education statistics, 2001; Quantum Research Corporation (2003). CASPAR database system; Washington Higher Education Coordinating Board. (various years). Washington state tuition and fee report; State Council of Higher Education for Virginia (2003). 2002–2003 tuition and fees at Virginia’s state-supported colleges and universities.; State Council of Higher Education for Virginia (2003). Enrolment trends at Virginia’s public colleges and universities; Massachusetts Board of Higher Education. (2003). Fall 2002 admissions and enrolment summary report; Massachusetts Board of Higher Education. (2003). Massachusetts public higher education system annual (12 month) unduplicated enrolment undergraduate and graduate 1992–1993 to 2000–2001; Massachusetts Board of Higher Education. (2003). Tuition and fees — 1988–2000; California Postsecondary Education Commission. (2003). CPEC student data.
65
References ---- (1995). Charting our education future. White paper on education. Higher Education Authority: Dublin. ---- (2001). Access Denied: Restoring the Nation’s Commitment to Equal Educational Opportunity. Washington, DC: Advisory Committee on Student Financial Assistance. ---- (2002). Summary of All Initiatives Funded By the Department to help Alleviate Educational Disadvantage. Department of Education and Science, Government of Ireland, Dublin, IR. (www.education.ie/servlet/blobservlet/si_summary_02.doc). ---- (2003). The Future of Higher Education. Department for Education and Skills. Higher Education Authority: Dublin, IR. Andrews, L. (1999), Does HECS Deter? Factors affecting university participation by low SES groups, Canberra: Department of Education, Training and Youth Affairs. Barr, N. (1998), The economics of the Welfare State, (3rd edition) Oxford: Oxford University Press. Barr, Nicholar (2001). Funding higher education: policies for access and quality. London, UK: House of Commons Education and Skills Committee. Post-16 Student Support, Sixth Report of Session 2001–2002, HC445, (TSO, 2002), pp. Ev 19–35. Bowlby, Jeffrey W., and McMullen, Kathryn (2002). At a Crossroads: First Results for the 18 to 20-Year-old Cohort of the Youth in Transition Survey. Ottawa, ON: Statistics Canada. Burd, Stephen (2003, May 2). “High Stakes on Tuition.” The Chronicle of Higher Education. Washington, DC. Volume 49, Issue 34, Page A29 California Post-secondary Education Commission. (2003). CPEC student data [on-line data file]. Sacramento: Author. Retrieved, from the World Wide Web: http://www.cpec.ca.gov/OnLineData/FindRpt.asp Chapman, Bruce (2001). Australian Higher Education Financing: Issues for Reform. Discussion Paper No. 434. Center for Economic Policy Research. Australian National University. Chapman, Bruce, and Ryan, Chris (2003). The access implications of income contingent charges for higher education: lessons from Australia. Discussion paper no. 463. Australian National University, Centre for Economic Policy Research. Clancy, P. (2001). College entry in focus: A fourth national survey of access to higher education. Higher Education Authority: Dublin. College Board, The. (2002). Trends in college pricing, 2002. Washington, DC: Author. Doherty-Delorme, Denise, and Shaker, Erika (2003). Missing Pieces IV: An alternative guide to Canadian post-secondary education. Ottawa, ON: Canadian Centre for Policy Alternatives.
66
C H A N G E S I N T U I T I O N P O L I C Y: N AT U R A L P O L I C Y E X P E R I M E N T S I N F I V E C O U N T R I E S
Federation des cegeps (2002). CEGEPs: Spearheading Québec’s Future Public College Network Development Plan. Montreal, QC: Federation des cegeps. Federation des cegeps (2003). Information from the federal des cegeps web site (www.fedecegeps.qc.ca/english/english_frame.html). Fisher, Donald, Rubenson, Kjell, and Mattia, Gerry Della (2001). Prospects for a Provincial Design of the British Columbia Post-Secondary Education System. Vancouver, B.C.: Centre for Policy Studies in Higher Education and Training, University of British Columbia. Flynn, S. and Oliver, E. (Feb. 26, 2001). “Concern at dropout rate among third-level students,” The Irish Times, p. A1. Government of Newfoundland and Labrador (2003). Beyond High School: Follow-up Study of June 2001 High School Graduates. Department of Youth Services and Post-Secondary Education (ISBN # 1-55146-195-1). Greenaway, D. and Haynes, M. (2000). Funding universities to meet national and international challenges. University of Nottingham. Heller, D. E. (1996). Tuition prices, financial aid, and access to public higher education: A statelevel analysis. Paper presented at the meeting of the American Educational Research Association, New York, NY. Heller, Donald E. (1997). “Student Price Response in Higher Education: An Update to Leslie and Brinkman.” Journal of Higher Education, 68(6), 625–659. Heller, Donald E. (1999). “The Effects of Tuition and State Financial Aid on Public College Enrolment.” Review of Higher Education, 23(1), 65–89. ICHEFAP (International Comparative Higher Education Finance and Accessibility Project) (2003). Database of Student-Parent Cost by Country: Australia. (www.gse.buffalo.edu/org/IntHigherEdFinance/region_australia_au.html). Jackson, G. A., and Weathersby, G. B. (1975). Individual demand for higher education. Journal of Higher Education, 46, 623–652. Jong, U. de, D. Webbink, H. Meulenbeek, M. Voorthuis,. F. Haanstra en F. Verbeek (1996), Uitstel of afstel? Een onderzoek naar de achtergronden en motieven om niet direct verder te studeren, Stichting voor Economisch Onderzoek (SEO) / SCO-Kohnstamm Instituut, Universiteit van Amsterdam, Amsterdam. Kane, T. J. (1991). College entry by blacks since 1970: The role of tuition, financial aid, local economic conditions, and family background. Unpublished doctoral dissertation, Harvard University. Kane, T. J. (1994). The causes and consequences of recent public tuition increases. Cambridge, MA: Monograph, Kennedy School of Government. Kane, T. J. (1995). Rising public college tuition and college entry: How well do public subsidies promote access to college? Cambridge, MA: National Bureau of Economic Research Working Paper Series No. 5164.
REFERENCES
LaRocque, Norman (2003). Who Should Pay? Tuition fees and tertiary education financing in New Zealand. Wellington, NZ: Education Forum. (http://educationforum.org.nz/documents/publications/who_should_pay.pdf). Leslie, L. L., and Brinkman, P. T. (1987). Student price response in higher education. Journal of Higher Education, 58, 181–204. Maslen, G. (2001, October 19). “Australian universities need money, panel says.” Chronicle of Higher Education (p. A44). Washington, DC. Maslen, Geoffrey (1996, December 20). “Australian academics say tuition hike will hurt enrolment.” Chronicle of Higher Education. Washington, DC. Maslen, Geoffrey (1997, February 7). “Applications to Australian universities plummet.” Chronicle of Higher Education. Washington, DC. Massachusetts Board of Higher Education. (2003). Fall 2002 admissions and enrolment summary report. Boston: Author Massachusetts Board of Higher Education. (2003). Massachusetts public higher education system annual (12 month) unduplicated enrolment undergraduate and graduate 1992–1993 to 2000–2001 [on-line data file]. Boston: Author. Retrieved, from the World Wide Web http://www.mass.edu Massachusetts Board of Higher Education. (2003). Tuition and fees — 1988–2000 [on-line data file]. Boston: Author. Retrieved, from the World Wide Web http://www.mass.edu McPherson, M. S. (1978). The demand for higher education. In D. Breneman and C. Finn (Eds.), Public policy and private higher education. Washington: The Brookings Institution. McPherson, M. S., and Schapiro, M. O. (1994). College choice and family income: Changes over time in the higher education destinations of students from different income backgrounds. Williamstown, MA: Williams Project on the Economics of Higher Education Discussion Paper No. 29. Michael, Christopher and Scully, Marny (1999). Rising Tuition Fees: Measuring the Impact Upon Undergraduate Enrolment in Ontario: 1977/78 to 1996/97. Paper presented at the Canadian Institutional Research and Practitioner Association (CIRPA) conference, October 24–26th, 1999, Quebec City, PQ. National Center for Education Statistics. (2002). Digest of education statistics, 2001. Washington, DC: U.S. Department of Education Osborne, R. and Leith, H. (2000). Evaluation of the targeted initiative on widening access for young people from socio-economically disadvantaged backgrounds. Higher Education Authority: Dublin. Quantum Research Corporation. (2003). CASPAR database system [on-line data file]. Bethesda, MD: Author. Retrieved, from the World Wide Web: http://caspar.nsf.gov Quebec (2002). Education Indicators: 2002 Edition. Quebec City, QC: Ministry of Education, Government of Quebec.
67
68
C H A N G E S I N T U I T I O N P O L I C Y: N AT U R A L P O L I C Y E X P E R I M E N T S I N F I V E C O U N T R I E S
Rouse, C. E. (1994). What to do after high school: The two-year versus four-year college enrolment decision. In R. G. Ehrenberg (Ed.), Choices and consequences: Contemporary policy issues in education. Ithaca, NY: ILR Press, 59–88. Savoca, E. (1990). Another look at the demand for higher education: Measuring the price sensitivity of the decision to apply to college. Economics of Education Review, 9(2), 123–134. Shires, M. A. (1995). The master plan revisited (again): Prospects for providing access to public undergraduate education in California (draft). Santa Monica: Rand Institute, DRU-965-LE. St. John, E. P. (1990). Price response in enrolment decisions: An analysis of the high school and beyond sophomore cohort. Research in Higher Education, 31(2), 161-176. State Council of Higher Education for Virginia (2003). 2002–2003 tuition and fees at Virginia’s state-supported colleges and universities. Richmond: Author. State Council of Higher Education for Virginia (2003). Enrolment trends at Virginia’s public colleges and universities. Richmond: Author. Statistics Canada (1996). After high school: the first years — The first report of the School Leavers Follow-up Survey. Ottawa, ON: Statistics Canada. Statistics Canada (2003). “Changing Patterns of University Finance.” Education Quarterly Review. Vol. 9, no. 2, p. 9–17. Sterken, E. (1995), De collegegeld-gevoeligheid van deelname aan het WO, Economisch Statistische Berichten, 10-5-1995, pp. 454–456. Swail, Watson S., Gladieux, Lawrence E., and Lee, John B. (2001). The California Dream and It’s Future: Indicators of Educational and Economic Opportunity in the Golden State. Rancho Cordova, CA: EdFund, Inc. United States Bureau of Labor Statistics. (2003). Labor force statistics from the Current Population Survey [on-line data file]. Washington, DC: U.S. Department of Labor. Retrieved, from the World Wide Web: http://www.bls.gov/cps/home.htm United States Bureau of the Census. (2003). 1990 to 1999 Annual time series of state population estimates by age and sex. Washington, DC: Author. Retrieved, from the World Wide Web: http://eire.census.gov/popest/archives/state/st-99-09.txt Vossensteyn, H. (2000). Cost-sharing and understanding student choice: Developments in Western Europe and Australia. A paper presented at the Global Higher Education Exchange Conference: Paying for Higher Education: Emerging Trends, Challenges and Solutions, AED Conference Center, Washington, DC, December 5–6, 2000. (http://www.gse.buffalo.edu/org/IntHigherEdFinance/textForSite/Vossensteynpaper11001.pdf)
REFERENCES
Walker, David (1997, August 1). “British government plans to end free tuition at universities,” The Chronicle of Higher Education. Washington, DC. Washington Higher Education Coordinating Board (2003). 2002–03 Washington state tuition and fee report. Olympia: Author. Woodard, Colin (2000, May 5). “Worldwide tuition increases send students into the streets.” Chronicle of Higher Education, (p. A54). Washington, DC.
DATA SOURCES
Canada Tuition and Fee Data All tuition and fee charges are enrolment-weighted counts of basic in-province arts tuition and fee charges. Both in and out-of-province students are included in the calculations for Quebec. Source: Statistics Canada, Annual Tuition and Additional Fee Survey; Manitoba tuition data from 1997–98 to 2001–03 courtesy of the Council on Post-secondary Education (COPSE), Winnipeg, MB. Enrolment Enrolments for full- and part-time university-level students. Full-time equivalency (FTE) calculated by author using the following formula: FTE = (1 x FT) + (.33 x PT). Source: Statistics Canada, University Student Information System (USIS). Population and Participation Rates Participation rate calculated by dividing University FTE total in a given year by the number of 20–24 year old students (male and female) in that same year. Source: Statistics Canada, Estimates of population, by age group and sex, Canada, provinces and territories (Table 051-0001). Expenditures Total expenditures on university education by direct source of funds and type of expenditures. Source: Statistics Canada, CANSIM II, tables 478-0004 and 478-0007. Unemployment Data Unemployment rates are for both sexes, 15 years and older. The unemployment rate is the number of unemployed persons expressed as a per centage of the labour force. Source: Statistics Canada, Labour Force Survey, Table 282-0002.
69
C H A N G E S I N T U I T I O N P O L I C Y: N AT U R A L P O L I C Y E X P E R I M E N T S I N F I V E C O U N T R I E S
70
United States Tuition and Fee Data (1) Washington Higher Education Coordinating Board. (various years). Washington state tuition and fee report. Olympia: Author (2) State Council of Higher Education for Virginia (2003). 2002-2003 tuition and fees at Virginia’s state-supported colleges and universities. Richmond: Author. (3) State Council of Higher Education for Virginia (2003). Enrolment trends at Virginia’s public colleges and universities. Richmond: Author. Unemployment (1) United States Bureau of Labor Statistics. (2003). Labor force statistics from the Current Population Survey [on-line data file]. Washington, DC: U.S. Department of Labor. Retrieved, from the World Wide Web: http://www.bls.gov/cps/home.htm Population (2) United States Bureau of the Census. (2003). 1990 to 1999 Annual time series of state population estimates by age and sex. Washington, DC: Author. Retrieved, from the World Wide Web: http://eire.census.gov/popest/archives/state/st-99-09.txt Enrolment (1) California Post-secondary Education Commission. (2003). CPEC student data [on-line data file]. Sacramento: Author. Retrieved, from the World Wide Web: http://www.cpec.ca.gov/OnLineData/FindRpt.asp (2) Massachusetts Board of Higher Education. (2003). Fall 2002 admissions and enrolment summary report. Boston: Author; (3) Massachusetts Board of Higher Education. (2003). Massachusetts public higher education system annual (12 month) unduplicated enrolment undergraduate and graduate 1992–1993 to 2000–2001 [on-line data file]. Boston: Author. Retrieved, from the World Wide Web http://www.mass.edu; (4) Massachusetts Board of Higher Education. (2003). Tuition and fees — 1988–2000 [on-line data file]. Boston: Author. Retrieved, from the World Wide Web http://www.mass.edu. (5) National Center for Education Statistics. (2002). Digest of education statistics, 2001. Washington, DC: U.S. Department of Education; Quantum Research Corporation. (2003). CASPAR database system [on-line data file]. Bethesda, MD: Author. Retrieved, from the World Wide Web: http://caspar.nsf.gov; Washington Higher Education Coordinating Board. (various years). Washington state tuition and fee report. Olympia: Author.
REFERENCES
Expenditures (1) National Association of State Student Grant and Aid Programs. (various years). NASSGAP annual survey report on state-sponsored student financial aid. Albany: New York State Higher Education Services Corporation. (2) United States Bureau of the Census. (2003). 1990 to 1999 Annual time series of state population estimates by age and sex. Washington, DC: Author. Retrieved, from the World Wide Web: http://eire.census.gov/popest/archives/state/st-99-09.txt.
Ireland Tuition and Fee Data Not applicable Enrolment Full-time enrolment in first, second, and third-level education, 1990–91 to 2000–01. Source: The Department of Education and Science, Statistics Section, www.education.ie Expenditures Expenditures of third-level students on a per pupil basis and total expenditures for third-level education. In constant 2001 dollars. Source: The Department of Education and Science, Statistics Section, www.education.ie Participation Rates Source: Report of The Action Group on Access to Third Level Education, Dublin, IR: Department of Education and Science. Table 2, page 33 (based on Clancy and Wall, 200, Table 15).
Britain Tuition and Fee Data Not applicable. Enrolment Undergraduate students only. Full-time equivalency (FTE) calculated by author using the following formula: FTE = (1 x FT) + (.33 x PT). Source: Higher Education Statistics Agency (HESA) On-Line Information Services. (www.hesa.ac.uk/holisdocs/pubinfo/stud.htm). Table 0a — All Students by Institution, Mode of Study, Level of Study, Gender and Domicile 2001/02.
71
C H A N G E S I N T U I T I O N P O L I C Y: N AT U R A L P O L I C Y E X P E R I M E N T S I N F I V E C O U N T R I E S
72
Population and Participation Rates Participation rate calculated by dividing University FTE total in a given year by the number of 15–24 year old students (male and female) in that same year. Source: Population Trends, Summer 2002, No. 108. National Statistics, Table 1.5, page 65, http://www.dundeecity.gov.uk/publications/poptrend.pdf Expenditures Source: Higher Education Statistics Agency (HESA), Income and Expenditure data files (http://www.hesa.ac.uk/holisdocs/pubinfo/fin.htm)
Australia Tuition and Fee Data Source: Higher Education Annual Financial Reports, University Statistics Section, Department of Education, Science, and Training Enrolment Source: Commonwealth Department of Education, Science, and Training (DEST). Higher Education Students Time Series Tables. Selected Higher Education Statistics 2000, http://www.detya.gov.au/highered/statistics/timeseries/'TBL 1'!B1 Expenditures University operating expenses before abnormal items by activity, type of expenditure and institution, 1992–2001. Source: Commonwealth Department of Education, Science, and Training (DEST). Higher Education Annual Financial Reports. (www.detya.gov.au/highered/statistics/finance/2001/finance2001.xls#Table01_2001!A1).