input data [Joughin, 2002] that are available at each output ... result, the resolution of the final product varies from ... quality, type, and amount of source data at each point, errors ... radians for the phase error, which is an approximate upper ..... Deceleration rates are determined by dividing the velocity differences by the time ...
JOURNAL OF GEOPHYSICAL RESEARCH, VOL. 107, NO. B11, 2289, doi:10.1029/2001JB001029, 2002
Changes in west Antarctic ice stream velocities: Observation and analysis Ian Joughin Jet Propulsion Laboratory, California Institute of Technology, Pasadena, California, USA
Slawek Tulaczyk Department of Earth Sciences, University of California-Santa Cruz, Santa Cruz, California, USA
Robert Bindschadler NASA Goddard Space Flight Center, Greenbelt, Maryland, USA
Stephen F. Price Department of Earth and Space Sciences, University of Washington, Seattle, Washington, USA Received 21 August 2001; revised 4 March 2002; accepted 18 April 2002; published 13 November 2002.
[1] We have produced a map of velocity covering much of the Siple Coast ice streams. The map confirms earlier estimates of deceleration on Whillans Ice Stream. Comparison with bed elevation data indicates that subglacial topography and the location of consolidated sediment play a strong role in determining the location of the tributaries feeding the ice streams. Force balance estimates based on these data indicate that the tributaries have beds nearly an order of magnitude stronger than those beneath many of the ice streams. We have used a theoretical analysis to examine the controls on fast flow. This analysis suggests that ice plains (very wide ice streams) are inherently unstable. This instability may be responsible for the current deceleration on the Ice Plain of Whillans Ice Stream and the shutdown of Ice Stream C 150 years ago. Thinning-induced reductions indriving stress may also explain some of the observed deceleration, particularly in upstream areas. The active portions of Ice Stream C coincide well with the areas where we estimate that melt should be taking place. Current topography and inferences of large thickening following a shutdown suggest the upstream migration of a stagnation front that initiated at the ice plain. Uncertainty remains about the basal conditions on Ice Stream D, while the basal resistance on Ice Stream E is large enough to ensure basal INDEX TERMS: 1827 Hydrology: Glaciology (1863); 0933 Exploration Geophysics: Remote melting. sensing; 1863 Hydrology: Snow and ice (1827); KEYWORDS: ice streams, ice sheets, Synthetic Aperture Radar Interferometry (InSAR), glaciology, Antarctica Citation: Joughin, I., S. Tulaczyk, R. Bindschadler, and S. F. Price, Changes in west Antarctic ice stream velocities: Observation and analysis, J. Geophys. Res., 107(B11), 2289, doi:10.1029/2001JB001029, 2002.
1. Introduction [2] Initial doubts about the stability of the West Antarctic Ice Sheet [Mercer, 1968] led to a large glaciological research effort aimed at better understanding the controls on fast flow and potential instabilities. The nature of the fast flow in the Siple Coast ice streams (Ice Streams A and C– F and Whillans Ice Stream) has been of particular interest, since these ice streams move at relatively fast speeds (400 m/yr) despite driving stresses at least an order of magnitude less than for typical outlet glaciers. This research has greatly improved the understanding of the dynamics of this marine ice sheet. Scenarios of catastrophic collapse in the next few
Copyright 2002 by the American Geophysical Union. 0148-0227/02/2001JB001029$09.00
EPM
centuries have been deemed less likely, though not completely ruled out [Alley and Bindschadler, 2001]. [3] The Siple Coast region has been the site of numerous field investigations involving collection of velocity data using both Doppler Transit and Global Positioning System (GPS) survey techniques. In addition, other sources of data have been used to infer significant temporal variability of the flow field over the last millennium [Retzlaff and Bentley, 1993; Jacobel et al., 2000; Fahnestock et al., 2000]. Despite these efforts, the velocity field of the Siple Coast ice streams has remained largely unmapped. In 1997, the RADARSAT-1 synthetic aperture radar (SAR) was maneuvered to a south-looking orientation for the first complete high-resolution (25 m) radar imaging of the entire continent [Jezek, 1999]. This mission lasted 30 days, and with a 24 day exactrepeat cycle, it provided 6 days of repeat coverage suitable for Satellite Radar Interferometry (SRI) estimation of ice
3-1
EPM
3-2
JOUGHIN ET AL.: CHANGES IN WEST ANTARCTIC ICE STREAM VELOCITIES
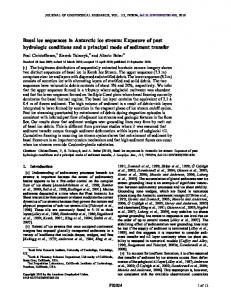
Figure 1. Velocity of Siple Coast ice streams shown on top of RAMP SAR mosaic [Jezek, 1999]. Speed is indicated by both color coding and 100 m/yr contours (black). Subsampled velocity vectors are shown with white arrows. Surface elevation from the RAMP DEM is shown with 100 m contours (gray). Ice streams and Crary Ice Rise (CIR) are identified with white text.
flow velocity. Several data takes from this mission were used to map velocity over much of the inland area of the ice streams, revealing a complex network of tributaries feeding the ice streams [Joughin et al., 1999]. We have now processed nearly all of the available data over this area to produce a map of velocity that covers nearly the full extent of the Siple Coast ice streams. RADARSAT-1 will not be maneuvered again to a south-looking orientation. Thus, the gaps that remain await the collection of further data by some future sensor. [4] This paper begins with a description of the data set and a comparison with previous measurements. We describe our application of standard force balance techniques [Van der Veen, 1999] to the ice streams and their tributaries. We conclude with an extended analysis of the velocity data in the context of tributaries, onsets, ice streams, and ice plains. In particular, we use the data in conjunction with the undrained plastic bed model [Tulaczyk
et al., 2000a] to investigate the stability of ice streams and ice plains.
2. Velocity Data [5] We have derived a map (Figure 1) of ice flow velocity for the Siple Coast ice streams using a combination of conventional interferometry and speckle-tracking methods applied to RADARSAT data collected during the first Antarctic Mapping Mission (AMM-1). On the downstream areas of Ice Streams D, E, and F, the map also includes data [Bindschadler et al., 1996] generated by tracking features visible in pairs of Landsat or other images. A small gap in the upper catchment of Ice Stream D was filled using GPS-derived velocities from a dense (5 km) survey grid [Chen et al., 1998]. A total of 19 interferometric pairs were used to generate the velocity map, which represents the substantial augmentation of an
JOUGHIN ET AL.: CHANGES IN WEST ANTARCTIC ICE STREAM VELOCITIES
earlier map [Joughin et al., 1999] that was based on only 4 interferometric pairs. [6] Only a brief discussion of the velocity estimation method is included here. A detailed description of the algorithms and software used to produce the map is given by Joughin [2002]. Conventional interferometry relies on the phase difference between pairs of SAR images to make precise estimates of the range displacement. Under an assumption of surface-parallel flow [Joughin et al., 1998; Mohr et al., 1998], data from ascending and descending passes can be combined to produce a vector velocity estimate. [7] The 24 day repeat cycle of RADARSAT provides a strong sensitivity to displacement that can result in unrecoverable unwrapped phase values in fast moving areas (i.e., >100 m/yr), where the phase becomes aliased or decorrelated. Fortunately, an alternate technique that relies on interferometric correlation has been developed [Michel and Rignot, 1999; Gray et al., 2000] that can provide data in faster moving areas. This technique, called ‘‘speckle tracking’’, takes advantage of the ability to determine with subpixel accuracy the displacements (both across- and along-track offsets) between scenes in an interferometric pair using the sharply peaked cross correlation of SAR speckle patterns. This technique has the advantage that it can provide vector measurements of displacement using data collected along only a single satellite-track direction. The disadvantage is that it has greatly reduced resolution and accuracy compared to conventional interferometry. In some cases, particularly those where phase data are only available for a single-track direction, we use a hybrid approach in which one component of velocity is determined from phase and the other from speckle-tracked displacement estimates. [8] The velocity is determined as the weighted sum of all input data [Joughin, 2002] that are available at each output grid point. To minimize error, the weights are inversely proportional to the estimated variances. Additional weighting is applied at the edges of each image (‘‘feathering’’) to reduce discontinuities at swath boundaries [Joughin, 2002]. The data are posted at 0.5 km intervals on a polar stereographic grid (71� standard latitude, 0� rotation). At this resolution, the interferometric phase data are well undersampled. The speckle-tracked data, however, are typically smoothed to a resolution of 1 –3 km to reduce noise. As a result, the resolution of the final product varies from roughly 0.5 to 3 km. [9] On the ice shelf, tidal effects need to be taken into account when estimating velocity. To compensate for tidal effects, we estimated the relative tidal displacement (�0.3 –0.9 m) from the interferometric phase across the grounding line. This estimate was used to remove most of the effect of tidal displacement. Residual tidal effects (