Serum antioxidative enzyme - ceruloplasmin content was determined by Ravin's method â according to paraphenyl- enediamine hydrochloric acid oxidation ...
МЕДИЦИНСКИЕ НОВОСТИ ГРУЗИИ CFMFHSDTKJC CFVTLBWBYJ CBF[KTYB
CHANGES OF LIPOPEROXIDATION AND ANTIOXIDATIVE ENZYMES DURING CRUSH-SYNDROME MODELLING Gamkrelidze N., 2SanikidzeT., 1Pavliashvili N., 1Petriashvili T., 1Topuridze M.
1
Tbilisi State Medical University, 1Department of Pathophysiology; 2 Department of Medical Physics and Biophysics, Georgia Crush-syndrome (CS) is characterized by numerous pathological deviations due to the soft (mainly muscular) tissues damage and their further reperfusion: sympathetic-adrenal system and oxidative processes violation, toxemia, water and electrolyte metabolism disorder. The vast majority of victims die of total hypoxia, central circulatory failure, liver and kidney failure [1,4,12,15,17]. Despite the fact that some information can be found about intensification of lipid peroxidation (LP) in crush syndrome [3,7,13,18], in most cases these studies do not provide full picture of LP mechanisms of CS [5]. Based on the above, the goal of our study was complex research of LP as well as changes in the antioxidative system during different regimens of CS. Material and methods. The experiments were carried out on randomly selected 40 laboratory rats (200-250g). Сontrol group consisted of 10 rats. Crush syndrome modeling was conducted by tightening of femoral muscles in the middle third of both hips during 3 or 6 hours in narcotized rats (by Ether). Investigations were conducted at various stages of postcompression period – immediately after decompression, 1 or 6 hours following a decompression. After the experiments the rats were killed by ether inhalation. Serum antioxidative enzyme - ceruloplasmin content was determined by Ravin’s method – according to paraphenylenediamine hydrochloric acid oxidation intensity on the spectrometer “Spectromom -202” [14].
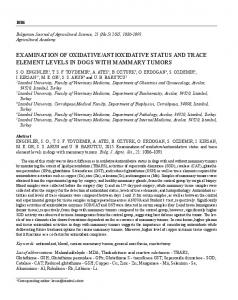
Spin traps were injected in rats intraperitoneally. After 10 minutes from injection of spin traps animals were killed. LOO.- and (O2-) EPR specters of spin trapped superoxide- and lipoperoxide free radicals were measured at room temperature, microwave power of 20 MW using radiospectrometer РЭ-1307. The obtained data was processed statistically with the use of Student t-test. Used statistical program IBM SPSS Statistics for Windows, Version 19.0. For all diagrams p0.05. Results and their discussion. On the Diagram 1 there is shown alteration of superoxide EPR signal intensity in rat’s blood during compression and decompression. As it is seen, after 3 hours of compression superoxide level increases and stays on this level during following 6 hours. After 1 hour from 3 hours compression superoxide EPR signal intensity increases by 30% that indicates on the increased intensity of free radical oxidation processes during decompression period. Decompression (6 hour) following long lasting compression (6 hours) is characterized by decreased intensity of oxygen free radicals production. This may be caused by lowered metabolism intensity in damaged tissues due to prolonged compression.
Oxidized Serum ceruloplasmin concentration was measured by the electronic paramagnetic resonance (EPR) method on radiospectrometer РЭ-1307 (Russia). Activity of catalase was determined by Aebi’s method, modified version by M.А. Koroluke [1,10]. Superoxidedismutase (SOD) activity was determined in Jurkat cell cultures by Fried method modyfied by E.V Makarenko [11]. Catalase and SOD activity were calculated on mg of total protein weight, deterrmined according O.H. Lowry method [1]. Lipoperoxides and Superoxide radicals level in blood was measured by electronic paramagnetic resonance (EPR) method. For detection of superoxide radicals (O2-) spin trap 5-(Diethoxyphosphoryl)-5-methyl-1-pyrroline-N-oxide [2,8,9] and for lipoperoxides (LOO.) - spin trap phenyltert butilnitrone (PBN) (SIGMA) were used respectively. 84
Diagram 1. Changes of O2-. (mm/mg) content (EPR signal intensity), p