University of Arkansas at. Little Rock ... Little Rock, AR USA. Denton, TX USA ..... Wireless LAN Cellsâ, Proceedings of IEEE ICC 2004, IEEE ICC, Paris,. France ...
The 18th Annual IEEE International Symposium on Personal, Indoor and Mobile Radio Communications (PIMRC'07)
CHANNEL ASSIGNMENT AND LOAD DISTRIBUTION IN A POWERMANAGED WLAN Mohamad Haidar University of Arkansas at Little Rock Little Rock, AR USA
Robert Akl University of North Texas Denton, TX USA
ABSTRACT For a Wireless Local Area Network (WLAN), we propose an algorithm based on power management of Access Points (APs) to improve load distribution and provide an improved channel assignment. We formulate an algorithm that adjusts the transmitted power of the beacon packets of the Most Congested Access Point (MCAP). The transmitted power of the data packets is not altered thus avoiding auto-rating. The algorithm then determines a user assignment that distributes the load efficiently. Finally, we apply a channel assignment algorithm to each AP with the objective of minimizing the total interference over the WLAN. Results show that the proposed algorithm is capable of significantly reducing the congestion at the MCAPs, providing better load distribution, and enhancing channel assignment. I.
INTRODUCTION
Minimizing congestion and judicious channel assignment in a WLAN has received significant attention in the past few years [1]-[4]. The authors in [1] and [2] proposed an approach of minimizing AP congestion in a WLAN by formulating it as an optimal Integer Linear Program (ILP). The objective is to minimize the most congested AP, which quantitatively represents congestion at a hot spot in a WLAN service area. By using a free-space propagation model to determine association of demand points with candidate APs, the WLAN design process can be easily performed. On the other hand, the authors in [1] formulated an ILP that included a channel assignment problem but did not take channel distance interference into account. In addition, the authors in [1] and [2] assumed the transmitted power by APs to be fixed at all times. In [3], the authors provided a load-balancing technique that allows a wireless station to join an AP depending on the number of already associated stations and the mean Received Signal Strength Indicator (RSSI). An AP updates its mean RSSI and the number of associated stations continuously in each beacon or probe response frame. The algorithm performed well under traffic consisting of three APs and 30 users. However, the algorithm was neither tested for larger networks nor dealt with individual power management of APs while balancing the load. Finally, the authors in [4] proposed a load-balancing scheme for overlapping wireless cells. Load Balancing Agents (LBA) running in each AP broadcast periodically the local load via the Ethernet backbone and determine whether the AP is overloaded, balanced or under utilized. Users in overloaded APs will be forced to dissociate from their corresponding AP, only to associate with under-loaded APs. Although the authors have shown experimentally that their
1-4244-1144-0/07/$25.00 ©2007 IEEE
Hussain Al-Rizzo University of Arkansas at Little Rock Little Rock, AR USA
Yupo Chan University of Arkansas at Little Rock Little Rock, AR USA
balancing scheme increases the total network throughput and decreases the packet delay, it did not take into account the power management of APs. In this paper, we propose solving an ILP optimization problem by adjusting the power transmitted by the MCAP as long as all users can be accommodated by the APs. Then the final transmitted power level on each AP is applied to allocate channels efficiently to the APs. The paper will show the performance of such a devised algorithm outperforms those described in [1] and [2] for various network topologies. The remainder of the paper is organized as follows. The load distribution algorithm is described in section II followed by the channel assignment algorithm in section III. In section IV, numerical results are discussed, and finally section V concludes the paper. II. THE LOAD DISTRIBUTION ALGORITHM We consider a WLAN consisting of a grid of M APs situated in a single-floor building. A set of randomly distributed N users seek to associate with an AP. At each instance, a user is identified by its data rate, U bits per second (bps) and location. The received power level at each user is evaluated using the No Line of sight (NLOS) commercial path loss model in (1) [5]: (1) PL(d) = PL0 +29.4log10(d) +6.1xα log10(d) +2.4y +1.3xy s , where PL0 is the free space path loss, d is the distance between user i and APj, and xa, xs, and y are mutually independent Gaussian random variables of zero mean and unit variance. We consider a user to be a candidate for association with an AP if the power received by that user exceeds a given threshold. One user may become a candidate for association with several APs. The algorithm described in this paper redistributes user’s association in an efficient way to minimize the load at the MCAP. By default, each user is associated with the AP of the highest Received Signal Strength Indicator (RSSI). The congestion factor at all M APs is then evaluated using (2). Once the MCAP is identified, its transmitted power at the beacon packet is decremented in discrete steps with the objective of minimizing the MCAPs in the network until one or more user’s demands can not be accommodated anymore or at least a user can not associate with an AP. It is important to mention that the transmitted power of data packets is not changed during the course of simulation thus avoiding any data rate change (auto-rating) of associated users. This approach is
The 18th Annual IEEE International Symposium on Personal, Indoor and Mobile Radio Communications (PIMRC'07)
intuitive and easy to implement. It only requires AP’s load which is easy to obtain. We define congestion as follows: Cj =
U
+U
1
2
+ ... + U
BW
N
j
,
(2)
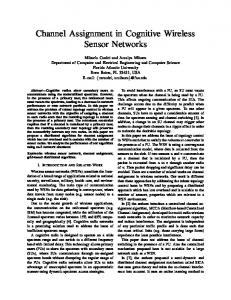
III. THE CHANNEL ASSIGNMENT ALGORITHM In IEEE 802.11 b/g WLAN, there exists 13 channels. Channels 1, 6 and 11 are non-overlapping, as shown in Fig. 1. Only channels 1-11 are used in the US spectrum.
j
where Cj is the congestion factor at APj, Ui is the average data rate for user i, BWj is the maximum available bandwidth, and Nj is the number of users associated with APj. The optimization software LINGO [6] is used to solve the ILP, which is described below (3): (3.1) min max {C 1, C 2,..., CM } , xij,1 ≤ i ≤ N
1≤ j≤M
N
subject to
∑x
ij
= 1 for all j ,
(3.2)
i =1
Ui • xij , i =1 BWj M
Cj = ∑
(3.3)
for j=1,…, M. Objective (3.1) minimizes the maximum congestion at the MCAP. Constraint (3.2) states that each user must be assigned to one-and-only-one AP. xij is a binary variable that is 1 when user i is assigned to APj and 0 otherwise. Constraint (3.3) defines the congestion factor of the APs. Initially, the transmitted power of each AP is set to its maximum value. Given the fixed locations of the APs and the random access by users, users associate with the AP of highest RSSI at any instance. This will help identify the MCAP. However, several users may have other association options where the received signal from other APs does not fall below a certain threshold. These users are considered potential candidates for association with other APs. A binary association matrix is constructed by comparing the received signal from each AP to a pre-defined threshold. A value of 1 in the matrix means user i may be a candidate for association with APj. An assignment is subsequently found for all users using equally-distributed power levels. The algorithm then identifies the MCAP from (2). Once the MCAP, which is the AP with the highest load utilization, is identified, its transmitted power is decremented by a step of 1 dBm. The received signal at all users from the MCAP is recomputed and a new binary association matrix is generated. This procedure continues until one or more users in the network can not associate with an AP or their demand can not be accommodated. The best solution is obtained in the last iteration. This is due to the fact that the load will be the most balanced before a user’s demand can no longer be accommodated. Thus, every time a MCAP’s load is minimized the load is distributed across other APs and by minimizing the MCAPs, the load tends to become more balanced. Note that the new MCAP may not be the same as the previous MCAP, and the average data rate of the defined users is kept constant over the period of simulation.
Figure 1: The three non-overlapping channels (red, green and purple) [7] Each channel spreads over 22 MHz due to the Direct Sequence Spread Spectrum (DSSS) technique employed by IEEE 802.11b/g. For instance, channel 1’s range is from 2.401 GHz to 2.423 GHz and its center frequency is 2.412 GHz, similarly for all other channels. The center frequency of two adjacent channels is separated by 5 MHz. Therefore, there is channel bandwidth overlap. The interference level factor is defined as follows:
1 − Chi − Ch j × c if wij ≥ 0 , wij = 0 otherwise
(4)
where Chi is the channel assigned to APi, Chj is the channel assigned to APj and c is the non-overlapping portion of two adjacent channels, expressed as a fraction of the frequency spectrum of a channel. For instance, channel 1 and channel 2 do not overlap from 2.401 GHz to 2.406 GHz, as shown in Fig. 1. Normalizing the overlap of 5 MHz over the spectrum of 23 MHz, c is equal to 1/5 approximately. When the channels are far apart, as is the case with channels 1 and 6, wij=0 (i.e., no interference). When the two channels are the same, wij=1 (i.e., maximum interference). Channels should be assigned to APs such that overlapping channel interference is minimized. However, there are limited channel resources (11 channels in IEEE 802.11 b/g). If the same channel is to be assigned to two or more APs which are located far enough from each others, the overlapping channel interference signal detected by each AP should be less than a given threshold. The interference between APi and APj is calculated as follows:
Iij =
wijPj , PL(dij )
(5)
where Iij is the interference that APj causes on APi , Pj is the transmit power of APj, PL is a function that captures the attenuation loss based on the propagation model described in (1) and dij is the distance between
The 18th Annual IEEE International Symposium on Personal, Indoor and Mobile Radio Communications (PIMRC'07)
APi and APj. We seek to assign channels that will minimize the total interference between APs subject to the constraints, as specified by (4) and (5): Qi
∑
(6) Min Iij , j =1 Chi where Chi is the channel assigned to APi and Qi is the cardinality of the set of neighboring AP’s surrounding APi. The load-distribution algorithm and the channel-assignment algorithm can be summarized as follows: 1. Compute the RSSI at each user from each AP using the path loss model in (1), 2. Associate users with APs with the highest RSSI and identify the MCAP. 3. Assign 1 in the binary association matrix for a user’s RSSI if it exceeds the threshold value, or 0 otherwise. 4. Redistribute users’ association by solving (3.1), (3.2) and (3.3). 5. Decrement the transmitted power of the beacon packet at the MCAP and repeat steps 1 through 4 until at least one user in the network cannot associate or its demand cannot be accommodated by any AP. 6. The last iteration, the one just before one user or more lose association with their APs, will be considered the one with the best power levels, best user’s association, and best load at APs. 7. Compute the interference between APs using the power level of each AP reached in step 5. 8. Invoke LINGO to solve the ILP in (6) subject to the constraints as specified in (4) and (5), to provide optimal channel assignment to APs. The ILP as defined by (4), (5) and (6) was validated with two-AP and three-AP WLANs, where the optimal channels assigned to the APs were 1 and 6, and 1, 6, and 11, respectively (i.e., with no interference between APs). Because of the random location of the users, we ran more than 50 simulations in each scenario. For illustration purposes, we chose the results for three of them below. IV. NUMERICAL RESULTS In order to verify our 8-step algorithm, we compare our current work with previous work performed in [1] and [2] on different scenarios. It is important to note that several simulations were conducted but only three will be presented. All results have been obtained for a single-floor building, 3 meters in height. The length and width dimensions are dependent on the number of APs in each scenario. The distance between two neighboring APs is 60 meters. The distance between the peripheral APs and the wall are 20 meters. In scenario 1, we considered a grid of 2x2 APs for a single-floor building, 100 meters in length and 100 meters in width, and 20 randomly distributed users with antennas at a height of 1.5 meters. The initial transmitted power of each AP is set to its maximum at 20 dBm (100 mW). The average traffic per user is randomly generated between 500 Kbps and
4.5 Mbps, as shown in Table 1. Each AP provides a maximum bandwidth of 54 Mbps (IEEE 802.11b/g). Table 1: Average data rate for users in scenario 1 User U1 U2 U3 U4 U5 U6 U7 U8 U9 U10
Data Rate (Kbps) 1690 697 3273 3100 4432 2711 2100 1295 3001 3433
User U11 U12 U13 U14 U15 U16 U17 U18 U19 U20
Data Rate (Kbps) 2004 540 2179 3515 3675 4180 3879 1971 2983 3425
We then generated an initial user’s association matrix based on a receiver sensitivity value of -90 dBm as depicted in Table 2. Table 2: Potential user’s association matrix User U1 U2 U3 U4 U5 U6 U7 U8 U9 U10 U11 U12 U13 U14 U15 U16 U17 U18 U19 U20
AP1 0 1 0 0 0 0 1 1 1 0 1 1 1 1 1 0 1 1 0 1
AP2 1 0 1 0 0 0 1 0 1 0 0 1 1 0 1 1 1 0 0 1
AP3 0 1 0 0 1 1 0 1 0 1 1 1 0 1 0 1 0 0 1 0
AP4 0 0 0 1 1 0 0 0 1 1 0 1 0 0 1 0 1 0 1 1
A user can be a potential candidate to multiple APs if its signal level exceeds the threshold value (-90 dBm). For instance, U15 can connect to AP1, AP2 and AP4 while U2 can connect to AP1 and AP3, and U4 can connect only to AP4. Next, we generated an initial users’ association based only on the highest RSSI, as shown in Table 3. In other words, the user will connect to only one AP with the highest RSSI. It is interesting to note that this actually happens in the field, which leads to load imbalance over the network. The matrix in Table 2 is now fed to LINGO to solve the model described in (3.1) while continuously decrementing the transmitted power at the MCAP by 1 dBm. Finally, after 54 iterations, a better user association matrix is achieved while improving the load as much as possible and not violating the constraints in (3.2) and (3.3). Table 4 shows the final association matrix and Table 5 shows a comparison between the congestion factor (CF) achieved by the current algorithm at different stages and the CF from previous work.
The 18th Annual IEEE International Symposium on Personal, Indoor and Mobile Radio Communications (PIMRC'07)
Table 3: User’s association based on the highest RSSI User U1 U2 U3 U4 U5 U6 7 U8 U9 U10 U11 U12 U13 U14 U15 U16 U17 U18 U19 U20
AP1 0 0 0 0 0 0 1 0 1 0 0 0 0 0 0 0 1 0 0 0
AP2 1 0 1 0 0 0 0 0 0 0 0 0 1 0 0 1 0 0 0 0
AP3 0 1 0 0 0 1 0 1 0 1 1 0 0 1 0 0 0 1 1 0
AP4 0 0 0 1 1 0 0 0 0 0 0 1 0 0 1 0 0 0 0 1
Table 4: Final user’s association matrix User U1 U2 U3 U4 U5 U6 U7 U8 U9 U10 U11 U12 U13 U14 U15 U16 U17 U18 U19 U20
AP1 0 1 0 0 0 0 0 1 1 0 1 1 0 0 0 0 1 1 0 0
AP2 1 0 1 0 0 0 1 0 0 0 0 0 1 0 0 1 0 0 0 0
AP3 0 0 0 0 1 1 0 0 0 0 0 0 0 1 0 0 0 0 1 0
AP4 0 0 0 1 0 0 0 0 0 1 0 0 0 0 1 0 0 0 0 1
Table 5: Comparison between Congestion Factors
AP1 AP2 AP3 AP4
CF (highest RSSI) 10-3 0.1663 0.2097 0.3446 0.2810
CF based on [2] 10-3 0.1663 0.2097 0.3075 0.3181
Proposed Algorithm 10-3 0.2979 0.2226 0.2781 0.2029
From the results in Table 5, we can tell that when a user is left to associate with an AP based on the highest RSSI, AP1’s bandwidth was under utilized while AP3 is the MCAP. By applying the algorithm in [2] based on equally distributed power levels, the algorithm was able to relief AP3 a little by sharing some of its load with AP4 while maintaining equal power levels at APs. But AP1’s bandwidth is still under utilized. However, our proposed algorithm was able to distribute the load more efficiently while dropping the power levels of AP1 through AP4 to 11 dBm, 9 dBm, 4 dBm and 3 dBm, respectively.
Finally, LINGO uses the power levels that were determined at the APs to solve (6), while observing (4) and (5), for optimal channel assignment. Table 6 compares the channel assignment of the equal-power scenario with the levels and in terms of power-management scenario. Table 6: Channel assignment AP Number AP1 AP2 AP3 AP4 Interference
Equal Power 11 1 4 8 -2.82
Power Management 11 1 4 7 -3.21
As can be seen, AP4 was assigned a different channel under the power management algorithm. This is the case because interference between any two APs is proportional to the power transmitted by each AP, as shown in (5). So when the power on AP4 was dropped from 20 dBm to 3 dBm, channel 7 was picked for AP4 causing the over all interference between APs to improve by almost 14%. Another scenario, scenario 2, is presented, with another set of 20 randomly distributed users receiving different data rates. The comparison between CFs is presented in Table 7. Table 7: Comparison between Congestion Factors
AP1 AP2 AP3 AP4
CF (highest RSSI) 10-3
CF based on [2] 10-3
0.2071 0.5880 0.1913 0.0899
0.2071 0.4709 0.2378 0.0899
Proposed Algorithm 10-3 0.2830 0.2059 0.2703 0.2466
Again, when the users were allowed to associate with the AP transmitting the highest RSSI, a load imbalance was achieved. For instance, AP4 had only one user associated with it and AP2 was heavily loaded. By applying the algorithm in [2], we see that it was able to improve the load at the MCAP, but still AP4 has very minimal load. However, when our power management algorithm was applied, the load seems to be distributed evenly among all APs. The final power levels at the APs, while all the users are being served by all APs, is 11 dBm, 7 dBm, 14 dBm, and 20 dBm, respectively. The channel configuration of the APs using equally distributed power levels and power management algorithm is presented in Table 8. Table 8: Channel assignment AP Number
Equal Power
AP1 AP2 AP3 AP4 Interference
11 1 4 8 -2.82
Power Management 4 8 11 1 -2.95
The 18th Annual IEEE International Symposium on Personal, Indoor and Mobile Radio Communications (PIMRC'07)
Again, due to the change in power levels, different channels were assigned to the APs while reducing the total interference between APs by 4.61%. The final scenario, scenario 3, consisted of a grid of 3x3 APs and 60 users deployed in a single floor, measuring 160 meters in length by 160 meters in width. The locations of the original 4 APs are unchanged and the 60 users’ locations and their data rates are randomly generated. However, the 5 APs added to the network are kept at a constant separation distance, 60 meters. A similar procedure was followed in determining the best power levels of the APs. Table 9 displays the comparison between CFs attained by the different algorithms.
allocate channels. This is accomplished more efficiently by decrementing discretely the transmitted power at APs and by enhancing the channel assignment that reduces total interference over the network. The algorithm has shown to provide improved results compared to algorithms described in [2]. The algorithm has been shown to perform well for networks of different topologies. Instead of decrementing the power by equal amounts, work is undergoing to make the algorithm more adaptable to the current state of the system. We also plan to investigate user mobility in a future paper. ACKNOWLEDGMENT This research work was funded, in part, by an MRI grant from the National Science Foundation (Grant #: CNS – 0619069).
Table 9: Comparison between Congestion Factors CF (highest RSSI) 10-3 0.1488 0.3776 0.4711 0.2776 0.5133 0.3405 0.1817 0.2061 0.3305
AP1 AP2 AP3 AP4 AP5 AP6 AP7 AP8 AP9
CF based on [2] 10-3 0.1488 0.3776 0.4711 0.2776 0.4271 0.3901 0.1817 0.2061 0.3305
Proposed Algorithm 10-3 0.1971 0.2860 0.2864 0.3546 0.3501 0.3098 0.3323 0.2875 0.3324
Again, our proposed algorithm provided a better load distribution than the other ones. Using our power management algorithm, the power levels assigned to the 9 APs are as follows: 15 dBm, 12 dBm, 3 dBm, 3 dBm, -2 dBm, 4 dBm, 18 dBm, 11 dBm, and 10 dBm, respectively. These power levels were achieved after 107 iterations. Similarly, we invoke LINGO to solve the optimal channel assignment. Table 10 presents the optimal channel assignment for equally-power levels and for the power-management algorithm. After the power levels were adjusted the total interference on the network was reduced by 4%. Table 10: Channel assignment AP Number
Equal Power
AP1 AP2 AP3 AP4 AP5 AP6 AP7 AP8 AP9 Interference
11 4 8 1 11 4 11 1 11 -2.40
Power Management 6 1 4 1 11 1 6 1 6 -2.49
The results of the three scenarios clearly show that the power management algorithm yields a better load and a better channel assignment scheme. V. CONCLUSIONS In this paper, an optimization algorithm is proposed to reduce the congestion at APs, distribute the load of users, and
REFERENCES [1] Y. Lee, K. Kim, and Y. Choi., “Optimization of AP placement and Channel Assignment in Wireless LANs” LCN 2002. 27th Annual IEEE Conference on Local Computer Networks, IEEE Computer Society, Washington D.C. USA, November 2002, pp. 831-836. [2] R. Akl and S. Park, “Optimal Access Point selection and Traffic Allocation in IEEE 802.11 Networks,” Proceedings of 9th World Multiconference on Systemics,
Cybernetics
Communication Applications,
and July
and
Informatics
Network
Systems,
2005,
Austin,
TX,
(WMSCI Technologies USA,
July
2005): and 2005,
pp. 75-79. [3] I. Papanikos, M. Logothetis, "A Study on Dynamic Load Balance for IEEE 802.11b Wireless LAN," Proc. 8th International Conference on Advances in Communication & Control, COMCON 8, Rethymna, Crete, Greece, June 2001. [4] H. Velayos, V. Aleo, and Karlsson, “Load Balancing in Overlapping Wireless LAN Cells”, Proceedings of IEEE ICC 2004, IEEE ICC, Paris, France, June 2004. [5] J. Lei, R. Yates, L. Greenstein, and H. Liu, “Wireless Link SNR Mapping Onto An Indoor Testbed,” Proceedings of IEEE Tridentcom 2005, Trento, Italy, Feb 2005, pp.130-135. [6] L. S. Inc., “LINGO,” http://www.lindo.com. [7] http://www.draytek.co.uk/support/kb_vigor_wlanchannels.html