making a tire mixing or compound formation of rubber is most important part. The two major .... mix is obtained. 2) Some rubbers required an initial breakdown period before ingredient are added. 3) ... 4) The time of mixing for each step in the process is important. ... Carbon 100 system used to transport three types of carbon.
Chapter 1 Introduction
1.1 Introduction Machine efficiency deterioration is major reason for machine failures in the plant. By using plant optimization pillars such problems can be addressed and solved. Maintenance is becoming integral part of industry because of the need to increase reliability and to decrease the possibility of production loss. Maintenance is an activity to ensure that equipment is in a satisfactory and reliable condition. A good maintenance system contributes to efficiency, productivity and zero loss. Plant optimization plays a vital role in decreasing losses, breakdowns and in improving the working environment, standard operating systems and information flow. Plant optimization is a key component of good operational management. The decision to pay strict attention to the measurements, controls and efficiencies necessary for optimization not only enhances the plant, but it quite often produces a safer operating facility used in the most efficient manner. Plant optimization is a necessary ongoing process applied in different industries. It makes the difference in operating the facility at peak profitability.
1
Terotechnology has been defined as “A combination of management, financial, engineering, building and other practices applied to physical assets in pursuit of economic life cycle costs”. The term Terotechnology has been derived from Greek word ‘terein’ which means ‘take care of’’. Terotechnology applies equally to both assets and products because the product of one organization often becomes the asset of another. The basic emphasis of Terotechnology is the area of maximization of life cycle and minimization of downtime by using multi objective design engineering methodology and predictive or preventive maintenance of plant engineering equipments.
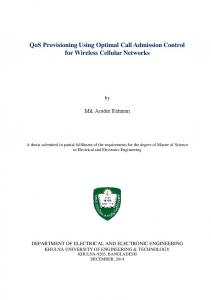
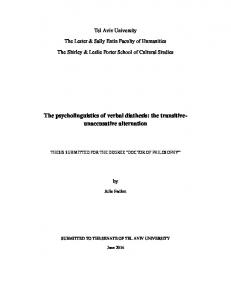
1.2 Tire Manufacturing The tire is an assembly of numerous components that are built up on a drum and then cured in a press under heat and pressure. Different parts of tires are tread, bead, filler, liner, nylon belt, steel belt, plies, sidewall and chafer as given in Figure 1.1. A tire is a strong, flexible rubber casing attached to the rim of a wheel. Tires provide a gripping surface for traction and serve as a cushion for the wheels of a moving vehicle. In tire industries for making a tire mixing or compound formation of rubber is most important part. The two major ingredients in a rubber compound are the rubber itself and the filler, combined in such a way as to achieve different objectives. Depending on the intended use of the tire, the objective may be to optimize performance, to maximize traction in both wet and dry condition or to achieve superior rolling resistance. Tires are found on trucks, buses, aircraft landing gear, tractors and other farm equipment, industrial vehicles such as forklifts, and common conveyances such as baby carriages, shopping carts, wheel chairs, bicycles, and motorcycles. Compounding is the operation of bringing together all the ingredients required to mix a batch of rubber compound. Natural rubber is the main raw material used in manufacturing tires, although synthetic rubber is also used. In order to develop the proper characteristics of strength, resiliency, and wearresistance, however, the rubber must be treated with a variety of chemicals and then heated. American inventor Charles Goodyear discovered the process of strengthening rubber, known as vulcanization or curing, by accident in 1839. The raw materials used in the formation of rubber compound manufacturing are 1. Natural Rubber (Polyisoprene) 2. Synthetic Rubber i.e. Polybutadiene 3. Carbon or Carbon black 2
4. Silica 5. Chemicals (E.g. Code 4, Sulphur and Leibax) 6. Vulcanizing accelerators 7. Oils (Silanic, Urbonine, sardine, syndine)
Figure 1.1: Different parts of tire Carbon is one of the essential raw materials in rubber compound manufacturing. Carbon black is a fine, soft powder created when crude oil or natural gas is burned with a limited amount of oxygen, causing incomplete combustion and creating a large amount of fine soot. Carbon black is mainly used as a reinforcing filler in tires and other rubber products. Further the addition of carbon to rubber compound results in properties of
Added to rubber as both filler and as a strengthening agent.
Helps the rubber in increasing erosion resistance for friction which is critical for tires.
Helps in increasing life spam of tires.
Helps in improving strength, resiliency and wear-resistance.
The use of carbon in rubber compound manufacturing is different for different rubber compound production. Depending on the required properties of Rubber compound sheet the different carbon types with different amount of carbon is added in rubber compound mixing. Here in Goodyear plant 5 types of carbon and 2 types of silica are used in rubber compound mixing. These carbons have their different names given according to Goodyear given in Table 1.1. 3
Table 1.1: List of carbon codes with their grades Sr.no. 1 2 3 4 5 6 7
Goodyear Code 599 228 405 510 630 1171 1371
Carbon grades 347 550 220 660 326 -
The above carbon has been used separately or combined in different rubber compound sheet manufacturing. The amount of carbon mix in each rubber compound sheet is fixed and according to that a tolerance of +0.5 Kg or -0.5 Kg is given. The carbon weighing compliance is a term used to find out the carbon efficiency in each rubber compound production. The value of carbon weighing compliance should be 100% for the most good quality production of rubber compound sheets and for the optimized use of carbon.
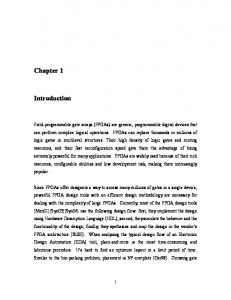
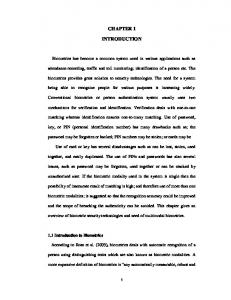
1.3 Information on Banburry Mixer This is the automated system used to produce the homogenous mass of compounded rubber in form of sheet from raw rubber and other ingredients. It consists of conveyer to inject the mixture in to the mouth of the mixer. The accurate percentage of each ingredient to be added is decided by the slandered data sheet. The packs of this ingredient are placed on the conveyer belt. The conveyer belt is coupled to the master program. If the weight of the mixture is correct than a green strip is seen on the computer screen. Then this batch goes into the rotary mixer. These chemicals act with the molten rubber and form homogeneous mixture. These homogeneous mixture is formed due the TSR unit (Twin screw roller die unit).Temperature of this die is maintained at the required temperature by TCU (temperature controlling Unit).This TCU comprises of the heating coil and thermocouples, which control and maintain the temp of the die. Figure 1.2 gives the block diagram of banburry machine which is drawn on the basis of the entire process of working of banburry machine. When the permissible homogeneity of rubber particles is achieved then the bottom door of the mixer opens and the batch goes on to the roller mills. These mills press this mixture to form uniform thickness rubber plies. These plies are wetted by liquid soap so that during staking of the rubber plies these plies do not adhere to each other. These plies have to 4
be cooled. So the fans are used to cool the rubber. These fans and the channel through which the plies travel is called festoon conveyor, this cooled rubber travels towards exit where it is chilled. Then these plies are stacked in a correct manner and sent to the necessary sections or stored neatly. This is known as Non-Productive master batch.
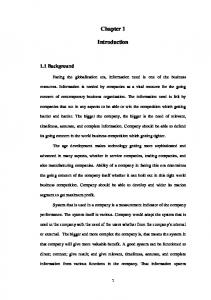
Figure 1.2: Block diagram of banburry machine This non-productive master batch is then mixed in Banburry with vulcanizing agent at a particular temperature and pressure. Ultimately a productive batch is made and which is used to produce the different component of tire. Figure 1.3 gives the entire process of rubber compound manufacturing which mainly consists of formation of nonproductive sheet at first and then formation of productive sheets of rubber compound at final stage.
Figure 1.3: Process of formation of rubber compound Fabric (steel, polyester, nylon, or combination of these), Rubber (synthetic and natural types: hundreds of different polymer), Reinforcing chemical (carbon black, silica, resins), Anti-degredants (ozonants, paraffin waxes), Adhesion promoters (cobalt salts, brass on wire, resins on fabric), Curatives (cure accelerators, sulphur) and processing oils (oils, softeners). 5
The compound consists of filler substances the most popular fillers are carbon black and silica. Mixing is the foundation step upon which every further step is dependent on. Mixing is the most critical component of rubber processing. Mixing requires deciding the formulation, what equipment to use, and the time, speeds, pressures, temperatures. Following are the main parameters 1) There are definite temperature ranges for mixing rubbers, each specific rubber having
an optimum temperature at which the desire dispersion of compounding
ingredients in the mix is obtained. 2) Some rubbers required an initial breakdown period before ingredient are added. 3) A specific order of incorporation of the compounding ingredients is necessary. 4) The time of mixing for each step in the process is important. 5) A finishing step and controlling final temperature of the mix is necessary to prevent ‘scorch’.
1.4
Problem Definition Carbon is one of the essential raw agents used in mixing of rubber compound used for
manufacturing different parts of tire. The adverse nature and properties of carbon make it difficult to easily mix in with other raw materials. Also it results in creating some carbon failures repetitively. Carbon weighing compliance is one of the terms used for measuring efficiency of carbon. The value of carbon weighing compliance should be 100%. But repetitive breakdowns of carbon results in reducing the value of carbon weighing compliance up to 85-90%. Hence here an attempt has been made to improve the carbon weighing compliance value to 100% and reduce the repetitive carbon breakdowns. So by improving the value of carbon weighing compliance the use of carbon should be optimized for each rubber batch production. By analysis it is found that the amount of carbon can affect the quality of rubber compound used for tire manufacturing. The increase or decrease of carbon amount in rubber compound can cause high impact on tire quality.
6
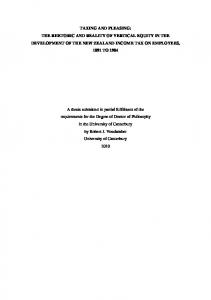
1.4.1 Carbon handling and transporting System There are two carbon transporting system provided at plant. The systems are named as carbon 100 and carbon 200 systems. Both the system has same structure only the difference is Carbon 100 system used to transport three types of carbon. (Carbon 599, 228, 405) and carbon 200 system used to transport two types of carbon and two types of silica. (carbon 510, 228 and silica 1171, 1371). Figure 1.4 gives a schematic representation of carbon 200 system.
Figure 1.4: Schematic diagram carbon 200 systems From carbon 100 and 200 system with the help of transporter the carbon is transferred from carbon bags to debin area which is at the top floor at the plant. The amount of carbon in carbon bags are almost 600 kg or 1200 kg. In 3 to 4 cycles the carbon from carbon bag is transferred to transporter which is of capacity 400 kg. From transporter with the help of transporting lines the carbon is transported to the debins. Numbers of Air boosters are placed on each transporting line to transfer the carbon from transporter to debin area. Figure 1.5 gives the construction of debin area where 7 different debins are placed in which the transported carbon is stored. The name of the seven debins are 100A (599), 100B (228), 100C (405), 200A (510), 200B (630), 200C (1171) and 200D (1371).
7
As per the requirement of carbon in rubber sheet production it is weighed and mixed. Figure 1.6 gives the construction of a 100 system debin with weighing hopper with all parts of debin, High level, medium level and low level switch, screw motor, weighing screw and discharge valve..
Figure 1.5: Layout of debin area
Figure 1.6: Carbon flow from debin to weighing hopper 8
1.5 Concept of Plant Optimization Pillar House Plant optimization is not only concept of engineering but it gives brief knowledge about new methods and technology should be used in industry. Plant optimization is a proactive approach that necessarily aims to identify issues as soon as possible and plan to prevent any issues before occurrence. Plant optimization is a maintenance process developed for improving productivity by making processes more reliable and less wasteful. The goal of plant optimization is to maintain the plant or equipment in good condition without interfering with the daily process. To achieve this goal, preventive and predictive maintenance is required. By following the plant optimization process unexpected failure of the equipment can be minimized. One way to think of plant optimization is "deterioration prevention": deterioration is what happens naturally to anything that is not "taken care of". In production process the operator is not viewed as a member of the maintenance organization, in plant optimization the machine operator is trained to perform many of the day-to-day tasks of simple maintenance and fault-finding. Also teams are created that include a technical expert as well as operators. In training, the operators are enabled to understand the machinery and identify potential problems and correct them before they can impact production.
Figure 1.7: Plant Optimization Pillar House (Milliken Institute, Plant Optimization) Figure 1.7 gives the pillar house of Plant Optimization (Milliken Institute, Plant Optimization). There are 9 pillars of Plant Optimization pillar house named as Work Place Organization (WPO), Daily Equipment Care (DEC), Continuous Skill Development (CSD), Reliability Excellence (RE), Focused Improvement (FI), Quality Process (QP), Production 9
Flow (PF), Early Equipment Management (EEM), New Product Industrialization (NPI) explained below. a) Work Place Organization: It is a process or system used to organize and maintain a work space for efficiency and decrease wasting. Also to optimize quality and productivity by monitoring an organized environment .It also help employees to develop their characteristic to decrease downtime, lead time, inventory, injury, defect etc. Work place organization is like 5 S. b) Daily Equipment Care: It provides operators with the knowledge, skills and the mean support required to proactively identify and/or prevent all daily losses caused by accelerated equipment deterioration and non - standard condition. Implementation of DEC steps improved work environment, safety and information flow. The purpose of DEC pillars is reducing minor machine stops, increase equipment life and promotes operator ownership of equipment. The challenges occur during implementation DEC are little expensive, and ties up production time. c) Continuous Skill Development: A standardized work creation and improvement process to educate and provide the skills and capabilities that empower our associates to do the right things, the right way, and every single time. Proper skills that empower all associates to standardize work and improvement in process to do right things in right way. d) Reliability Excellence: It is a combination of preventive, predictive, and zero failure activities. It includes maintenance schedule, processes and activities to eliminate all costly problems before they occur instead of fixing them after the fact. The main objectives of RE pillars are zero defects, zero incidents, zero breakdowns, increase equipment life, enhance availability & maintainability. The value drivers of reliability and maintenance are asset utilization, safety, health and cost control. e) Focused Improvement: Provides a team based logical problem solving process which prioritizes improvement projects, as well as identifies and remediates root cause in order to eliminate losses. Priorities are given to make improvement in project as well as eliminate losses by identification of root cause using DMAIC method. f) Quality Process: A systematic methodology to achieve zero quality non-conforming by systematically reducing variation, while identifying, and eliminating root causes of non-conforming. This pillar has the responsibilities and process for identifying the quality records. 10
g) Production flow: When the production process is divided into many stages, the product passed through one stage to other stage for the manufacturing of the final product. h) Early Equipment Management: Designing out losses related to equipment, process, and facilities start-up before they occur by utilizing existing measurement data and learning, as well as standardizing equipment and requirements. To ensure that the machine is reliable proper management of the equipment is essential. i) New Product Industrialization: This pillar is for the setup of a new product concept and turning it into a production stable product. Cross-functional activity to provide a continuous flow of innovative new products. This chapter is enclosed with the details of Tire manufacturing, different parts of tires, different raw materials used for tire manufacturing, process of rubber compound manufacturing, different parts of carbon used in tire manufacturing, carbon weighing compliance, carbon handling and transporting system, the issues regarding carbon weighing compliance and pillars of plant optimization. Now we will see the different preventive maintenance techniques used in different areas to solve the issues regarding productivity improvement, breakdown reductions, process improvement.
11
Chapter 2 Literature Review
The literature review consists of the different tools used for preventive and predictive maintenance in different areas like manufacturing, hospitals, management, housing construction, industrial, supply chain, printing process. The tools used by researchers for preventive and predictive maintenance are Failure Mode Effective Analysis, Total Productive Maintenance, DMAIC (Define, Measure, Analyze, Improve, and Control), Statistical Process Control, Six Sigma tools.
2.1
Literature Review Arunraj and Maran (2014) observed that the TPM has tangible benefits and by TPM
implementation methodology improvement in the availability, performance efficiency and the quality rate, results in improvement of the overall equipment effectiveness of the equipment
12
Azizi et al. (2015) proposed that Manufacturing firms are more focusing on improving the production performance in term of productivity, because a high productivity performance has a direct relationship with the equipment efficiency and process control. Autonomous maintenance is applied in the glazing line to improve the machine efficiency by giving more responsibility and authority to the operators to do more improvement and preventative actions to their own machines. Result of the study presents that the implementation of AM has successfully reduced 8.49% of the defect rates of glazing line from 14.61% to 6.12%. Machine breakdown time has been decreased from 2502 minutes to 1161 minutes whereas the OEE has been improved 6.49% from 22.12% to 28.61%. Barbosa et al. (2017) focused on improving the performance and product quality rate of the production process of apex machine at Continental tire factory Portugal. The possible root causes of defect generation were identified and proposals to enhance the functioning of the bead APEX production process were carried out. By applying Six Sigma, variables that influence the quality of the production were identified. DMAIC cycle was applied in the process analysis, enabling a structured analysis and the identification of different causes that negatively affect the process studied and consequently allowed the identification of opportunities for improvement. Cunhaa and Dominguez (2015) applied DMAIC phases to improve the warranty billing process for a Portuguese car dealer. It shows that the project allowed car dealers managers to understand that financial metrics in use did not control compliance standards for Car Brands, in warranty services, or assure a good cash-flow for the car dealers. After analyzing the billing procedure necessary changes made in new metrics (% time compliance to do the service and bill it, % time compliance reception, and % time to find a defective part in an audit) generated time benefits and consequently a more controlled cash flow. These new metrics may be common to any car dealer with warranty services. Three out of the five proposed new metrics dealt with time. Consequently the main direct benefits for the Car Dealer consisted in time gains, more specifically in the cycle time confirming what the bibliographic review had already mentioned for other services.
13
Das and Nath (2015) focused on the most significant equipment breakdowns of the tube section of a FMCG (Fast Moving Consumer Goods) company and to suggest countermeasures to reduce these breakdowns, which would as a result improve the OEE. To increase productivity is to increase the OEE (Overall Equipment Effectiveness) of the machines or equipment and OEE can be improved with the continuous implementation of TPM (Total Productive maintenance).After analysis it was concluded that autonomous maintenance is a very important TPM pillar that keeps the equipment in a reliable condition and prevents forced deterioration of the equipment. Erbiyika and Saru (2015) stated that the six sigma methodology can be used for developing and reducing the actions which do not have inner process in supply chain in the firms. The aim of six sigma methodologies are defining, analyzing, correcting and improving the variables, which affect the quality of supply chain process in order to decrease the number of defects and the failures and to propose the improvement means for the processes. Six sigma methodologies are implemented in all departments of the company by regular trainings and team meetings. Fouad et al. (2012) applied a process improvement study based on customized Lean Six Sigma methodologies applied at a local paper manufacturing company. More specifically, the DMAIC (Define, Measure, Analyze, Improve, and Control) project management methodology to enhance productivity. Two performance measures namely production rate and Overall Equipment Effectiveness (OEE) are employed to evaluate the performance of the cutting and the printing machines before and after the DMAIC cycle. Obtained results indicate that the production rate increment for printing machines by 5% and for the cutting machines by 10%. Moreover, the OEE for the printing and cutting machines has increased by 21.6% and 48.45% respectively. Gejdoš et al. (2015) applied the selected tools of statistical process control to achieve continuous quality improvement. The advantage of these tools is that they can identify the effects of the processes that cause unnatural variability in processes that result of errors and poor quality. Tools like capability index, histogram, model DMAIC, control chart, etc. can reliably determine the anomalous variability in the process and thereby contribute to quality improvement. The results clearly show that through the DMAIC model can systematically improve quality. Use of DMAIC model as well as other statistical quality tools is a way to achieve continuous quality improvement. 14
Jayswala et al. (2011) a systematic approach for sustainability root cause analysis of chemical/energy production process has been presented in this paper based on the combination of Pareto Analysis and Fishbone diagram. The sustainability of the process is assessed incorporating economic, environmental, and societal and efficiency concerns. Jin et al. (2007) proposed Failure-In-Time (FIT) to drive the reliability improvement. The Failure-In-Time (FIT) rate is widely used to quantify the reliability of a electronic component. It fails to indicate the portion of the failures due to either environmental or electrical stresses or issues that are related to process/handing, manufacturing and applications. To meet this end, FIT-based corrective action driven metrics are proposed to link the failure mode (FM) with components and non-component faults. First the conventional failure mode pareto is reviewed and its deficiency is discussed. Then a new index called the failure mode rate (FMR) is introduced to monitor the FM trend and evaluate the effectiveness of corrective actions (C/As). Kumar and Rudramurthy (2013) identified and analyzed repeated breakdowns out on hydraulic press along with the critical parts, which were under breakdown condition. Also the reason for the breakdown has been analyzed and inspected by the method of Fish bone diagram and why-why analysis. By this analysis and methods the root causes of the breakdowns were identified. This in turn helped to develop and improve a new Preventive maintenance checklist for the machine. This method is used to prevent the failure of equipment before it actually occurs. The average availability of critical machine 1000 Ton hydraulic forging press after root cause analysis is increased to 4.16%. Also the average MTBF of critical machine after root cause analysis is increased to 13.66% and MTTR is decreased to 46.42% respectively. After root cause analysis there is an improvement in the maximization of planned productivity. This is because of proper diagnosis of the existing system and by employing proper preventive maintenance schedule. Therefore whenever a breakdown occurs, the root cause of the breakdown has to be identified. Then some efforts should be made to improve this system using root cause analysis and counter measures, such that similar type of breakdown can be reduced. Kiran et al. (2013) conducted the study to identify the major breakdowns causing the production loss to the company. Root cause analysis was conducted for the major breakdowns causing production loss to the company. Root causes of breakdowns were identified using 15
cause and effect diagram. Counter measures and parallel improvement opportunities for major breakdowns causing production stoppage was also suggested. Kurdve and Bengtsson (2016) stated that how a Life cycle cost or Total cost of ownership analysis has been performed on machining equipment in a Swedish company. Life cycle cost models used in case studies are compared to an empirical model, used at the company, where dynamic energy, fluid, and maintenance cost are included. Linear and variable factors in the models are analyzed and discussed regarding data availability and estimation, especially with emphasis on maintenance. The life cycle cost aspect of the equipment give guidelines to consider operation, maintenance, tools, energy, and fluid cost in addition to acquisition cost, when designing/specifying the equipment. Lee et al. (2008) proposed that Continuous improvement is a necessary part of hospital culture to increase influenced efficiency while saving money. An investigation of intravenous device-related practices was performed by the nurses of the intravenous access team, pharmacy. Using observation, measurement of performance, and root cause analysis, the hospital’s practices, policies, and equipment were evaluated for the process of occlusion management. The team utilized a Six Sigma strategy employing the elements define, measure, analyze, improve, and control, which is a disciplined, data-driven methodology that focuses on eliminating defects (waste). Over the course of the 26-month study, Hartford Hospital experienced a 69% total reduction in tissue plasminogen activator use representing a total 26month savings of $107,315. Other cost savings were reflected in areas of flushing, flushing disposables, and in a decrease in needleless connector consumption Li et al. (2008) found that surface-mount technology (SMT) is the solder paste printing process. In this process, the thickness of deposited solder paste on printed circuit board (PCB) pads is a key quality characteristic (QCH) of main concern. In practice, large deviations of solder thickness from a nominal value result in SMT defects that may cause PCB failure. Adopting the DMAIC approach including the Taguchi method, the estimated standard deviation of solder thickness is reduced from 13.69 to 6.04, while the process mean is adjusted on 150.1 µm which is very close to the target value of 150 µm. Lomte et al. (2018) focused on the application of Plant optimization technique to identify machine failures, machine breakdowns and to restore machine to its proper condition. The main objective of this work is to improve key performance indicator by increasing MTBF 16
and decreasing MTTR of TSR machine using reliability excellence pillar of plant optimization. Repeated breakdown were identified and analyzed along with critical parts of machine. The root cause of machine part breakdown were identified and analyzed by method of why-why analysis. The solution helped to develop a new preventive maintenance and lubrication checklist for TSR of banburry machine. The work resulted in increase in average value of MTBF by 65.02% and decrease in MTTR value by 64.17% for banburry machine. Mahto and Kumar (2008) implemented the application of root cause to eliminate the dimensional defects in cutting operation in CNC oxy flame cutting machine and a rejection has been reduced from 11.87% to 1.92% on an average. Mehrabi et al. (2012) observed that Understanding of the key features, barriers, elements and weaknesses of six sigma methods will allow the organizations to support their strategic directions and increasing need for coaching supervision and training. The evolutionary review of the benefits and challenges of six sigma projects and recognizes the key and influential elements of the successful approach of six sigma method. Effective principals and activities of Six Sigma will be successful through the improvement and constant sequence of organizational culture. Mast and Lokkerbol (2012) concluded that DMAIC is applicable to empirical problems ranging from well-structured to semi-structured, but not to ill-structured problem or pluralistic messes of subjective problems (people problem solving, in the framework used in the paper).DMAIC is suitable for rather extensive problem solving tasks, requiring all of the components of problem definition, diagnosis, and the design of remedies. It is less suited for problem tasks of a smaller scope. And also high- lighted the characteristics of the DMAIC approach and its limitations, specifically from a problem solving perspective. Pan et al. (2007) proposed a strategy to integrate Six Sigma DMAIC methodology with the customer relationship management (CRM) implementation process addressing five critical success factors (CSF). 5 critical success factors were identified for CRM implementations. Pugna et al. (2016) stated that the exigencies of the permanently evolving markets require continuous adaptation of company offers. The development and continuous improvement of the quality and environment management systems would be to anticipate these developments and therefore fully satisfy the needs and expectations of each partner 17
(customers, staff and other stakeholders) and also maintain competitive advantage. One of the possibilities of gaining operational excellence is implementing different quality improvement initiatives like Total Quality Management, ISO certification, Agile & Lean manufacturing etc. Therefore introducing and implementing the Six Sigma methodology was proven to provide breakthrough quality improvements in a reasonable short time. This approach is resulted into improvement in an assembly process in an automotive company in Romania by using Statistical Thinking and DMAIC Six Sigma methodology. Ridwansyah and Sri Indrawati (2015) proposed that manufacturing process capability is an important factor for business continuity. In order to improve the manufacturing process capability, this research is conducted using lean six sigma method. The first part is focused on waste analysis using process activity mapping. Then manufacturing process capability is evaluated. Further, failure mode and effect analysis is used as a basic consideration in developing the continuous improvement program. There are 33.67 % non value added activity and 14.2% non necessary non value added activity that occurs during the manufacturing process. Based on the analysis, product defects, inappropriate processing and waiting are type of manufacturing waste that frequently occurs. A continuous improvement program consist of redesigning chute dust collector, weighing standard operation is developing to overcome the problem. Rohini and Mallikarjun (2011) explained the Aligning Total Quality Management (TQM) by applying SIX-SIGMA in the health care setup gives a strategic dimension to hospital manager to reform the system & functions to obtain zero error hospital. DMAIC phases were applied to improve the process in the Operation Theatre of a corporate multi specialty hospital in Bangalore, India. The DMAIC approach showed a wider application and how the healthcare organization can achieve competitive advantages, efficient decisionmaking and problem-solving capabilities within a business context. They developed a Design DMAIC Model that can be used as a template for improving the Operation Theatre Process in hospitals. This interventional research study helped the hospital to increase the OT Utilization, many OT related solutions for framing policies, for consultants and for supportive staff, engineering and IT services and also gave a annual financial savings of amount Rs. 6, 45, 30, 000. Roman et al. (2015) introduced a new framework that allows continuous improvement for the reliability of production process and product. The new framework allows engineers 18
with less effort to define and measure failures of production processes, also enable to analyze these failures. It can be done by identifying the most critical operations in the process that influence on Key Performance Indicator (KPI) such as throughput of that process. Based on the received results, engineer can apply corrective actions and perform continuous improvement by performing daily monitoring of production processes. The framework allows the company decrease production lead time and increase product throughput KPI with less expenditures. This new framework also integrates various tools and methods like Six Sigma DMAIC, FMEA, TOC, FC, swim-line diagram. Shaikh and Kazi (2015) this paper gives brief on six sigma (DMAIC) methodology where six sigma techniques would help businesses visualize what quality and process events will occur given various situation and ultimately help them in their overall development. Silva et al. (2017) proposed that market’s constant changes require continuous flexibility and adaptation in the supply provided by organizations. Due to high level competitions exposure automotive industries are considered to be one of the most demanding sectors. The constant processes improvement and continuous reduction of costs are the two main challenges for automotive industries. This study was developed at a tire manufacturing company with the purpose of improving the rubber extrusion process of the tread and the sidewall. By adopting Six Sigma methodology and using the DMAIC cycle one was able to implement some improvement procedures which resulted in a decrease of 0.89% on the indicator of work-off generated by the production system. This approach resulted in a significant financial impact (savings of over 165 000€ per annum) on the company’s quality expenses. Smętkowska and Mrugalska (2018) proposed that quality improvement of the product is one of the most growing needs of industrial sector. The work mainly focused on to implement DMAIC cycle as an element of continuous improvement in practice. In order to achieve it, the problem of quality and quality improvement is widely discussed and analyzed. The propositions of improvements, which can be implemented in the organization in order to increase the effectiveness of production process, are also presented. The application of DMAIC, which is one of the methods of quality improvement used in Six Sigma concept, can increase the effectiveness while adequate reacting for the appearing problems. As it was shown with the example of machine Kolbus BF 511, it can be achieved by implementing SMED, trainings for employees, work standardization and Total Productive Maintenance and 19
after that, it is necessary to introduce continuous control on the efficiency of the processes performed on that machine. Sokovic et al. (2014) stated the different characteristics of PFCA tools and Six Sigma (DMAIC, DFSS) techniques and EFQM Excellence Model (RADAR matrix), which are possible to use for the continuous quality improvement of products, processes and services in organizations. By comparing the above methodologies different prerequisites, differences, strengths and limits in their application has been shown. Depending on the purpose every organization will have to find a proper way and a combination of methodologies in its implementation process. The PDCA cycle is a well known fundamental concept of continuous improvement processes, RADAR matrix provides a structured approach assessing the organizational performance, DMAIC is a systematic, and fact based approach providing framework of results-oriented project management, DFSS is a systematic approach to new products or processes design focusing on prevent activities. On the contrary Six Sigma and EFQM Excellence model are more complex and demanding methodologies and therefore need more time and resources for their proper implementation. Srinivasana et al. (2014) focused on the implementation of Six Sigma DMAIC phases to improve the effectiveness of shell and tube heat exchanger in a small sized furnace manufacturing company. Shell and tube heat exchanger is one of the critical components of the furnace. The main objective is to improve the quality of the furnace by improving the effectiveness of shell and heat tube exchanger by DMAIC phases. First effectiveness was measured as 0.61 and analysis has been carried out to find out the reasons for the reduction of effectiveness of heat exchanger. The cause and effect diagram identified that there is less heat transfer area. The solution was identified with the introduction of circular fins over the bare tubes to improve the effectiveness in the shell and tube heat exchanger and the effectiveness has been enhanced from 0.61 to 0.664 in the improve phase. Srinivasana et al. (2014) implemented the Six Sigma tools and techniques in various manufacturing sectors, which strive to continuous improvement in achieving less variation, cost and high quality of end products. This case study narrowly focuses on reduction of two imperative responses in spray painting process producing shock absorbers, namely peel off and blisters using the Six Sigma (DMAIC) approach. First the pretreatment painting process was analyzed and the vital root causes that impact the responses were identified as cleaning temperature, phosphate temperature. The solution given concentrated on optimizing the vital 20
root causes which impact the responses by using Taguchi robust design approach. The results obtained from runs are satisfied which embarks the sigma level from 3.31 to 4.5. The continuous pursue on eliminating variation in the processing stage was attained by framing a control plan to control the variation within acceptable levels in the pretreatment process. Teneraa and Pinto (2014) stated that Current economic crisis raises the constant demand for profitable solutions that allow organizations to gain competitive advantage. For this reason, companies try improve their products and/or service characteristics, perfect their processes, decrease costs, improve the capital’s profitability and costumers’ satisfaction. In companies, Lean management focus mainly on the waste elimination, using simple and visual techniques whenever possible and Six Sigma on the control and processes variability reduction, using statistical tools for this purpose. The present article proposes a Lean Six Sigma (LSS) project management improvement model supported by the DMAIC cycle and integrating an enlarged and adapted set of statistical tools, given the nature of the project management main variables and the involved processes. Thomas et al. (2008) observed that both total productive maintenance (TPM) and Six Sigma are key business process strategies, which are employed by companies to enhance their manufacturing performance. A Six Sigma Methodology (SSM) pilot study was undertaken in order to improve the quality, cost and delivery measures of the company. In all measures, the SSM project achieved significant improvements. Using DMAIC 5 phases castings department of this company achieved savings in excess of £200,000 for an initial outlay of less than £4,000 in experimental and project costs and The application of the SSM approach allowed the company to develop advanced systems mapping and analysis techniques and to become generally more “technical” in their approach to problem solving. Youssouf and Rachid (2014) observed that the efficiency of the maintenance of the industrial systems is a major economic stake for the business concern. The choice of maintenance action results in sources of ineffectiveness for a critical machine of the production process. Adoption of maintenance services in the technical and technological areas ensures survival of business and competitive in market for an industry. The work is mainly focused on use of lean six sigma in optimization of maintenance for industrial systems. The method is based on five main steps summarized in the acronym (DMAIC): Define Measure, Analyze, Improve and Control. Application of the DMAIC phases on the maintenance 21
processes will help to reduce costs and losses in order to get results in terms of profit and quality. Yun et al. (2013) proposed a hybrid genetic algorithm with a heuristic method to find near-optimal solutions and compared with a general genetic algorithm. To determine MTBF (Mean Time between Failures) and MTTR (Mean Time to Repair) for all components and ALDT (Administrative and Logistics Delay Times) of the searching system in order to minimize the life cycle cost and to satisfy the target system availability.
2.2
Inferences drawn out of literature survey From the literature review, it is observed that by implementing total productive
maintenance (TPM) and root cause analysis deterioration of machinery parts, minor stoppage, root cause of failure equipment helps to identify and also breakdown downtime values is used to track performance through bar chart using key performance indicator (KPI). DMAIC phases, FMEA, Six Sigma tools, TPM and other maintenance tools are used by researchers repetitively to solve the problems like reducing breakdown and increasing productivity It is also observed that the imperative of six sigma methodology in all kinds of activities ecumenically everywhere is solicited vigorously. By utilizing six sigma higher productivity, reduce breakdowns is possible. Especially when the machine plays a vital role in the process of production, machine should be reliable and this may transpire when systematically methodology is implemented. Lean Six Sigma is a method of improving the quality and profitability based on mastering statically of process and it is also a management style that based on a highly regulated organization dedicated to managing project.
2.3
Research gaps
From the study of literature the research gaps observed are mentioned below: 1. Plant optimization pillar house is very rarely used to solve the issues regarding machine breakdowns. 2. Very few researchers implemented terotechnology concept for preventive maintenance alongside DMAIC phases.
22
2.4
Objectives of the research work
1. To identify and reduce the repetitive carbon breakdowns after finding out root cause analysis using DMAIC methodology. 2. Improvement in carbon weighing compliance of mixing system of banburry machine up to 100% by using DMAIC phases. 3. To develop the check sheets for effective preventive maintenance of carbon handling and transporting system with the terotechnology concept.
23
Chapter 3 Methodology The methodology used for this work is based on the use of Reliability Excellence and Focused Improvement, two of the main pillars from plant optimization pillar house given in Figure 1.7. Focused improvement pillar based on logical problem solving process like DMAIC method. Table 3.1 gives the steps of reliability excellence which includes two steps. Step 1 consists analysis of current situation and step 2 consist restore of equipment and correct weakness. Table 3.1: Steps of Reliability Excellence Step 1 Phase 1 Reduce
Analysis of current
breakdown
situation
Step 2 Restore of equipment and correct weakness
Step 1: Analysis of current situation Analysis is the process of getting detailed understanding of a process by breaking complex process into various parts. Analysis focuses on real numbers like total downtime of machine which shows on bar chart to represent relationship between actual target and annual target. 24
Carbon weighing compliance and carbon breakdown data which affect carbon weighing compliance of mixing system of banburry machine including repetitive breakdown were collected from January 2017 to December 2017 for detailed analysis. The collection of data was done on daily breakdown basis with the help of Central monitoring system (CMS). Month wise carbon compliance data of year 2017 is plotted from January 2017 to December 2017. Also month wise data of carbon delays of year 2017 are consolidated together and plotted with the help of pivot in two bar charts i.e. 1) carbon problems with total downtime of carbon problems 2) carbon problems with frequency of carbon problems. Data Collection for carbon weighing compliance from January 2017 to December 2017 Carbon weighing compliance is also known as carbon weighing efficiency for each rubber batch production. The values of carbon weighing compliance are displayed with the help of CMS system used at the plant which automatically update daily data of carbon weighing compliance. The monthly value of carbon weighing compliance is found by founding average of carbon weighing compliance of entire month. Table 3.2 gives the values of carbon weighing compliance month wise from January to December of year 2017. Table 3.2: Carbon weighing compliance of year 2017 Month
% Carbon Compliance
January 2017
89.65
February 2017
89.43
March 2017
89.87
April 2017
89.12
May 2017
88.69
June 2017
89.23
July 2017
88.83
August 2017
89.68
September 2017
89.48
October 2017
88.78
November 2017
89.05
December 2017
89.95
25
Data Collection for total downtime caused by carbon failures from January 2017 to December 2017 Breakdown data collection consists of all breakdowns that occur in a manufacturing firm. Here we just considered the carbon breakdowns as the main objective of the project is to increase the value of carbon weighing compliance. So, all the focus is on the carbon breakdowns that cause effect on carbon weighing compliance is considered. Data collection is important aspect which provides information as
Breakdown hours, minutes.
The data about the causes of breakdown
Problem occur
Data collection of carbon breakdowns from January 2017 to December 2017 The data of carbon breakdowns occurred in carbon handling and transporting system of banburry machine is collected from the month January 2017 to December 2017. The data of each month has been consolidated together and by using pivot chart it is arranged in the manner carbon breakdowns with total downtime caused and frequency of carbon breakdown. Table 3.3: Total downtime and Frequency data with carbon delays of Banburry mixer Sr. No.
Part
Sub part
1
debin
100B
2
debin
3
Carbon breakdowns
Downtime
Frequency
228 carbon weighing slow
1503
123
Wt. hopper
Carbon discharge problem
1141
86
debin
Wt. hopper
Carbon overweighing problem
637
56
4
debin
200A
510 carbon weighing slow
376
33
5
debin
200B
630 carbon weighing slow
319
28
6
debin
100C
405 carbon weighing slow
297
27
7
debin
100A
599 carbon weighing slow
255
14
8
debin
200C
1171 silica weighing slow
246
23
9
debin
100B
228 carbon discharge problem
124
9
26
Sr. No.
Part
Sub part
10
debin
100C
11
debin
12
Carbon delay
Downtime
Frequency
405 carbon excess weighing
108
8
100B
228 and 599 carbon weighing slow
76
3
debin
200C
1171 silica transporting problem
51
4
13
debin
100B
228 carbon transporting problem
51
2
14
debin
100B
228 carbon discharge problem
48
2
15
debin
Wt. hopper
heavy carbon leakage
45
16
debin
200B
17
debin
200C
18
debin
Wt. hopper
19
debin
20
630 and 599 carbon weighing slow 1171 and 630 carbon weighing slow
1
40
1
37
3
carbon air pressure problem
36
1
100C
405 carbon transporting problem
36
2
debin
200C
1171 Silica Discharge problem
35
5
21
debin
100A
599 Carbon excess weighing
35
1
22
debin
200A
510 carbon transporting problem
33
2
23
debin
200B
630 carbon open feeder valve alarm
33
1
24
debin
200D
1371 silica weighing slow
29
3
25
debin
100B
228 and 510 carbon weighing slow
28
2
26
debin
100B
228 carbon jam in bin
26
1
27
debin
Wt. hopper
carbon air pressure problem
25
1
28
debin
Wt. hopper
25
3
29
debin
100C
23
2
30
debin
200D
1371 silica transporting problem
21
1
31
debin
200D
1371 silica excess weighing
20
1
32
debin
100C
405 carbon feeder valve problem
20
1
33
debin
100B
228 carbon weighing and discharge problem
18
2
carbon weighing and discharge problem 405 and 228 carbon weighing slow
27
Sr. No.
Part
Sub part
34
debin
100A
35
debin
36
Carbon delay
Downtime
Frequency
599 transporting line jam
18
1
200B
630 carbon transporting problem
15
2
debin
MOP
carbon leakage near MOP
12
1
37
debin
100C
405 carbon discharge problem
10
1
38
debin
100C
405 and 228 carbon weighing and discharge problem
9
1
39
debin
100A
599 feeder valve not open
9
40
debin
200A
41
debin
100C
510 and 405 carbon weighing slow Carbon weighing 405 Bin Signal Problem
1
7
1
7
1
3.1 Effect on Carbon consumption rate before RCA The machine runs continuously in whole month without any break except breakdowns and change over. Production of compound batch produces in three shifts. 700 - 750 batches are produced per day. Overall 22500 compound batches are produced by banburry machine in a month. Most of the rubber batches include carbon in mixing process. Also Refilling of rubber compound is done for some rubber sheets before sending to final processing where carbon is not used. Approximately compound batch production = 22500 batches Production per day = 1440 minutes = 24 hours = 750 batches approx. The average value of carbon weighing compliance before RCA is 89.35. The tolerance given for weighing of carbon in mixing process is +0.5 Kg or -0.5 Kg to the original value. The less or high consumption of carbon in mixing of rubber sheet result in affecting different properties. Also if the high consumption is done in mixing batches the extra carbon is needed than the regular amount which will be ensured in loss.
3.2
Data Analysis Analysis is a method used to identify the failure or breakdown of machine in detailed.
DMAIC is acronyms of the major steps within the methodology namely define, measure, 28
analyze, improve, control. DMAIC process is the basic foundation of plant optimization pillar. The Six-Sigma program achieves reduction of breakdowns through redesigning or replacing the detoriated part of machine and improves the quality of the output in the process by working on the technical factor as well as the human factor involved in the production process. Since human factor is more crucial because the technical factor can be optimally exploited only by a committed work force, the team chartering is taken up before the application of the DMAIC technique. Team chartering is the process by which the team is formed, its mission or task described, its resources allocated, its goals set, its membership committed and its plans made (Kumara, 2013). To implement DMAIC effective team must be organized based on knowledge, skills, abilities, and personal attributes. Below Figure 3.1 gives the schematic representation of DMAIC phases. The five DMAIC phases and key tools used in each phase are listed below (Kumar, 2008). i.
Define : Pareto analysis, project charter
ii.
Measure: Descriptive Statistics; Process Capability Analysis.
iii.
Analyze. Detailed Process Map; Why-Why analysis
iv.
Improve. Experimentation; New Check sheet.
v.
Control. Statistical Process Control.
Step 1 DEFINE
Step2 MEASURE
Step 3 ANALYSE
Step 4 IMPROVE
Step 5 CONTROL
• Gain alignment on the actionable project and get approval to move forward with project work. • Identify and collect data surrounding influencing factors.
• Utilize problem solving tools to determine root cause. • Prioritize implementation of countermeasures based on analysis of causes. • Ensure that countermeasures are effective and gains are sustained through detailed control activities
Figure 3.1: DMAIC phases 29
1.
Define phase The first phase in a DMAIC Six Sigma is the Define phase that uses Pareto analysis to
identify the frequency of breakdown zone wise that will be worked on as part of continuous improvement process. Project objective statement: The objective of the project is to improve the value of carbon weighing compliance of mixing system of banburry machine up to 100%. Also to identify and reduce breakdown without any replacing part of machine, if is not required in that condition. The breakdown can be reduce using doing analysis of the repeated breakdown of machine with the help of why-why analysis tool. By controlling breakdown through analysis a preventive maintenance schedule is formed for carbon handling and transporting system with terotechnology concept.
Project goal: Improvement in Carbon weighing compliance of mixing system of
Banburry machine.
Problem Formulation: Carbon is one of the essential raw element in the mixing of
rubber compound but because of some carbon failures occurring repetitively, the carbon weighing compliance value is reduced to 85-90%. So this project work is mainly focused on increasing the carbon weighing compliance value up to 100% and reducing the repetitive carbon breakdowns. So by improving the carbon weighing compliance the carbon usage should be optimized for each rubber compound production.
2.
Measure phase This is a second phase of collecting data on measurable parameters of the process. The
objective is to determine what is able to provide the process. During this stage, it is important to focus on critical parameters for the quality, that is, those whose influence on the result is the largest. In this phase it is essential to consolidate the data from data base in order to keep consistency and completeness. As data is taken come other source i.e. from define phase validity of data must check rationally. From collected data make the base line of problem statement to identify the detail error for further phase (Pan, 2007). As the carbon is one of essential component in rubber manufacturing in Banburry machine, it is critical to detect most carbon breakdown i.e. repeated breakdown along with frequency is taken and sorted out using bar chart. The data regarding the value of carbon weighing compliance is measured from January 2017 to December 2017, given in table 3.2 and the bar chart is plotted for the values of carbon weighing compliance month wise given in Figure 3.2. Further the data regarding the carbon breakdowns are measured from the month of January 2017 to December 2017, given 30
in table 3.3 and the bar chart is plotted of top 5 carbon problems in two bar charts i.e. 1) Carbon problem vs Total downtime given in Figure 3.3 and 2) Carbon problem vs Frequency given in Figure 3.4.
% carbon
Carbon weighing compliance of year 2017 90.2 % Carbon… 90 89.8 89.95 89.87 89.6 89.68 89.4 89.65 89.48 89.43 89.2 89.23 89 89.12 89.05 88.8 88.83 88.6 88.78 88.69 88.4 88.2 88
Months 2017 Figure 3.2: Before RCA values of carbon weighing compliance of year 2017 (Note: % carbon weighing compliance data for each month is based on the average data
Carbon downtime (mins)
collected on each day.)
1600 1400 1200 1000 800 600 400 200 0
Total
1503
Linear (Total)
1141 637 376
228 carbon weighing slow
Carbon Carbon 510 carbon discharge overweighing weighing problem problem slow Carbon Breakdowns
319
630 carbon weighing slow
Figure 3.3: Top 5 breakdowns based on total downtime 31
frequency
Total
140 120 100 80 60 40 20 0
Linear (Total)
123 86 56 33
228 carbon weighing slow
Carbon Carbon 510 carbon discharge overweighing weighing problem problem slow
28
630 carbon weighing slow
Carbon Breakdowns Figure 3.4: Top 5 breakdowns based on frequency 3.
Analyze phase: The development of suitable sustainability assessment and design decision
methodologies are of upmost importance. Due to the sophistication of processes, the fundamental causes leading to an inferior sustainability performance could be hiding deep down from the surface. The analyze process used is Root cause analysis tool i.e. why-Why analysis. Root Cause Analysis is a method that is used to address a problem or nonconformance, in order to get to the root cause of the problem. Root Cause is the factor that, when you fix it, the problem goes away and doesn‘t come back (Kumar, 2013). Using root cause analysis tool i.e. 5-WHY method problem in machine is easy to identify the root cause of problem and action can take to prevent the breakdown by using counter measure. The Root cause analysis involves steps as following:
Data collection from Table 3.2 and 3.3.
Root cause identification using Why-Why analysis
Bar chart
32
Top 5 breakdowns are identified on the basis of total downtimes and frequency as shown in Measure phase. 1) 228 carbon weighing slow 2) Carbon discharge problem 3) Carbon overweighing problem 4) 510 carbon weighing slow 5) 630 carbon weighing slow It is observe that no clear root cause of problem is identified so using the 5-Whys is a simple way to try solving a stated problem without a large detailed investigation requiring many resources. By repetitively asking the question, 5 why? Root cause of repetitive breakdown is identified as shown in below problem statement. 1.
Root Cause Analysis of 228 carbon weighing slow: Table 3.4: Why-Why analysis for 228 carbon weighing slow Why Why Analysis
1Phenomenon
2 - Physical Analysis
3Contributing Conditions
What happened? (1H)
Why 1 How it happened? (2D,2E)
Why 2
Carbon jam After Every 2-3 at the neck batch of carbon section of 228, the flow of debin carbon get slowed down in 228 carbon weighing Air booster weighing hopper from working slow debin. Also Weighing carbon jam has screw speed been observed setting at neck section area of debin. Air purging valve
4 - Determine Root Cause
Why 3
Cake formation at neck section
Why 4
Why 5
56Trouble Countermeasure shooting Action taken to fix
Action taken to prevent reoccurrence.
Small L-1 Carbon Neck size Communication quality cleaned cake need to be done issue. found. with supplier
Checked found ok Checked found ok Checked found ok 33
L-2 Plan for cleaning debin 228.
Table 3.4 gives the Why – Why analysis for the problem 228 Carbon weighing slow. Slow carbon weighing is defined as the flow of carbon get slowed from debin to hopper area. Here, after every 2-3 batch carbon is getting jammed at neck section area of debin for the formation of small size cake. Further the different causes found out for the formation of cake and 228 carbon weighing slow and the corrective measure is given. Corrective Counter Measure A counter measure is an action, process that prevents or mitigates the effects of breakdown in machine. In this case counter measure action taken is preparing schedule for weekly cleaning of carbon debin 100B (228). Also the supplier of carbon 228 is communicated for the good quality of carbon. 2.
Root Cause Analysis of Carbon discharge problem: Table 3.5: Why-Why analysis for Carbon discharge problem Why – Why Analysis
1Phenomenon
2 - Physical Analysis
3Contributi ng Conditions
What happened? (1H)
Why 1 How it happened? (2D,2E)
Why 2
4 - Determine Root Cause
Why 3
Why 4
Why 5
65- Trouble Countermeasu shooting re Action taken to fix
Action taken to prevent reoccurrence.
Valve open and close manually operated
Inspection of discharge valves should be done with PM.
Check by Air motor decoupling working Found Ok. Carbon was not discharging in both auto as well as manual mode. Carbon Also carbon discharge leakage has been problem discharge observed at valve mixer and charging door jammed area.
Bladder Found ok. (valve seal) (approxima pressure high te 40 psi) Air motor Found ok. operating No pressure low, Leakage. any leakage. Carbon cake formation Buster and valve Found deposition on operation ok. inner side of failure hopper above valve.
34
Table 3.5 gives the Why – Why analysis for Carbon discharge problem. The discharge of carbon gets delayed because of improper functioning of the parts of weighing and discharging system. The sensors get rusted and the discharge valve gets jammed because of nature of carbon. Further the different causes found out for carbon discharge problem and the corrective measure is given. Corrective Counter Measure: Daily monitoring of pressure gauge which comes under preventive maintenance checklist. Also new daily check sheet is formed for checking the necessary checkpoints of debins such as air pressure, transporting pressure, flow pressure. Also a cleaning schedule should be formed for cleaning of debins on time. 3.
Root Cause Analysis of Carbon overweighing problem Table 3.6: Why-Why analysis for Carbon overweighing problem Why - Why Analysis
1Phenomen on
2 - Physical Analysis
What Why 1 happened? How it happened (1H) (2D,2E)
3Contributin g Conditions Why 2
During some Valve of the carbon signal batches, the Inspection valve and screw Discharge operation were showing valve condition carbon normal on overmachine weighing panel, but problem actually carbon weight is increasing Purging valve gradually Inspection even after closing discharge valve.
4 - Determine Root Cause
Why 3
Why 4
Why 5
65- Trouble Countermeasur shooting e Action taken Action taken to to fix prevent reopportunity occurrence.
Found Ok. Seal got damage and leakage.
Carbon cake Discharge Bin cleaning Jam formation valve once in 15 near in carbon. changed. days. Valve.
Buster operating carbon solenoid dust in valve valve bypassed.
35
Purging valve changed.
One more discharge valve is added below weighing hopper.
Table 3.6 gives the Why – Why analysis for Carbon overweighing problem. Carbon Overweighing is defined as the weighing of extra carbon in hopper than required condition because of its lightweight nature and deficiency of weighing sensors. Sometimes the carbon weight increases gradually even after the required condition is satisfied. Further the different causes found out for carbon overweighing problem and the corrective measure is given. Corrective Counter Measure There is one discharge valve below the weighing hopper previously which fails to stop the carbon flow in mixing sometimes. So one more discharge valve is added below weighing hopper to immediately close the carbon flow in mixing. Also the schedule for cleaning the debins should be formed monthly. 4.
Root cause analysis of 510 carbon weighing slow Table 3.7: Why-Why analysis for 510 carbon weighing slow
Why - Why Analysis 312 - Physical 4 - Determine Root Contributing Phenomenon Analysis Cause Conditions Why 1 What How it happened? Why 2 Why 3 Why 4 Why 5 happened? (1H) (2D,2E)
Feeder valve not getting Open on proper 510 carbon time. weighing Thus the slow time required for weighing carbon is more.
Feeder valve air supply checking
Feeder valve jammed
5- Trouble 6shooting Countermeasure Action taken to fix opportunity
Action taken to prevent reoccurrence.
No air supply Air tube to feeder damage. valve
PU Temporary Replace all tubes tube cut and tube in Day used fixed. bin. currently are old. Carbon Need to Strap Foreign bag communicate removed & material opening incident in checked stuck at side strap carbon area valve flap of found at operators & operation valve the flap of consult them found ok. valve. all
Table 3.7 gives the Why – Why analysis for the problem 510 Carbon weighing slow. Slow carbon weighing is defined as the flow of carbon get slowed from debin to hopper area. Here, after every 2-3 batch carbon is getting jammed at neck section area of debin for the formation
36
of small size cake. Further the different causes found out for the formation of cake and 510 carbon weighing slow and the corrective measure is given Counter Measure: The formation of daily check sheet for checking the important and critical parts of debins like feeder valve, air pressure valves, and air tubes. Also communication should be done with the carbon area operator for checking quality of carbon before adding it to manufacturing process. 5.
Root cause analysis for 630 carbon weighing slow Table 3.8: Why-Why analysis for 630 carbon weighing slow Why- Why Analysis
312 - Physical Contributing Phenomenon Analysis Conditions Why 1 How it What Why 2 happened? (1H) happened? (2D,2E)
4 - Determine Root Cause
Why 3
Why 4
why 5
5- Trouble shooting
6Countermeasure
Action taken to fix opportunity
Action taken to prevent reoccurrence.
Small Carbon cake size formation cake above neck. found.
630 carbon weighing Slow.
Carbon jam above neck, booster found that Air not working below neck there properly. was no carbon. No flow of carbon under neck
Carbon choke Booster up in air flow booster low. nozzle.
Clean filter Booster cleaned and once in a 3 its flow set. month.
Carbon Checked jammed found above ok. neck
Table 3.8 gives the Why – Why analysis for the problem 630 Carbon weighing slow. Slow carbon weighing is defined as the flow of carbon get slowed from debin to hopper area. Here, after every 2-3 batch carbon is getting jammed at neck section area of debin for the formation of small size cake. Further the different causes found out for the formation of cake and 630 carbon weighing slow and the corrective measure is given Counter Measure Cleaning of filters is done with the help of manual or automatic purging daily. A schedule for replacement of filters should be followed if filters get damaged. Also formation of daily check sheet of debin must be formed for checking of critical parts of debins. 37
Step 2: Restore of Equipment and Correct Weakness In this step all the parts of machine which is not required are removed. If there is weakness in equipment while inspection in prevention maintenance schedule immediately action is taken by re-designing that part or replacing it. Using some standard tools weakened part of machine is repair and restores it like new operating condition. 4.
Improve phase Using the data from the implementation of RCA, it is now possible to improve the
process by designing creative solutions to fix and prevent problems. Three phases were adopted to improve machine reliability. Phase 4 i.e. improve phase is related to developing of preventive maintenance sheet. It includes machine modification and enhancement strategies that allow for easier maintenance. It also includes the monitoring of maintenance activities. In above three phases Define, Measure and Analyze, it is investigated using different tools like project charter, root cause of why analysis, top 5 breakdowns sorted out depending upon its frequency and total downtimes from month January 2017 to December 2017. Here in improve phase one more concept is considered and focused which is known as Terotechnology for restoring the equipment and correcting the weakness. Terotechnology has been defined as “A combination of management, financial, engineering, building and other practices applied to physical assets in pursuit of economic life cycle costs”. The term Terotechnology has been derived from Greek word ‘terein’ which means ‘take care of’’. Terotechnology applies equally to both assets and products because the product of one organization often becomes the asset of another. The basic emphasis of Terotechnology is the area of maximization of life cycle and minimization of downtime by using multi objective design engineering methodology and predictive or preventive maintenance of plant engineering equipments. Using above three phases it is observed that there are repetitive breakdowns of carbon in carbon handling and transporting system of banburry machine. So it is essential to prevent the mixing process of banburry machine from carbon breakdowns. For reliability of mixing process and carbon handling and transporting system of banburry machine, maintenance checklists are generated which consists of inspecting daily, weekly, quarterly and monthly. Table 3.9 gives the checklists used in Goodyear at the current state for inspection purpose. Different preventive maintenance checklists are given in Table 3.10 and table 3.11 respectively. 38
Table 3.9: Debin cleaning check sheet
Debin Cleaning check sheet Sr. No.
Bin
Last Cleaning
Date
1
100A (599)
5-Nov
2-Jan
2
200A (510)
26-Nov
9-Jan
3
200B (630)
3-Dec
16-Jan
4
100B (228)
15-Dec
23-Jan
5
100C (405)
16-Dec
30-Jan
Actual
Status
Checked by:Table 3.10: Carbon weekly inspection check sheet CARBON WEEKLY INSPECTION CHECK SHEET DATE BIN CODE Sr. No. Points To Be Check
Ok / Not Ok
1
Pulse Jet Regulator Operation
2
Door Leakage
3
Transporter Pressure
4
Dust Collector Solenoid Valve Bypass Check
5
Exhaust Fan Check
6
Timer Belt Check
7
Bin Boosters
8
Lines Leakage
9
Line Boosters
10 11 12
Clamps Bellows Check Loading Valve Filter Clean (Press Each Bin For 15 Min.)
39
Remarks / Observation
Checked By:-
Table 3.11: Daily carbon debin inspection check sheet
Daily Carbon Debin Inspection Check sheet Date: Sr. No. 1 2 3 4 5 6
7 8 9 10 11
Check Point
100A
100B 100C 200A 200B 200C 200D Remark
Transporter Pressure Puget valve operation Any air leakage Booster valve operation Booster air pressure Manual operation of butterfly valve Weighing screw timer belt condition Bellows condition Neck cleaning Discharge valve bellow Bin Cleaning (weekly one)
The checklist given in table 3.10 and 3.11 are made of the conditions of the critical parts of the carbon handling and transporting system of banburry machine. In the carbon weekly inspection check sheet, each carbon debin is completely checked and cleaned once a week. All the parts of that debin has been checked and inspected. If any fault is identified that part must be replaced or repaired. Also, In Daily carbon debin inspection check sheet, the parts of the debins and carbon handling and transporting system are inspected visually and the data has been written down in check sheet and then analyzed and send to the maintenance manger to help in creating Preventive maintenance schedule. 5.
Control phase The control phase is the last and final phase and its sole purpose is to preserve the
optimized response obtained from the experiments. In a control phase, the responsibility of the maintenance department is to monitor the work of the operators and to rectify any issues 40
raised on shop floor. The associated special causes were determined and action was taken to correct the problem before nonconformities are produced. The critical process parameters are continuously monitored and the documentation maintained and updated with information at regular intervals. Control phase is last phase of DMAIC phases. To keep machine reliable and breakdown free, prevention of breakdown work process flow can use. When any critical part of machine gets breakdown, using root cause analysis breakdown can be analyzed and prevent to failure using 5 why’s. As breakdown occurs data should be manually entered on sheet or in system for further analysis. There are 2 types to prevent failure of machine. First is to inspect all similar equipment and repair all defects so as to prevent failure and second type is to apply counter measure level on failure parts it may be permanent or not. If yes then verify results of breakdown and if no then identify and implement best level of counter measure. For continuous improvements and machine reliability create inspection standard, maintenance standard etc. The Flow chart gives details of repetitive breakdown prevention as given in Figure 3.5. In this flow chart, first the carbon breakdown is identified the why- why analysis is carried out and the defects are removed with repairing and replacement and the countermeasure for that problem is given. Further it is inspected and checked whether the counter measure is permanent or not. If defects are occurring after the proper treatment, then the improvement in solution is carried out and again checked for given countermeasure for the carbon breakdown.
Figure 3.5: Work process flow chart for the Prevention of repetitive breakdown
41
Figure 3.6, 3.7 and 3.8 gives the images of check sheet that are regularly followed and update is taken weekly. Figure 3.6 gives the current recording of check sheet used at the plant for preventive maintenance. Figure 3.7 and 3.8 gives the newly created check sheets for effective preventive maintenance of the carbon handling and transporting system of the banburry machine.
Figure 3.6: Carbon debin cleaning check sheet
Figure 3.7: Daily debin inspection check sheet
42
Figure 3.8: Carbon weekly inspection check sheet
43
Chapter 4 Results and Discussion
4.1
Results obtained after Root Cause Analysis As it is known that repetitive breakdown is in control by using preventive maintenance
checklist like daily debin inspection check sheet, Weekly inspection check sheet, debin cleaning check sheet. With why -why analysis tool where root cause of problem identified. All the critical parts of carbon handling and transporting system get inspected within these check sheet which help to give information of any carbon breakdown is occurring. Immediately the repair action taken place to control these breakdowns. After using DMAIC phase’s further three months data of carbon weighing compliance and carbon breakdown is analyzed from February 2018 to April 2018. The analysis for the value of carbon weighing compliance and repetitive carbon breakdowns occurred month wise from February 2018 to April 2018 are discussed below I.
Carbon weighing compliance for February 2018 to April 2018 The check sheet used in improvement phase are followed regularly and the proper care
has been taken of the carbon handling and transporting system which resulted in constant improvement in the value of carbon weighing compliance. As the function of terotechnology 44
says the preventive check sheets mainly focused on the critical part of carbon system continuously from January 2018. The check sheets are followed regularly which results in the improvement of value of carbon weighing compliance constantly from January 2018 itself. The target value considered for carbon weighing compliance is 100% and tried to achieve in the months of February 2018 to April 2018. The data of carbon weighing compliance of February, March, and April 2018 is recorded daily and mentioned below in Table 4.1. Also the average of each month is calculated to compare with the value of carbon weighing compliance after RCA and before RCA Table 4.1: Daily value of carbon weighing compliance for months of February 2018 to April 2018
Date
% Carbon Compliance
Date
% Carbon Compliance
Date
% Carbon Compliance
1-Feb-18
95.14
1-Mar-18
94.79
1-Apr-18
98.13
2-Feb-18
94.60
*2-Mar-18
-
2-Apr-18
98.84
3-Feb-18
95.20
3-Mar-18
97.23
3-Apr-18
97.59
4-Feb-18
95.57
4-Mar-18
97.13
4-Apr-18
98.23
5-Feb-18
95.35
5-Mar-18
96.63
5-Apr-18
98.00
6-Feb-18
97.18
6-Mar-18
95.85
6-Apr-18
97.68
7-Feb-18
97.66
7-Mar-18
95.54
7-Apr-18
94.12
8-Feb-18
98.40
8-Mar-18
97.65
8-Apr-18
98.36
9-Feb-18
98.10
9-Mar-18
94.53
9-Apr-18
96.54
10-Feb-18
97.52
10-Mar-18
96.22
10-Apr-18
94.74
11-Feb-18
98.25
11-Mar-18
94.44
11-Apr-18
96.34
12-Feb-18
98.79
12-Mar-18
96.79
12-Apr-18
95.73
13-Feb-18
97.41
13-Mar-18
94.44
13-Apr-18
97.38
14-Feb-18
98.10
14-Mar-18
95.13
14-Apr-18
97.88
15-Feb-18
98.13
15-Mar-18
94.67
15-Apr-18
98.16
16-Feb-18
98.52
16-Mar-18
95.37
16-Apr-18
99.33
45
Date
% Carbon Compliance
Date
% Carbon Compliance
Date
% Carbon Compliance
17-Feb-18
95.35
17-Mar-18
95.09
17-Apr-18
97.60
18-Feb-18
97.76
18-Mar-18
94.89
18-Apr-18
99.22
19-Feb-18
97.55
19-Mar-18
95.67
19-Apr-18
98.89
20-Feb-18
99.07
20-Mar-18
95.50
20-Apr-18
96.65
21-Feb-18
98.36
21-Mar-18
95.80
21-Apr-18
97.23
22-Feb-18
97.81
22-Mar-18
95.66
22-Apr-18
96.05
23-Feb-18
97.58
23-Mar-18
95.96
23-Apr-18
97.75
24-Feb-18
98.01
24-Mar-18
97.11
24-Apr-18
96.84
25-Feb-18
97.36
25-Mar-18
97.51
25-Apr-18
97.62
26-Feb-18
97.50
26-Mar-18
96.16
26-Apr-18
98.86
27-Feb-18
96.09
27-Mar-18
97.48
27-Apr-18
98.43
28-Feb-18
94.59
28-Mar-18
97.51
28-Apr-18
98.24
29-Mar-18
96.90
29-Apr-18
96.70
30-Mar-18
97.16
30-Apr-18
96.23
31-Mar-18
98.18
Total
2720.95
Total
2882.99
Total
2923.36
Average
97.18
Average
96.10
Average
97.44
(Note: *2-Mar- 18 – is a holiday given by company so the value of carbon weighing compliance for that day is not considered.) The average value of the carbon weighing compliance for the month of February 2018, March 2018, and April 2018 is mentioned in Table 4.2 and bar chart is drawn with average value of % carbon weighing compliance against moths of 2018 as given in Figure 4.1. Table 4.2: Value of carbon weighing compliance month wise after using RCA Sr.no.
Month
%carbon compliance
1
February 2018
97.18
2
March 2018
96.10
3
April 2018
97.44 46
Target (%)
100
%carbon compliance after RCA
100 %carbon…
%carbon compliance
100 99 98
97.44
97.18
97
96.10
96 95 94 Feb-18
Mar-18
Apr-18
Target
months
Figure 4.1: Value carbon weighing compliance after RCA for month of February 2018 to April 2018 II.
Total downtime caused by Carbon breakdowns from February 2018 to April 2018
After finding the top repetitive breakdowns and by using root cause analysis to find out the causes behind the repetitive breakdowns it is easy to counter those problems with proper solutions. Hence by following the preventive maintenance check sheet regularly and solving the carbon breakdowns immediately resulted in the reduction of total downtime caused by carbon breakdowns affecting carbon compliance which automatically resulted in improving the value of carbon weighing compliance which automatically satisfies the primary objective. The data collected for downtime caused by carbon breakdowns from February 2018 to April 2018 is given in Table 4.3 with the help of pivot in three part carbon problem, downtime caused and its frequency. The downtimes of only those carbon breakdowns are considered which affects carbon weighing compliance. Table 4.3: Total downtime and frequency of carbon breakdowns after using RCA Sr.no. 1 2 3 4 5 6
Carbon Problems Carbon weighing slow 228 carbon weighing slow carbon weighing and discharge problem carbon weighing / discharge problem 599 carbon weighing problem 510 carbon weighing slow 47
Total downtime 637 258 124 33 31 29
Frequency 60 24 15 4 2 2
Sr.no. 7 8 9 10 11 12 13
Carbon Problems
Total downtime
Frequency
18 14 14 13 12 9 9
1 2 1 1 1 1 1
8
1
5 5 3 1222
1 1 1 119
1171 carbon weighing slow Carbon discharge fault 228 weighing slow 405 excess weighing Carbon weighing slow weight delay 405 carbon weighing slow 228 Carbon weighing and discharge problem 1171 silica weighing problem 228 Weighing and discharge problem 228 carbon discharge fault Total
14 15 16 17
The total downtime of carbon breakdowns affecting carbon compliance for the month of February 2018, March 2018, and April 2018 is mentioned in Table 4.4. Table 4.4: Total downtime caused by carbon breakdowns from February 2018 to April 2018 Sr. No.
Months
1 2 3
February 2018 March 2018 April 2018
Total downtime of carbon breakdowns effecting carbon compliance(min.) 407 367 448 1222
Total
4.2 Analysis of carbon weighing compliance and downtime caused by carbon breakdowns before and after RCA In Table 4.5, the values of carbon weighing compliance is given before root cause analysis from month January 2017 to December 2017 and after root cause analysis from month February 2018 to April 2018.
48
Table 4.5: Analysis of carbon weighing compliance value for Period January 2017 to December 2017 before RCA and From February 2018 to April 2018 after RCA % Carbon compliance from January 2017 to December 2017 before RCA Sr. No.
Months
Target
% Carbon compliance
1 2 3
January 2017 February 2017 March 2017
100 100 100
89.65 89.43 89.87
4
April 2017
100
89.12
5
May 2017
100
89.23
6
June 2017
100
88.63
7 8
July 2017 August 2017
100 100
89.68 89.48
9
September 2017
100
88.78
10 11 12
October 2017 November 2017 December 2017
100 100 100
89.05 89.95 89.65
Average carbon compliance (%)
89.35
% Carbon compliance from February 2018 to April 2018 after RCA Sr. No.
Months
Target
% Carbon compliance
1
February 2018
100
97.18
2
March 2018
100
96.10
3
April 2018
100
97.44
Average carbon compliance (%) 96.91
In Figure 4.2, the bar chart is drawn for the data before root cause analysis and after root cause analysis. From January 2017 to April 2018, the average value of % carbon weighing compliance is on Y- axis and the months on X- axis. The bar chart shows the improvement in the value of carbon weighing compliance between before RCA and after RCA.
49
% Carbon compliance
% Carbon compliance vs Months
After RCA
100 98
100
97.44
97.18
% carbon compliance
96.10
Before RCA
96 94
93.25
92 89.87 90 89.65 89.43 89.12 89.23
89.68 89.48 88.63
89.95 89.65 88.78 89.05
88 86
Months
Figure 4.2: Carbon weighing compliance from month of January 2017 to April 2018 Table 4.6 gives the average downtime of year 2017 before RCA and average downtime of month February 2018 to April 2018 i.e. after RCA is given. The average is calculated for before RCA and after RCA to get the reduction of downtime caused by carbon breakdowns. Table 4.6: Analysis of total downtime for Period January 2017 to December 2017 before RCA and From February 2018 to April 2018 after RCA Total downtime caused by carbon breakdowns from January 2017 to December 2017 before root cause analysis Sr. No. 1
Months
Total time Target period (months)
Total Downtime (mins)
Average Downtime(mins)
January 2017 to 12 0 5884 490.333 December 2017 Total downtime caused by carbon breakdowns from February 2018 to April 2018 after root cause analysis
Sr. No.
Months
1
February 2018 to April 2018
Total time Target period (months) 3
0
50
Total Downtime (mins)
Average Downtime(mins)
1222
407.33
Using values from Table 4.5 and 4.6, carbon weighing compliance for before root cause analysis and after root cause analysis was calculated for period of January 2017 to April 2018. Also the value of total downtime caused by carbon breakdowns before root cause analysis and after root cause analysis was calculated for period of January 2017 to April 2018. Final calculation of average values is given in Table 4.7. Table 4.7 Average value of carbon weighing compliance and total downtime caused by carbon breakdowns before and after RCA Before Root Cause Analysis
After Root Cause Analysis
Average value of
Average value of
Average value of
Average value of
Carbon weighing
downtime caused by
Carbon weighing
downtime caused
compliance (%)
carbon breakdowns
compliance (%)
by carbon
(min) 89.35 1.
breakdowns (min)
490.33
96.91
407.33
Improvement in average value of Carbon weighing compliance (%): Increase in average value of Carbon weighing compliance (%) = Average carbon compliance fter
A
Average carbon compliance before
A
Increase in average value of Carbon weighing compliance (%) = 6. 1-8 . 5 Increase in average value of Carbon weighing compliance (%) = 7.55% 2.
Reduction in average value of downtime caused by carbon breakdowns :
Reduction in average value of downtime caused by carbon breakdowns = initial average downtime before A finial average downtime after initial average carbon downtime before A Reduction in average value of downtime caused by carbon breakdowns = 0. 07. 100 07. Reduction in average value of downtime caused by carbon breakdowns = (83.003/490.33)*100 Reduction in average value of downtime caused by carbon breakdowns = 16.92%
4.3
Discussion 51
A
100
After implementation of proper maintenance schedule and giving training to the operators and maintenance persons, data were collected to estimate the improvement in carbon weighing compliance and reduction in downtime of carbon breakdowns affecting carbon weighing compliance where annual target was set respectively. The analysis for every month has been plotted in bar chart which shows that there are improvements from February 2018 to April 2018 as given in Figure 4.1, value of carbon weighing compliance from January 2017 to April 2018 respectively. It is clear from Table 4.7 that Percentage value of carbon weighing compliance is improved by 7.55% and the reduction in average downtime has occurred with carbon breakdowns affecting carbon compliance by almost 83 mins (i.e. 16.92%).
52
Chapter 5 Conclusions and Future Scope 5.1
Conclusions
Based on the analysis executed, following conclusions can be drawn: 1. Plant Optimization technique has been used to investigate the root cause of problem occurred at machine. 2. The average value of % carbon weighing compliance is increased to 96.91% and average downtime caused by carbon breakdown decreased by 16.92% for mixing of banburry machine. 3. There is an improvement in carbon handling and transporting of banburry machine because of proper training to operators, preventive maintenance schedule and also due to use of terotechnology principals. 4. After using RCA, it is observed that excess use of carbon in compound batches decreased from February 2018. Also the carbon leakage is reduced due to reduction in carbon breakdowns. 5. It is concluded that using plant optimization process and terotechnology concept together for the machine should properly take care the machine and helps in reduction of breakdowns and the value of carbon weighing compliance is improved. 53
5.2
Future scope This dissertation work demonstrated the use of the DMAIC Six Sigma process with
terotechnology to solve problem regarding carbon compliance of banburry machine. The DMAIC Six Sigma using Plant Optimization process is an excellent fit for the machining industries. Companies should also choose projects that can be measured and that potentially have a good return on quality. Using DMAIC methodology it is observed that machine can be reliable. The present work shows that DMAIC methodology analysis helps in improving carbon weighing compliance by reducing down time caused by carbon breakdowns of the machine. With the use of terotechnology combined with DMAIC six sigma tools it is made easier to take care of entire carbon transporting and handling system of banburry machine. The value of carbon weighing compliance should be achieved 100% with the help of autonomous maintenance or by using real time monitoring techniques of IOT.
54
References Arunraj K., Maran M., “A review of tangible benefits of TPM implementation”, International. Journal of Applied Sciences and Engineering Research, 3.1 (2014) 171-176. Azizi A., “Evaluation Improvement of Production Productivity Performance using Statistical Process
ontrol, Overall Equipment Efficiency, and Autonomous Maintenance”, 2nd
International Materials, Industrial, and Manufacturing Engineering Conference, MIMEC2015, 4-6 February 2015, Bali Indonesia, Procedia Manufacturing 2 (2015) 186 – 190. Barbosa B., Pereira M.T., Silva F.J.G., Campilho R., “Solving quality problems in tyre production preparation process: a practical approach”, 27th International
onference on
Flexible Automation and Intelligent Manufacturing, FAIM2017, 27-30 June 2017, Modena, Italy, Procedia Manufacturing 11 (2017) 1239–1246. Cunha C., Dominguez C., “A DMAI project to improve warranty billing’s operations: a case study in a Portuguese car dealer”,
onference on Enterprise Information Systems /
International Conference on Project Management / Conference on Health and Social Care Information Systems and Technologies, Procedia Computer Science 64 ( 2015 ) 885 – 893. Das P., Nath T., “ oot cause analysis of the major equipment breakdown problems of the tube section of a FM G company as an approach to improve OEE”, International Journal of Engineering Trends and Technology 27.4 (2015) 207-213. Erbiyik H., Saru M., “Six Sigma Implementations in Supply hain: An Application for an Automotive Subsidiary Industry in Bursa in Turkey”, World
onference on Technology,
Innovation and Entrepreneurship, Procedia - Social and Behavioral Sciences 195 (2015) 2556–2565. Fouad R.H., Obeidat S., Mandahawi N., “An Application of ustomized Lean Six Sigma to Enhance Productivity at a Paper Manufacturing ompany”, Jordan Journal of Mechanical and Industrial Engineering, Volume 6, Number 1, Feb. 2012, Pages 103 – 109 Gejdoš P., “ ontinuous Quality Improvement by Statistical Process
ontrol”, Business
Economics and Management 2015 Conference, BEM2015, Procedia Economics and Finance 34 (2015) 565 – 572. 55
Jayswal A., Li X., Zanwar A., Lou H.H., Huang Y., “A sustainability root cause analysis methodology and its application, Computers & chemical engineering”, 5.12 (2011) 27862798. Jin T., Liao H., Luo W., “Failure time based reliability growth in product development and manufacturing”, eliability and Maintainability Symposium ( AMS), (2007) 88-493. Kumar P., Rudramurthy R., “Analysis of breakdowns and improvement of preventive maintenance on 1000 ton hydraulic press”, International Journal of Emerging Technology and advanced Engineering (IJETAE), 3.8 (2013) 636-645. Kiran M., Mathew C., Kuriakose J., “ oot cause analysis for reducing breakdowns in a manufacturing industry”, International Journal of Emerging Technology and Advanced Engineering, 3.1 (2013) 211-216. Kurdve M., Bengtsson M., “Machining Equipment Life Maintenance
ost”, 2 rd
I P
onference on Life
ycle osting Model with Dynamic
ycle Engineering, Procedia
I P 8
(2016) 102 – 107 Lee S., Rousseau M., Durland L., “Lean Six Sigma for Intravenous Therapy Optimization: A Hospital
Use
of
Lean
Thinking
to
Improve
Occlusion
Management”,
https://doi.org/10.1016/j.java.2018.01.002
Li MHC, Al-Refaie A., Yang C.Y., “DMAI
approach to improve the capability of SMT
solder printing process”, IEEE Transactions on Electronics Packaging Manufacturing , 1.2 (2008) 126-133. Lomte R.U., Bhosle S.P., Ambad P.M., Gaikwad R.A, “ eliability Improvement for TSR Machine of Banburry Mixer using Plant Optimization Process”, 2nd International onference on Materials Manufacturing and Design Engineering, Procedia Manufacturing 20 (2018) 440– 445. Mahto D., Kumar A., “Application of root cause analysis in improvement of product quality and productivity”, Journal of Industrial Engineering and Management, 1.2 (2008) 16-53. Mehrabi J., “Application of six-sigma in educational quality management”, Procedia - Social and Behavioral Sciences 47 (2012) 1358–1362.
56
Y-ICER 2012,
Mast J., Lokkerbol J.., “An analysis of the Six Sigma DMAI method from the perspective of problem solving”, International Journal of Production Economics, 1
.2 (2012) 60 -614.
Milliken Institute, Shanghai, Plant optimization, (Good Year South Asia Tyres Pvt. Ltd). Pan Z., Ryu H., Baik J., “A Sigma DMAI
ase Study:
M Adoption Success Factor Analysis and Six
Application”, Software Engineering
esearch, Management & Applications
(SERA), (2007) 828-835. Pugna A., Negrea R., Miclea S., “Using Six Sigma Methodology to Improve the Assembly Process in an Automotive
ompany”, SIM 2015 / 1 th International Symposium in
Management, Procedia - Social and Behavioral Sciences 221 (2016) 308–316. Ridwansyah M., Indrawati S., “Manufacturing
ontinuous Improvement Using Lean Six
Sigma: An Iron Ores Industry ase Application”, Industrial Engineering and Service Science 2015, IESS 2015, Procedia Manufacturing 4 (2015) 528–534 Rohini R., Mallikarjun J., “Six Sigma:
Improving the Quality of Operation Theatre”,
International Conference on Asia Pacific Business Innovation & Technology Management, Procedia - Social and Behavioral Sciences 25 (2011) 273 – 280. Roman Z., Jevgeni S., Eduard S., “Framework for
ontinuous Improvement of Production
Processes and Product Throughput”, 25th DAAAM International Symposium on Intelligent Manufacturing and Automation, DAAAM 2014, Procedia Engineering 100 ( 2015 ) 511 – 519 Shaikh S. and Kazi J., “A review on six sigma (DMAI ) methodology”, International Journal of Modern Engineering Research (IJMER), 5.2 (2015) 11-16. Silva FJG, Costa T., Ferreira L.P., “Improve the extrusion process in tire production using Six Sigma methodology”, Manufacturing Engineering Society International Conference 2017, MESIC 2017, 28-30 June 2017, Vigo (Pontevedra), Spain, Procedia Manufacturing 13 (2017) 1104–1111 Smętkowska M., Mrugalska B., “Using Six Sigma DMAI
to improve the quality of the
production process: a case study”, SIM 2017 / 1 th International Symposium in Management, Procedia - Social and Behavioral Sciences 238 ( 2018 ) 590 – 596
57
Sokovic M., Pavletic D., Pipan K.K., “Quality Improvement Methodologies – PDCA Cycle, RADAR Matrix, DMAIC and DFS”, Journal of achievements in Material and Manufacturing Engineering, vol.1 Issue Nov.2010. Srinivasana K., Muthub S., Devadasanc S.R., Sugumarand C., “Enhancing effectiveness of Shell and Tube Heat Exchanger through Six Sigma DMAI phases”, 12th Global Congress On Manufacturing And Management, Gcmm 2014, Procedia Engineering 97 ( 2014 ) 2064 – 2071 Srinivasana K., Muthu S., Prasad N.K., Satheeshd G., “Reduction of paint line defects in shock absorber through Six Sigma DMAIC phases”, 12th Global Congress On Manufacturing And Management, Gcmm 2014, Procedia Engineering 97 (2014) 1755 – 1764 Tenera A., Pinto L., “A Lean Six Sigma (LSS) project management improvement model”, 27th IPMA World Congress, Procedia - Social and Behavioral Sciences 119 (2014) 912–920 Thomas A., Barton R., Byard P., “Methodology and theory developing a six sigma maintenance model”, Journal of Quality in Maintenance Engineering (JQME), 1 . (2008) 262-271. Youssouf A., Rachid C., Ion V., “ ontribution to the optimization of strategy of maintenance by lean six sigma”, Physics Procedia,55 (201 ) 512 -518. Yun W.Y., Park G., Han Y.J., “An optimal reliability and maintainability design of a searching system”, ommunications in Statistics-Simulation and Computation, (2014) 19591978.
58
Publications 1. Saurabh Vaidya, Prashant Ambad, Santosh Bhosle, “Industry 4.0 – A Glimpse”, Procedia
Manufacturing 20 (2018) 233–238. 2. Saurabh Vaidya, Santosh Bhosle, Prashant Ambad, Anish Kumar, “DMAIC Approach to Improve Carbon Weighing
ompliance of Banburry Machine”, communicated,
International Journal of Advanced Manufacturing Technology.
59
The