Chapter 15. Mixed Models. A flexible approach to correlated data. 15.1 Overview.
Correlated data arise frequently in statistical analyses. This may be due to ...
Chapter 15 Mixed Models A flexible approach to correlated data.
15.1
Overview
Correlated data arise frequently in statistical analyses. This may be due to grouping of subjects, e.g., students within classrooms, or to repeated measurements on each subject over time or space, or to multiple related outcome measures at one point in time. Mixed model analysis provides a general, flexible approach in these situations, because it allows a wide variety of correlation patterns (or variancecovariance structures) to be explicitly modeled. As mentioned in chapter 14, multiple measurements per subject generally result in the correlated errors that are explicitly forbidden by the assumptions of standard (between-subjects) AN(C)OVA and regression models. While repeated measures analysis of the type found in SPSS, which I will call “classical repeated measures analysis”, can model general (multivariate approach) or spherical (univariate approach) variance-covariance structures, they are not suited for other explicit structures. Even more importantly, these repeated measures approaches discard all results on any subject with even a single missing measurement, while mixed models allow other data on such subjects to be used as long as the missing data meets the so-called missing-at-random definition. Another advantage of mixed models is that they naturally handle uneven spacing of repeated measurements, whether intentional or unintentional. Also important is the fact that mixed model analysis is 357
358
CHAPTER 15. MIXED MODELS
often more interpretable than classical repeated measures. Finally, mixed models can also be extended (as generalized mixed models) to non-Normal outcomes. The term mixed model refers to the use of both fixed and random effects in the same analysis. As explained in section 14.1, fixed effects have levels that are of primary interest and would be used again if the experiment were repeated. Random effects have levels that are not of primary interest, but rather are thought of as a random selection from a much larger set of levels. Subject effects are almost always random effects, while treatment levels are almost always fixed effects. Other examples of random effects include cities in a multi-site trial, batches in a chemical or industrial experiment, and classrooms in an educational setting. As explained in more detail below, the use of both fixed and random effects in the same model can be thought of hierarchically, and there is a very close relationship between mixed models and the class of models called hierarchical linear models. The hierarchy arises because we can think of one level for subjects and another level for measurements within subjects. In more complicated situations, there can be more than two levels of the hierarchy. The hierarchy also plays out in the different roles of the fixed and random effects parameters. Again, this will be discussed more fully below, but the basic idea is that the fixed effects parameters tell how population means differ between any set of treatments, while the random effect parameters represent the general variability among subjects or other units.
Mixed models use both fixed and random effects. These correspond to a hierarchy of levels with the repeated, correlated measurement occurring among all of the lower level units for each particular upper level unit.
15.2
A video game example
Consider a study of the learning effects of repeated plays of a video game where age is expected to have an effect. The data are in MMvideo.txt. The quantitative outcome is the score on the video game (in thousands of points). The explanatory variables are age group of the subject and “trial” which represents which time the subject played the game (1 to 5). The “id” variable identifies the subjects. Note
15.2. A VIDEO GAME EXAMPLE
359
the the data are in the tall format with one observation per row, and multiple rows per subject,
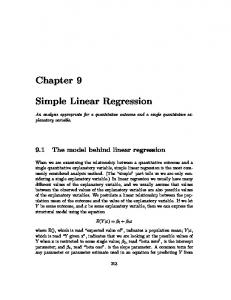
Figure 15.1: EDA for video game example with smoothed lines for each age group. Some EDA is shown in figure 15.1. The plot shows all of the data points, with game score plotted against trial number. Smoothed lines are shown for each of the three age groups. The plot shows evidence of learning, with players improving their score for each game over the previous game. The improvement looks fairly linear. The y-intercept (off the graph to the left) appears to be higher for older players. The slope (rate of learning) appears steeper for younger players. At this point you are most likely thinking that this problem looks like an ANCOVA problem where each age group has a different intercept and slope for the relationship between the quantitative variables trial and score. But ANCOVA assumes that all of the measurements for a given age group category have uncorrelated errors. In the current problem each subject has several measurements and
360
CHAPTER 15. MIXED MODELS
the errors for those measurements will almost surely be correlated. This shows up as many subjects with most or all of their outcomes on the same side of their group’s fitted line.
15.3
Mixed model approach
The solution to the problem of correlated within-subject errors in the video game example is to let each subject have his or her own “personal” intercept (and possibly slope) randomly deviating from the mean intercept for each age group. This results in a group of parallel “personal” regression lines (or non-parallel if the slope is also random). Then, it is reasonable (but not certain) that the errors around the personal regression lines will be uncorrelated. One way to do this is to use subject identification as a categorical variable, but this is treating the inherently random subject-to-subject effects as fixed effects, and “wastes” one parameter for each subject in order to estimate his or her personal intercept. A better approach is to just estimate a single variance parameter which represents how spread out the random intercepts are around the common intercept of each group (usually following a Normal distribution). This is the mixed models approach. From another point of view, in a mixed model we have a hierarchy of levels. At the top level the units are often subjects or classrooms. At the lower level we could have repeated measurements within subjects or students within classrooms. The lower level measurements that are within the same upper level unit are correlated, when all of their measurements are compared to the mean of all measurements for a given treatment, but often uncorrelated when compared to a personal (or class level) mean or regression line. We also expect that there are various measured and unmeasured aspects of the upper level units that affect all of the lower level measurements similarly for a given unit. For example various subject skills and traits may affect all measurements for each subject, and various classroom traits such as teacher characteristics and classroom environment affect all of the students in a classroom similarly. Treatments are usually applied randomly to whole upperlevel units. For example, some subjects receive a drug and some receive a placebo, Or some classrooms get an aide and others do not. In addition to all of these aspects of hierarchical data analysis, there is a variety of possible variance-covariance structures for the relationships among the lower level units. One common structure is called compound symmetry, which indicates the same correlation between all pairs of measurements, as in the sphericity char-
15.4. ANALYZING THE VIDEO GAME EXAMPLE
361
acteristic of chapter 14. This is a natural way to represent the relationship between students within a classroom. If the true correlation structure is compound symmetry, then using a random intercept for each upper level unit will remove the correlation among lower level units. Another commonly used structure is autoregressive, in which measurements are ordered, and adjacent measurements are more highly correlated than distant measurements. To summarize, in each problem the hierarchy is usually fairly obvious, but the user must think about and specify which fixed effects (explanatory variables, including transformations and interactions) affect the average responses for all subjects. Then the user must specify which of the fixed effect coefficients are sufficient without a corresponding random effect as opposed to those fixed coefficients which only represent an average around which individual units vary randomly. In addition, correlations among measurements that are not fully accounted for by the random intercepts and slopes may be specified. And finally, if there are multiple random effects the correlation of these various effects may need to be specified.
To run a mixed model, the user must make many choices including the nature of the hierarchy, the fixed effects and the random effects.
In almost all situations several related models are considered and some form of model selection must be used to choose among related models. The interpretation of the statistical output of a mixed model requires an understanding of how to explain the relationships among the fixed and random effects in terms of the levels of the hierarchy.
15.4
Analyzing the video game example
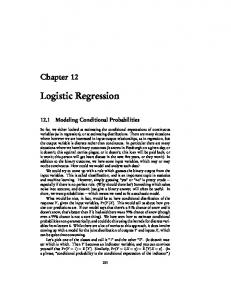
Based on figure 15.1 we should model separate linear relationships between trial number and game score for each age group. Figure 15.2, shows smoothed lines for each subject. From this figure, it looks like we need a separate slope and intercept for each age group. It is also fairly clear that in each group there is random subjectto-subject variation in the intercepts. We should also consider the possibilities that the “learning trajectory” is curved rather than linear, perhaps using the square of the trial number as an additional covariate to create a quadratic curve. We should
362
CHAPTER 15. MIXED MODELS
Figure 15.2: EDA for video game example with smoothed lines for each subject.
15.5. SETTING UP A MODEL IN SPSS
363
also check if a random slope is needed. It is also prudent to check if the random intercept is really needed. In addition, we should check if an autoregressive model is needed.
15.5
Setting up a model in SPSS
The mixed models section of SPSS, accessible from the menu item “Analyze / Mixed Models / Linear”, has an initial dialog box (“Specify Subjects and Repeated”), a main dialog box, and the usual subsidiary dialog boxes activated by clicking buttons in the main dialog box. In the initial dialog box (figure 15.3) you will always specify the upper level of the hierarchy by moving the identifier for that level into the “subjects” box. For our video game example this is the subject “id” column. For a classroom example in which we study many students in each classroom, this would be the classroom identifier.
Figure 15.3: Specify Subjects and Repeated Dialog Box.
364
CHAPTER 15. MIXED MODELS
If we want to model the correlation of the repeated measurements for each subject (other than the correlation induced by random intercepts), then we need to specify the order of the measurements within a subject in the bottom (“repeated”) box. For the video game example, the trial number could be appropriate.
Figure 15.4: Main Linear Mixed Effects Dialog Box. The main “Linear Mixed Models” dialog box is shown in figure 15.4. (Note that just like in regression analysis use of transformation of the outcome or a quantitative explanatory variable, i.e., a covariate, will allow fitting of curves.) As usual, you must put a quantitative outcome variable in the “Dependent Variable” box. In the “Factor(s)” box you put any categorical explanatory variables (but not the subject variable itself). In the “Covariate(s)” box you put any quantitative explanatory variables. Important note: For mixed models, specifying factors and covariates on the main screen does not indicate that they will be used in the model, only that they are available for use in a model. The next step is to specify the fixed effects components of the model, using
15.5. SETTING UP A MODEL IN SPSS
365
the Fixed button which brings up the “Fixed Effects” dialog box, as shown in figure 15.5. Here you will specify the structural model for the “typical” subject, which is just like what we did in ANCOVA models. Each explanatory variable or interaction that you specify will have a corresponding parameter estimated, and that estimate will represent the relationship between that explanatory variable and the outcome if there is no corresponding random effect, and it will represent the mean relationship if there is a corresponding random effect.
Figure 15.5: Fixed Effects Dialog Box. For the video example, I specified main effects for age group and trial plus their interaction. (You will always want to include the main effects for any interaction you specify.) Just like in ANCOVA, this model allows a different intercept and slope for each age group. The fixed intercept (included unless the “Include intercept” check box is unchecked) represents the (mean) intercept for the baseline age group, and the k − 1 coefficients for the age group factor (with k = 3 levels) represent differences in (mean) intercept for the other age groups. The trial co-
366
CHAPTER 15. MIXED MODELS
efficient represents the (mean) slope for the baseline group, while the interaction coefficients represent the differences in (mean) slope for the other groups relative to the baseline group. (As in other “model” dialog boxes, the actual model depends only on what is in the “Model box”, not how you got it there.) In the “Random Effects” dialog box (figure 15.6), you will specify which parameters of the fixed effects model are only means around which individual subjects vary randomly, which we think of as having their own personal values. Mathematically these personal values, e.g., a personal intercept for a given subject, are equal to the fixed effect plus a random deviation from that fixed effect, which is zero on average, but which has a magnitude that is controlled by the size of the random effect, which is a variance.
Figure 15.6: Random Effects Dialog Box.
15.5. SETTING UP A MODEL IN SPSS
367
In the random effects dialog box, you will usually want to check “Include Intercept”, to allow a separate intercept (or subject mean if no covariate is used) for each subject (or each level of some other upper level variable). If you specify any random effects, then you must indicate that there is a separate “personal” value of, say, the intercept, for each subject by placing the subject identifier in the “Combinations” box. (This step is very easy to forget, so get in the habit of doing this every time.) To model a random slope, move the covariate that defines that slope into the “Model” box. In this example, moving trial into the Model box could be used to model a random slope for the score by trial relationship. It does not make sense to include a random effect for any variable unless there is also a fixed effect for that variable, because the fixed effect represents the average value around which the random effect varies. If you have more than one random effect, e.g., a random intercept and a random slope, then you need to specify any correlation between these using the “Covariance Type” drop-down box. For a single random effect, use “identity”. Otherwise, “unstructured” is usually most appropriate because it allows correlation among the random effects (see next paragraph). Another choice is “diagonal” which assumes no correlation between the random effects. What does it mean for two random effects to be correlated? I will illustrate this with the example of a random intercept and a random slope for the trial vs. game score relationship. In this example, there are different intercepts and slopes for each age group, so we need to focus on any one age group for this discussion. The fixed effects define a mean intercept and mean slope for that age group, and of course this defines a mean fitted regression line for the group. The idea of a random intercept and a random slope indicate that any given subject will “wiggle” a bit around this mean regression line both up or down (random intercept) and clockwise or counterclockwise (random slope). The variances (and therefore standard deviations) of the random effects determine the sizes of typical deviations from the mean intercept and slope. But in many situations like this video game example subjects with a higher than average intercept tend to have a lower than average slope, so there is a negative correlation between the random intercept effect and the random slope effect. We can look at it like this: the next subject is represented by a random draw of an intercept deviation and a slope deviation from a distribution with mean zero for both, but with a negative correlation between these two random deviations. Then the personal intercept and slope are constructed by adding these random deviations to the fixed effect coefficients.
368
CHAPTER 15. MIXED MODELS
Some other buttons in the main mixed models dialog box are useful. I recommend that you always click the Statistics button, then check both “Parameter estimates” and “Tests for covariance parameters”. The parameter estimates are needed for interpretation of the results, similar to what we did for ANCOVA (see chapter 10). The tests for covariance parameters aid in determining which random effects are needed in a given situation. The “EM Means” button allows generation of “expected marginal means” which average over all subjects and other treatment variables. In the current video game example, marginal means for the three video groups is not very useful because this averages over the trials and the score varies dramatically over the trials. Also, in the face of an interaction between age group and trial number, averages for each level of age group are really meaningless. As you can see there are many choices to be made when creating a mixed model. In fact there are many more choices possible than described here. This flexibility makes mixed models an important general purpose tool for statistical analysis, but suggests that it should be used with caution by inexperienced analysts.
Specifying a mixed model requires many steps, each of which requires an informed choice. This is both a weakness and a strength of mixed model analysis.
15.6
Interpreting the results for the video game example
Here is some of the SPSS output for the video game example. We start with the model for a linear relationship between trial and score with separate intercepts and slopes for each age group, and including a random per-subject intercept. Table 15.1 is called “Model Dimension”. Focus on the “number of parameters” column. The total is a measure of overall complexity of the model and plays a role in model selection (see next section). For quantitative explanatory variables, there is only one parameter. For categorical variables, this column tells how many parameters are being estimated in the model. The “number of levels” column tells how many lines are devoted to an explanatory variable in the Fixed Effects table (see below), but lines beyond the number of estimated parameters are essentially blank (with
15.6. INTERPRETING THE RESULTS FOR THE VIDEO GAME EXAMPLE369
Fixed Effects
Random Effects Residual Total
Intercept agegrp trial agegrp * trial Intercept
Number of Levels 1 3 1 3 1 9
Covariance Structure
Identity
Number of Parameters 1 2 1 2 1 1 8
Subject Variables
id
Table 15.1: Model dimension for the video game example.
parameters labeled as redundant and a period in the rest of the columns). We can see that we have a single random effect, which is an intercept for each level of id (each subject). The Model Dimension table is a good quick check that the computer is fitting the model that you intended to fit. The next table in the output is labeled “Information Criteria” and contains many different measures of how well the model fits the data. I recommend that you only pay attention to the last one, “Schwartz’s Bayesian Criterion (BIC)”, also called Bayesian Information Criterion. In this model, the value is 718.4. See the section on model comparison for more about information criteria. Next comes the Fixed Effects tables (tables 15.2 and 15.3). The tests of fixed effects has an ANOVA-style test for each fixed effect in the model. This is nice because it gives a single overall test of the usefulness of a given explanatory variable, without focusing on individual levels. Generally, you will want to remove explanatory variables that do not have a significant fixed effect in this table, and then rerun the mixed effect analysis with the simpler model. In this example, all effects are significant (less than the standard alpha of 0.05). Note that I converted the SPSS p-values from 0.000 to the correct form. The Estimates of Fixed Effects table does not appear by default; it is produced by choosing “parameter estimates” under Statistics. We can see that age group 4050 is the “baseline” (because SPSS chooses the last category). Therefore the (fixed) intercept value of 14.02 represents the mean game score (in thousands of points) for 40 to 50 year olds for trial zero. Because trials start at one, the intercepts are not meaningful in themselves for this problem, although they are needed for calculating and drawing the best fit lines for each age group.
370
CHAPTER 15. MIXED MODELS
Source Intercept agegrp trial agegrp * trial
Numerator df 1 2 1 2
Denominator df 57.8 80.1 118.9 118.9
F 266.0 10.8 1767.0 70.8
Sig.