to any news about supply problems, thus adding to price volatility. External shocks and ...... magnifying it (Kaminsky, Reinhart and Végh, 2004; Ocampo and Vos, 2008). ...... not just with respect to the financial sector, but also regarding auditing and .... Such a market solution is problematic, however, as it would likely not be.
Chapter II Dealing with Macroeconomic Insecurity Rob Vos, Diana Alarcón and Mariangela Parra-Lancourt
The stop-go cycle associated with periodic balance-of-payments crises was a major constraint on long-term growth in many developing countries during the 1960s and 1970s. A radical change in policy advice in the late 1970s should have put an end to that cycle, by switching to a market-driven outwardoriented development strategy. This promised a return to macroeconomic stability along with a stronger, more inclusive and more secure economic growth path by removing State-induced distortions and unleashing the forces of global competition. In recent years, there has been a clear improvement in the macroeconomic performance of most countries in terms of lower volatility of key variables and a moderation in price inflation. However, this has not led to the expected economic dynamism, nor has it had the expected impact in reducing the vulnerability of people to downside economic risks, whether income declines or employment losses. Major regions of the world are still highly vulnerable to external shocks and in most countries, greater economic stability, narrowly defined, appears to have occurred at the cost of weaker growth of gross domestic product (GDP) and lower investment rates, at least when the situation is compared with that of the 1960s and 1970s. In the absence of effective countervailing measures, both national and multilateral, increasing instability in commodity prices and capital flows has, in particular, forced Governments to build excess international reserves at a further cost in terms of forgone investment and consumption. Thus, while the new policy regime has upended the old cycle, it has not replaced it with a vigorous alternative. The present chapter will examine the way changes in the business cycle in both developed and developing countries have impacted on economic insecurity.
14 • Rob Vos, Diana Alarcón and Mariangela Parra-Lancourt
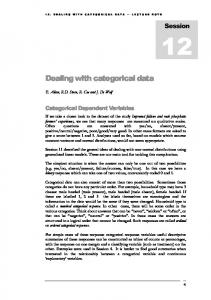
Growth and Insecurity By many macroeconomic measures, we seem to be living in an economically more secure world. Macroeconomic volatility has decreased worldwide over the past decades as compared with the 1970s and 1980s. Fluctuations in output growth and inflation rates have fallen across all regions (see table II.1), though volatility remains much higher in developing than in developed countries. The standard deviation of output growth fell to less than 1 per cent in the developed countries during the present decade, compared with more than 2 per cent during the 1970s. In developing countries, the fluctuation around the average economic growth rate has come down to 2.4 percentage points, less than half the degree of volatility in the 1970s or 1980s. Output volatility is generally lower in developing Asia than in other parts of the developing world. Inflation rates have fallen worldwide and with them, also aggregate price volatility. In Latin America and the Caribbean, average inflation volatility dropped significantly in the 1990s and further in the present decade, in a clear break with the hyperinflation episodes of the 1980s. In other developing-country regions, gains in terms of greater price stability are more recent. In Africa, output volatility declined sharply in the early 1990s and this has persisted even with the acceleration of growth in the present decade. However, both private consumption and investment growth are more volatile than elsewhere, and volatility in private consumption growth remains as high in Africa as in preceding decades, suggesting that lower aggregate output volatility is not translating into greater economic security for households. Table II.1 also shows that, while investment growth has fallen somewhat in most regions, it remains highly volatile in all developing-country regions. During the present decade, there has been a significant fall in investment volatility in East and South Asia, but much of it is explained by the fast economic growth context in China and India. In other developing-country regions, investment volatility has remained high (see figure II.1). The continued high investment volatility in developing countries results from a combination of factors. The frequency and depth of economic recessions have remained high since the 1970s (see table II.2). While their intensity seems to have tapered off somewhat during the present decade, this remains a major source of business uncertainty, holding off long term productive investment. Accelerated trade and capital market opening during the 1990s have been related sources of volatility and investment uncertainty. This has been reinforced by the mostly pro-cyclical macroeconomic policy stance in many countries in response to downturns and recessions. As discussed further
Dealing with Macroeconomic Insecurity • 15 Table II.1 Macroeconomic volatility, developed economies and selected regions, 1971-2006 Standard deviation as percentage 1971-1980
1981-1990
1991-2000
2001-2006
2.43 5.99 7.17 9.20
1.88 5.42 5.60 6.09
1.55 4.44 4.93 2.39
0.98 3.44 5.59 2.00
Latin America and the Caribbean GDP growth Gross fixed capital formation Private consumption Inflationb
3.30 11.26 6.19 63.31
4.60 13.26 5.16 310.26
3.38 11.79 5.64 23.36
3.11 9.83 3.36 7.61
Africa GDP growth Gross fixed capital formation Private consumption Inflationc
5.17 17.34 7.46 12.97
4.74 16.52 9.53 16.01
3.24 14.34 7.98 103.87
2.22 12.53 8.75 13.73
East and South Asia GDP growth Gross fixed capital formation Private consumption Inflationd
4.62 11.33 4.91 9.92
3.42 9.26 3.94 8.98
3.05 10.96 3.70 9.36
1.63 6.00 1.56 5.39
Western Asia GDP growth Gross fixed capital formation Private consumption Inflatione
8.23 25.27 16.79 19.23
6.54 13.82 10.08 33.79
5.00 12.87 6.56 33.58
4.57 16.44 10.34 10.85
Developed economies GDP growth Gross fixed capital formation Private consumption Inflationa
Sources: UN/DESA, based on United Nations Statistics Division, National Accounts Main Aggregates database; inflation estimates based on World Bank World Development Indicators Online database, available at http://ddp-ext.worldbank.org/ext/DDPQQ/member.do?method=getMembers;
Series Code is FP.CPI.TOTL.ZG, (accessed 8 May 2008). Note: Volatility of GDP growth, investment and consumption is measured by the standard deviation of these variables at constant prices of 2000. Regional averages are weighted by the relative share of countries’ GDP at the beginning of the period. Inflation is defined as the weighted average change of annual consumer prices. It was calculated for the subset of countries with available data.
a Inflation figures for developed countries do not include economies in transition. b Inflation rates for 16 Latin American countries and Barbados which represent about 55 per cent of regional GDP. c Inflation rates for 28 African countries which represent almost 90 per cent of regional GDP. d Inflation rates for East and South Asia include 10 countries that represent about 60 per cent of regional GDP. e Inflation rates for Western Asia include 7 countries that represent almost 90 per cent of regional GDP.
16 • Rob Vos, Diana Alarcón and Mariangela Parra-Lancourt Figure II.1 Investment volatility and GDP growth, 1971-2000 8 7
Investment Volatility
6 5 4 3 2 1 0 -4
-2
0
2
4 6 8 Average growth of GDP
10
12
14
Source: UN/DESA based on United Nations Statistics Division, National Accounts Main Aggregates database. Notes: At constant prices of 2000 for the period 1971-2006. Coefficient of variation (CV) of the annual growth rate of gross capital formation at 2000 prices in 1971-2006. The coefficient of variation is defined as the standard deviation divided by the mean for the period.
below, the emerging phenomenon described as “financialization” possibly has also tilted incentives against productive investment and job creation and has presented itself as a new source of economic insecurity. Reduced macroeconomic volatility has, by and large, come at the cost of lower average growth rates. In developed countries, growth of GDP per capita has been on a declining trend since the 1970s (see figure II.2a). For developing countries, trend growth has been up since the 1990s, but this is largely explained by fast growth in China and India. When these are left out, the trend level of per capita output growth over the past three decades (as well as during the recovery in the current decade) is well below that of the 1970s (figures II.2b and II.2c). The correlation of this pattern with macroeconomic volatility is shown in figures II.3a and II.3b. The graphs compare the pattern of growth and volatility for individual countries in the period 2001-2006 in relation to the 1970s. Countries that grew faster in the 2000s compared with the 1970s are to the right of the vertical line. Countries with lower volatility, as measured by the coefficient of variation of per capita GDP growth, are below the
85
2.24
2.26 1.44 1.29 1.65 1.63 1.68 -4.39
-2.74 -3.76 -3.07 -4.72 -7.29 -3.83
-4.18
-2.52
AGS
75
50 13 10 3 30 41
134
44
NR
2.74
2.52 2.02 2.02 2.00 2.35 2.34
2.36
1.38
ALY
1981-1990
-4.13
-4.37 -3.90 -3.82 -4.18 -8.00 -4.00
-4.89
-1.90
AGS
70
40 19 14 5 28 34
121
66
NR
2.47
1.48 1.95 2.10 1.44 1.48 2.09
1.72
2.44
ALY
1991-2000
-4.75
-2.79 -4.83 -5.77 -1.70 -4.84 -3.45
-3.77
-8.78
AGS
33
19 8 7 1 10 10
47
17
NR
1.59
1.25 1.25 1.29 1.00 1.83 2.06
1.54
1.46
ALY
2001-2006
-3.37
-2.57 -1.75 -1.72 -1.93 -4.36 -2.31
-2.75
-1.36
AGS
Source: UN/DESA, based on United Nations Statistics Division, National Accounts Main Aggregates database. Note: A recession refers to episodes of negative growth. Average length is the average number of years of negative GDP growth. Average shortfall is the average decrease in GDP growth during a recession. Legend: NR – Number of recessions; ALY – Average length in years; AGS – Average GDP shortfall. a Including countries belonging to the European Union (EU), non-EU and Commonwealth of Independent States (CIS), and economies in transition.
Least developed countries
Latin America and the Caribbean South and East Asia East Asia South Asia Western Asia Africa
27 22 12 10 30 43
122
Developing economies 1.79
1.22
44
Developed economies
ALY
NR
a
1971-1980
Table II.2 Incidence of recessions, selected country groups and regions, 1971-2006
Dealing with Macroeconomic Insecurity • 17
18 • Rob Vos, Diana Alarcón and Mariangela Parra-Lancourt Figure II.2a Growth of GDP per capita, developed countries, 1971-2006 6
Percentage
5
HP-filtered growth
4 3 2 Observed growth
1
-1
1971 1972 1973 1974 1975 1976 1977 1978 1979 1980 1981 1982 1983 1984 1985 1986 1987 1988 1989 1990 1991 1992 1993 1994 1995 1996 1997 1998 1999 2000 2001 2002 2003 2004 2005 2006
0
Year
Figure II.2b Growth of GDP per capita, developed countries, 1971-2006 6
Percentage
5 4
HP-filtered growth
3 2 1
Observed growth
-1
1971 1972 1973 1974 1975 1976 1977 1978 1979 1980 1981 1982 1983 1984 1985 1986 1987 1988 1989 1990 1991 1992 1993 1994 1995 1996 1997 1998 1999 2000 2001 2002 2003 2004 2005 2006
0
Year
Figure II.2c Growth of GDP per capita, developing countries, excluding China and India, 1971-2006
-2 -3
Percentage
HP-filtered growth
Observed growth
1971 1972 1973 1974 1975 1976 1977 1978 1979 1980 1981 1982 1983 1984 1985 1986 1987 1988 1989 1990 1991 1992 1993 1994 1995 1996 1997 1998 1999 2000 2001 2002 2003 2004 2005 2006
6 5 4 3 2 1 0 -1
Year
Source: UN/DESA, based on United Nations Statistics Division, National Accounts Main Aggregates database. Note: The red line is a smooth trend on the rate of growth of GDP per capita calculated with a Hodrick-Prescott Filter (HP). It removes short-term fluctuations from longer- term trends. Following the literature, the long-term trend in the figure was calculated with a lag of 1 and l = 100, as suggested for yearly data.
Dealing with Macroeconomic Insecurity • 19 Figure II.3a Growth of GDP per capita and volatility, 2001-2006, �compared with 1971-1980, selected regions
2.00
Volatility ratio
1.50
1.00
0.50
0.00
1.00 Ratio of GDP per capita growth
Figure II.3b Growth of GDP per capita and volatility, 2001-2006, �compared with 1971-1980, selected regions, excluding Africa
2.00
Volatility ratio
1.50
1.00
0.50
0.00
1.00 Ratio of GDP per capita growth
Africa Latin America
East and South Asia Non-EU
Europe Western Asia
Source: UN/DESA, based on United Nations Statistics Division, National Accounts Main Aggregates database. Note: The measure of volatility is the coefficient of variation of GDP per capita growth. The four quadrants are built around the ratio of average GDP per capita growth for 2001-2006 with respect to the 1970s and the ratio of the measure of volatility for the same periods.
20 • Rob Vos, Diana Alarcón and Mariangela Parra-Lancourt horizontal line. Most countries in the world were able to reduce volatility at the cost of lower growth rates, excluding sub-Saharan Africa. The strong recent growth performance of most countries in sub-Saharan Africa comes after two decades of low (or negative) growth and high volatility and has been buoyed by rising commodity prices and recovery from civil strife and conflict. Other countries that did better in 2001-2006 compared with the 1970s are concentrated in East and South Asia. A few Latin American countries (like Argentina, Chile, Jamaica and Costa Rica) also did better, in part because of crises suffered during the 1970s. In the vast majority of developed and developing countries in Europe, Western Asia, most of Latin America and the Caribbean, and parts of East and South Asia, greater stability has been achieved at the cost of lower rates of growth. A predictable macroeconomic environment is an essential element of a strong investment climate. A volatile business climate can increase uncertainty, making investors reluctant to expand capacity, which in turn can slow productivity growth, increasing the potential for further uncertainty. In the absence of automatic stabilizers and because of the heavier reliance of investment on external financing and imported capital goods, the business cycle is expected to be more volatile in developing than in developed countries. This can make it all the more difficult to establish a long-term development path in some countries, given that the minimum scale of investment required to launch and sustain an industrialization drive has been steadily rising (United Nations Conference on Trade and Development, 2003; United Nations, 2006). Lower growth performance of the past decade may further be explained by the strong deceleration of growth in public consumption and public investment in a majority of countries. Governments in many developing countries have cut back public spending as part of orthodox stabilization programmes and as pro-cyclical responses to economic downturns and external shocks. Especially during the 1980s and 1990s, fiscal austerity forced many Governments to sacrifice important infrastructure investment projects as well as social programmes in order to meet these goals. This trend was especially noticeable in Latin America and sub-Saharan Africa (United Nations, 2006). Slow growth of productive investment in recent decades is perhaps the clearest indication of the failure of the predominant approach to macroeconomic policies to stimulate creative innovation and growth. The narrow approach to macroeconomic policymaking based on low-inflation targeting and fiscal balance failed to sustain higher growth rates because it did not pay enough attention to the factors that determine capital formation,
Dealing with Macroeconomic Insecurity • 21 productivity and the full and efficient utilization of productive capacity.1 The damaging consequences of this approach have been revealed most recently by the problem of growing food insecurity.
The macroeconomics of food insecurity According to the Food and Agriculture Organization of the United Nations (FAO), “food security exists when all people, at all times, have access to sufficient, safe and nutritious food to meet their dietary needs and food preferences for an active and healthy life”. In early 2008, there were 37 countries requiring immediate food assistance, of which one third were in sub-Saharan Africa and most of the others in Asia (Food and Agriculture Organization of the United Nations, 2008). Strongly rising world food prices made it more difficult to provide emergency food aid and to buy food on the world market, increasing the sense that food security is under threat. This is on top of the chronic malnutrition from which close to 1 billion people are estimated to suffer. According to one estimate, another 126 million people may have fallen below the $1 per day poverty line because of the rise in food prices since 2006 (see table II.3). Other things being equal, in sub-Saharan Africa, the incidence of extreme poverty may have risen by almost 8 percentage points, implying that the recent food price increases have more than wiped out the poverty reduction achieved in the region between 1990 and 2004. Much of the recent surge in food prices is related to a series of compounding short- and long-term factors which have combined to create this unprecedented situation. After a slump during the first half of the 1980s in the developing countries, agricultural investment recovered somewhat, but did not return to the levels seen in the 1970s (Food and Agriculture Organization of the United Nations, 1999). In addition, growth rates of yields for major cereals (wheat, maize and rice) have slowed since 1960 in the developing countries (World Bank, 2007). Although the average yield for coarse grains increased from 1.4 millions to 3.2 millions of tons per hectare from the 1960s to the present, productivity growth decelerated from 2.6 per cent per year in the 1960s to 1.6 per cent per annum over the past decade. A series of structural and macroeconomic factors are now exposing these long-term shortcomings. First, the persistent weak dollar has increased the international trading prices of all food products, along with those of other commodities. Although changes in global food prices are not as readily transmitted to the consumer, studies have shown that these are significant,
8.7 36.9
6.0 19.0 20.3
9.6 31.2
5.0 5.0
Base (2004)
23.1
9.6 44.6
10.8 34.7
Food price simulation
2.8
0.9 7.8
1.2 3.5
Increase poverty incidence
Poverty incidence (%) ($1 PPP per day poverty line)
927.7
47.2 207.8
183.8 479.6
Base
1,053.5
52.2 251.5
207.5 532.6
Food price simulation
Number of poor (millions)
25.8
5.0 43.7
23.8 53.0
Increase in Poor
4,562.6
544.0 563.3
1,918.2 1,537.1
Total population covered in simulation (millions)
Source: United Nations Department of Economic and Social Affairs (UN/DESA) based on household survey data using the Povcal Net database of the World Bank. See Vos (2008) for estimation methodology.
Total
East Asia South Asia Latin America and the Caribbean Sub-Saharan Africa
Simulated pass-through to consumer food prices of 69% increase in world agricultural food prices, January 2006-
Table II.3 Impact on global poverty of surge in agricultural commodity prices
22 • Rob Vos, Diana Alarcón and Mariangela Parra-Lancourt
Dealing with Macroeconomic Insecurity • 23 especially in developing countries. At least half of the basket of consumer goods in developing countries consists of food products; hence, increases in the global food prices have a significant effect on inflation. This has ended the downward trend of inflation and has added another element of economic insecurity to the present conjuncture. Second, the high economic growth of some large developing countries and an accelerated pace of urbanization have shifted consumption patterns towards higher-value food products, such as meat. This has increased the demand for animal feed, including grains, which are also the main ingredients for staple food. Third, the sharp increase in the price of oil has increased the cost of transportation of food commodities and the production costs of fertilizers. Fourth, concerns about energy security have increased the demand for biofuels, which has required greater production of corn and sugar cane. Estimates suggest that, in 2006 and 2007, almost half the increase in the demand for major food crops in the United States was for corn-based ethanol production (International Monetary Fund, 2008), while almost all of the increase in global maize production between 2004 and 2007 was used for biofuel production in the United States (World Bank, 2008a). Financial speculation has also played a role in the recent surge in food prices. Prices in the futures market of wheat and grains have risen recently and are much higher than in the spot or cash market; and since 2006, there has been no convergence between these two sets of prices, as would have been expected. Traders seem to expect shortages in these markets; but since the futures price has been higher than the cash price on the delivery date, hedgers buy at the cash price, store the produce and sell a futures contract in order to make a profit. This phenomenon has not only added a premium on the traded commodity but also increased volatility in the market. It has furthermore created uncertainty for producers who rely on these instruments to ensure an adequate price for long-term investment and production planning. Additional uncertainty originates from the increased demand which has driven inventories to record lows, especially for cereals. This makes the world price more sensitive to any news about supply problems, thus adding to price volatility.
External shocks and volatility Few dispute that increased international trade and capital mobility can be a means of achieving greater national wealth. However, they can also be a source of insecurity. Policymakers in advanced countries have long recognized this dual face of increased trade and have debated what to do about it, especially in terms of compensating the losers. Trade shocks are an even bigger challenge
24 • Rob Vos, Diana Alarcón and Mariangela Parra-Lancourt in countries reliant on more traditional export sectors. Most developing countries are producers and exporters of primary products or commodities and their economic activity heavily relies on these sectors. The recent increase in commodity prices associated with the strong demand from China and India has helped exporting countries, mainly in Africa and Latin America, to improve growth. High volatility of commodity prices, however, continues to be a source of instability. Managing commodity booms proved particularly difficult in the past; and downturns, particularly when these have been sharp, have left a significantly damaged economy which has been difficult to turn around. Moreover, the recent surge in fuel and food prices is putting pressure on inflation and may lead to a rapid deterioration of income among households, reversing much of the gains made by countries in the area of poverty reduction. The lack of control over these variables, especially by smaller economies that cannot influence the external environment, has created greater and harder-to-manage economic insecurity. At the same time, the weight and influence of financial markets, financial actors and financial institutions have grown dramatically in recent decades (see below). This could have provided a stimulus to growth, but the volatile and pro-cyclical nature of capital flows has at the same time turned the financial growth into a source of economic insecurity. Their effects are often transmitted by way of public sector accounts, especially through the effects of available financing on government spending and of interest rates on the public debt service. However, the stronger effects typically run through private spending and balance sheets. The shift towards export-led strategies in the developing world has actually accentuated this pattern in many countries. The growing influence of financial calculation has increased commodity price volatility, the impact of which on the business cycle is further amplified by pro-cyclical policies, among others, by expanding fiscal expenditures during the boom and reducing spending when prices are down. The latter is reinforced by the conditionality linked to international financial assistance during crises, which involves orthodox macroeconomic stabilization policy packages. These financial dynamics have far-reaching implications for the real economy. Episodes of exceptionally rapid economic expansion driven by financial bubbles can bring periods of growing prosperity, but they can end very suddenly, leading to deep recessions or even longer periods of stagnation. Vulnerability to a sharp reversal of flows varies, but in many emerging markets, it is often triggered by factors beyond the control of recipient countries, including shifts in monetary and financial policies in the major industrialized countries.
Dealing with Macroeconomic Insecurity • 25
Trade and current-account shocks Trade volumes and terms-of-trade fluctuations have historically played a major role in the business cycles in developing countries, particularly in commodity-dependent economies. This still may well be the case and with the widespread shift towards export-led strategies in the developing world, this role has likely been accentuated. A decomposition analysis of current-account shocks and domestic adjustment gives an idea of the changing nature and intensity of external shocks across countries over the past few decades.2 Trade shocks (in terms of both prices and volumes) still pretty much dominate current-account adjustment and became more predominant again after much of the external debt overhang of developing countries, accumulated with commercial banks, had been restructured in the late 1980s, in particular in Latin America. The vulnerability to trade shocks is closely associated with the nature and degree of export diversification. Despite the greater emphasis on export-led growth strategies, the size of terms-of-trade shocks relative to the gross national product (GNP) of developing countries has been reduced, on average, in comparison with those witnessed during the 1980s (see tables II.4 and II.5).3 Primary commodity exporters, most of which are concentrated in sub-Saharan Africa and Latin America, had seen strongly adverse terms-of-trade shocks during the 1980s, especially because of a collapse in export prices. Commodity price volatility remained high during the 1990s (see UN 2008, figure A.9) but—again on average—terms-of-trade shocks were positive for commodity-exporting regions, especially during the present decade. In contrast, net commodity importers, especially in Asia, have suffered adverse terms-of-trade effects because of the recent surge in commodity prices. Most least developed countries, on the other hand, especially those in Africa, have suffered continued adverse terms-of-trade effects throughout the 1980s, the 1990s and the present decade. Global trade has grown consistently faster than output since 1945 and significantly so for the last 25 years. Over this same period, the share of developing countries has risen steadily, including in the export of manufactures. A more outward-oriented growth strategy can make for a more stable growth path, particularly where the domestic market is small. However, greater reliance on export markets may increase the vulnerability of countries to sudden changes in the volume of exports or the terms of trade when they are not able to diversify their structure of production and exports. The decomposition analysis shows that the expansion of world trade has significantly helped reduce the currentaccount deficits of countries in sub-Saharan Africa (since the mid-1980s) and
Table II.4 Decomposition analysis of the current account of the balance of payments, Asia, East Asia, Latin America and the Caribbean and sub-Saharan Africa, 1981-2005 Percentage of GNP From: 1981-1985 1986-1990 1991-1995 1996-2000 To: 1986-1990 1991-1995 1996-2000 2001-2005 Asia Observed deficit increase -0.95 0.45 -2.22 -0.93 External shocks -1.13 -0.11 -2.28 0.60 Terms-of-trade deterioration -1.96 -0.92 -0.38 2.25 Import price effect 2.23 -0.74 0.43 0.19 Export price effect -4.19 -0.18 -0.81 2.06 Interest-rate shock -0.29 -0.18 -0.17 -0.40 World trade retardation 1.12 0.99 -1.73 -1.26 Other external variables 1.05 0.43 0.36 -0.13 Debt accumulation burden 0.60 0.14 0.27 0.08 Change in direct investment income 0.16 0.26 0.32 -0.04 Change in remittances 0.28 0.04 -0.22 -0.14 Change in official transfers 0.02 -0.01 -0.01 -0.04 Domestic adjustment -1.66 -0.18 -0.04 -3.30 Domestic spending -0.72 0.63 -1.12 -0.99 Consumption contraction -0.54 -0.41 -0.76 -0.55 Private consumption -0.40 -0.43 -0.62 -0.61 Public consumption -0.14 0.02 -0.15 0.06 Investment reduction -0.18 1.04 -0.36 -0.44 Trade ratios -0.95 -0.81 1.08 -2.31 Import replacement 1.63 4.38 3.57 7.52 Export penetration -2.57 -5.19 -2.49 -9.83 Interaction effects 0.79 0.32 -0.26 1.91 -1.14 -1.82 -3.34 4.15 -7.49 -0.37 1.89 0.89 0.72 0.11 0.08 -0.01 -1.63 -1.04 -0.74 -0.47 -0.28 -0.30 -0.59 2.41 -3.00 1.42
1981-1985 1986-1990
1986-1990 1991-1995 1991-1995 1996-2000 East Asia 0.51 -3.41 -0.02 -2.43 -2.30 -1.28 -1.83 0.95 -0.46 -2.22 -0.25 -0.17 2.52 -0.99 0.41 0.98 0.10 0.37 0.28 0.65 0.04 -0.02 -0.01 -0.02 -0.68 -1.52 1.23 -1.65 -0.38 -1.05 -0.48 -0.81 0.11 -0.24 1.61 -0.60 -1.91 0.13 5.07 3.25 -6.98 -3.12 0.81 -0.43 -1.06 2.44 3.05 0.47 2.58 -0.33 -0.29 -0.71 -0.24 -0.22 -0.18 -0.06 -6.27 -1.25 -0.64 -0.76 0.12 -0.61 -5.02 10.04 -15.07 3.49
1996-2000 2001-2005
26 • Rob Vos, Diana Alarcón and Mariangela Parra-Lancourt
1981-1985 1986-1990 1991-1995 1996-2000 1986-1990 1991-1995 1996-2000 2001-2005 Latin America and the Caribbean 0.51 2.42 -0.07 -3.77 3.60 -2.51 -5.30 -5.97 4.48 0.85 -0.53 -0.56 1.48 -2.12 -1.95 0.68 3.00 2.98 1.41 -1.24 0.41 -0.91 -0.18 -0.65 -1.30 -2.45 -4.59 -4.76 -0.88 3.28 0.49 1.30 -1.49 4.21 1.02 0.76 0.82 -0.63 -0.35 1.19 -0.18 -0.31 -0.20 -0.66 -0.03 0.01 0.01 -0.01 -1.04 6.12 5.41 2.55 -0.78 0.15 -0.06 0.01 -0.51 -0.03 -0.21 0.14 -0.50 0.17 -0.05 0.22 0.00 -0.20 -0.15 -0.08 -0.28 0.18 0.15 -0.13 -0.26 5.96 5.47 2.54 0.59 6.62 6.48 1.61 -0.85 -0.66 -1.01 0.93 -1.16 -4.47 -0.66 -1.66 -6.42 -0.55 3.78 4.08 -0.30 -1.10 -3.23 0.21 0.73 0.79 -1.44 0.13 -5.61 -2.62 -1.88 -0.52 -1.36 -0.73 -2.99 -3.47 0.48 -0.47
1981-1985 1986-1990
1986-1990 1991-1995 1991-1995 1996-2000 Sub-Saharan Africa 0.80 1.17 -13.25 -13.19 -0.54 -0.82 0.16 -0.23 -0.70 -0.60 -2.01 -0.21 -10.70 -12.15 1.26 -0.04 0.32 -0.06 0.90 -0.21 0.12 0.03 -0.08 0.21 9.75 10.76 3.70 -1.42 5.04 -1.63 5.51 -1.24 -0.47 -0.39 -1.33 0.22 6.05 12.17 -4.91 3.29 10.96 8.88 3.04 3.63 1.44 -9.23 -0.58 0.01 -0.59 -0.64 -8.01 -0.24 0.06 1.66 -2.04 0.08 10.22 0.20 -0.55 0.12 -0.66 0.75 10.01 6.22 3.80 0.69
1996-2000 2001-2005
Source: UN/DESA calculations, based on United Nations Statistics Division, World Bank Global Development Finance (GDF) and International Monetary Fund International Financial Statistics online databases. Note: See appendix, section A, for methodology. Regions are also defined in section A of the appendix. Regional averages are weighted by GNP. A positive (negative) sign refers to an increase (decrease) in the deficit and thus to an adverse (favourable) external shock.
Observed deficit increase External shocks Terms-of-trade deterioration Import price effect Export price effect Interest-rate shock World trade retardation Other external variables Debt accumulation burden Change in direct investment income Change in remittances Change in official transfers Domestic adjustment Domestic spending Consumption contraction Private consumption Public consumption Investment reduction Trade ratios Import replacement Export penetration Interaction effects
Table II.4 (cont’d) From: To:
Dealing with Macroeconomic Insecurity • 27
28 • Rob Vos, Diana Alarcón and Mariangela Parra-Lancourt Table II.5 Terms-of-trade shocks, selected regions, 1981-2005
Regionsa Latin America and the Caribbean South America
Central America, without Mexico Mexico
Caribbean
Asia
East Asia, without China South Asia, without India China
India
Western Asia
Terms-of-trade deterioration Import price effect Export price effect Terms-of-trade deterioration Import price effect Export price effect Terms-of-trade deterioration Import price effect Export price effect Terms-of-trade deterioration Import price effect Export price effect Terms-of-trade deterioration Import price effect Export price effect Terms-of-trade deterioration Import price effect Export price effect Terms-of-trade deterioration Import price effect Export price effect Terms-of-trade deterioration Import price effect Export price effect Terms-of-trade deterioration Import price effect Export price effect Terms-of-trade deterioration Import price effect Export price effect Terms-of-trade deterioration Import price effect Export price effect
19811985
19861990
19911995
19962000
19861990
19911995
19962000
20012005
4.48 1.48 3.00 3.43 0.75 2.68 -1.14 -0.70 -0.45 8.60 4.42 4.18 -0.83 -6.46 5.62 -1.96 2.23 -4.19 0.67 -0.28 0.96 0.35 0.38 -0.03 -4.53 5.47 -10.00 0.01 0.10 -0.10 -0.29 -1.40 1.11
0.85 -2.12 2.98 2.10 -0.96 3.06 -1.74 -0.95 -0.79 -2.15 -5.81 3.66 -1.07 -5.32 4.25 -0.92 -0.74 -0.18 -0.61 -3.60 2.98 0.47 0.13 0.34 -2.80 -1.31 -1.49 -0.01 -0.37 0.35 2.38 2.40 -0.03
-0.53 -1.95 1.41 -0.98 -2.07 1.09 -1.13 0.45 -1.58 0.92 -2.00 2.92 -2.55 2.15 -4.69 -0.38 0.43 -0.81 -1.70 4.91 -6.61 -0.89 0.58 -1.48 -1.16 -0.23 -0.92 0.49 -0.54 1.04 2.10 -0.38 2.48
-0.56 0.68 -1.24 -0.34 3.97 -4.30 1.58 -0.11 1.70 -1.55 -8.21 6.66 -0.51 3.13 -3.64 2.25 0.19 2.06 2.75 3.12 -0.37 3.37 2.29 1.08 3.14 -0.32 3.46 1.92 1.08 0.84 -0.80 -2.87 2.07
Dealing with Macroeconomic Insecurity • 29 Table II.5 (cont’d) 19811985
19861990
19911995
19962000
19861990
19911995
19962000
20012005
Terms-of-trade deterioration Import price effect Export price effect Terms-of-trade deterioration Import price effect Export price effect Terms-of-trade deterioration Import price effect Export price effect
3.14 3.35 -0.21 3.25 3.11 0.14 1.13 7.57 -6.44
-0.42 0.12 -0.53 -1.03 0.52 -1.55 10.42 -7.10 17.52
-0.67 -0.18 -0.49 -0.23 -0.44 0.21 -8.44 4.44 -12.88
-0.48 0.03 -0.51 -0.09 0.43 -0.52 -7.41 -7.01 -0.40
Terms-of-trade deterioration Import price effect Export price effect Terms-of-trade deterioration Import price effect Export price effect
0.28 0.11 0.18 4.77 4.92 -0.15
0.14 -0.05 0.19 4.20 8.68 -4.48
0.00 0.02 -0.01 1.68 0.23 1.45
-0.04 0.12 -0.15 1.66 2.43 -0.80
9.37 8.78 0.59
-8.40 -5.68 -2.72
-2.55 -2.13 -0.42
-1.86 -0.50 -1.37
Regionsa Africa
Africa, excluding Nigeria Nigeria
Northern Africa
Least developed countries in sub-Saharan Africa Other countries in Terms-of-trade deterioration sub-Saharan Import price effect Africab Export price effect
Source: Appendix table A.2. Note: A positive (negative) sign refers to an increase (decrease) in the deficit and thus to an adverse (favourable) external shock. a Regions as defined in section A of the appendix. b Excluding Nigeria.
Latin America (since the 1990s, although to a lesser extent) (see table II.3). Its effect in East Asia has not been as large, as shown by the small negative sign for world trade (indicating that world trade growth helped reduce the current-account deficit) since the 1990s. The main difference among these regions arises from the large effort that countries in East Asia (mainly China) have made to diversify their exporting sectors and improve their competitive position in world markets. Results presented in table II.4 show that most countries in Latin America and the Caribbean and Africa and the small island developing States have lost ground in international markets (Vos and Parra, 2008). This lack of export competitiveness (reflected by a positive sign for the export penetration effect) is most severe among the least developed countries (see UN 2008, table A.2). By contrast, the members of the group of Asian
30 • Rob Vos, Diana Alarcón and Mariangela Parra-Lancourt countries included in the analysis have been able to increase competitiveness and thus export penetration. Differences in the performance of these regions in world markets signal more fundamental differences in the capacity of countries to benefit from the expansion of trade. East Asian countries were very successful in achieving a rapid transformation of exporting sectors, away from primary products and resource-based and low-technology manufacturing towards more capitalintensive and high-technology goods. The share of the former type of goods in total exports of the region dropped from 76 per cent in 1980 to 35 per cent in 2005. In China, this share fell from 93 per cent in 1985 to 44 per cent in 2005. Other regions have been less successful in transforming their structure of production for exports. South and Central America still rely on primary products and simple manufactures (about 78 per cent of exports in 2005, though down from about 90 per cent in 1983). In Africa, the concentration of exports in low value added products is greater still (83 per cent in 2005) (see UN 2008, table A.3). The high positive import-replacement ratios (reflecting rising import dependence) across developing countries during the 1990s evidence the impact of trade liberalization, albeit with important regional differences. In East Asia, the rise in import demand has gone hand in hand with exportled industrialization strategies, reflecting higher demand for raw materials and industrial inputs, including through the establishment of international production networks (United Nations, 2006). On average, the rise in import dependence has been outweighed by the increase in export penetration and a shift towards rising trade surpluses. Elsewhere, in most parts of Latin America and Africa, rising import dependence has had little to do with economic diversification, and more with rising imports of consumer goods and/or growth of footloose low value added manufactures.4 The degree of diversification of countries and their insertion into world markets constitute an important factor explaining growth and economic instability. The steady diversification of economic activity has been identified as a common feature of a modern growth path and closely associated with industrial development (Imbs and Wacziarg, 2003). The diversification of exports towards higher value added products increases the resilience of countries to trade shocks and provides a stronger foundation for improving growth and stability over longer periods of time (Rodrik, 2007). Figure II.4a and 4b shows that greater reliance on primary exports is associated with higher output and investment volatility. This effect becomes even stronger with the lowering of the degree of export diversification.
Dealing with Macroeconomic Insecurity • 31
Natural log of per capita GDP growth standard deviation (1970-2006)
Figure II.4a Primary export dependence and volatility of GDP per capita 3.0
2.5
Rwanda
2.0
Saudi Arabia Romania
1.5
Chile Zimbabwe
Hong KongThailand China India
Brazil
CameroonVenezuela Uganda
Indonesia
1.0 Kenya
Italy Sweden
0.5
France
Netherlands
0.0 0
10
20 30 40 50 60 70 80 Primary commodities as a percentage of total exports (2000-2006)
90
100
Natural log of gross capital formation standard deviation (1970-2006)
Figure II.4b Primary export dependence and investment volatility 4.5 4.0 Nigeria 3.5
Norway Republic of Korea Mexico
3.0
Thailand
2.5 China
2.0
Japan
1.5 1.0
Tanzania Peru Indonesia
Colombia
Benin
Kuwait
Brazil India Denmark
United States United Kingdom France
0
10
20 30 40 50 60 70 80 Primary commodities as a percentage of total exports (2000-2006)
90
Source: UN/DESA calculations, based on United Nations Statistics Division National Accounts database and United Nations Commodity Trade database.
100
32 • Rob Vos, Diana Alarcón and Mariangela Parra-Lancourt In the context of increasing integration of the world economy, the gains from globalization depend on the ability of countries to develop dynamic competitive advantages based on innovation and productive diversification. This requires sustained investment flows to facilitate the introduction of new technology and the development of infrastructure and workers’ skills (United Nations, 2006). International competitiveness based on low wages gives countries an initial advantage in world markets and may be an appropriate employment-generation strategy for countries with a large share of unskilled labour. However, there are limits to the effectiveness of this strategy. Indeed, those limits may have tightened in recent years. In a study of 127 developed and developing countries, Dowrick and Golley (2004) found that, between 1960 and 1980, increased trade had helped accelerate productivity growth twice as much in poorer countries as in richer countries. That gain was reversed, however, in the period between 1980 and 2000 of more open trade, when the marginal impact of trade on productivity growth favoured the richer countries and turned negative for poorer countries. This has been associated with the “fallacy of composition” facing exporters of some manufactured goods and reflects the widespread efforts to replicate the export-led growth strategies of East Asian newly industrializing economies (United Nations Conference on Trade and Development, 2002). This may cause some countries to get stuck on a weak investment-low productivity growth path which is vulnerable to exogenous shocks of one kind or another. The fact that long-term competitiveness and development are determined by capital-intensive and knowledge-based exports requires an explicit industrial policy designed to give support to infant industries and exporting firms and to introduce local content rules and coordinate large investment in infrastructure and human capital. It was precisely because macroeconomic policies were well integrated with other policy areas that the transformation of the structure of exports in East Asia was successful. Monetary policy was coordinated with financial sector and industrial policies, including directed and subsidized credit schemes and managed interest rates, to directly influence investment and saving, while competitive exchange rates were considered essential for encouraging exports and export diversification. Similarly, East Asia’s productive transition towards higher value added products was supported by fiscal policies that gave priority to investment in education, health and infrastructure, as well as subsidies and credit guarantees for export industries. There was also a close link between economic and social policies (see chap. V). Macroeconomic policies in those countries were part of a broader development strategy which contributed to long-run
Dealing with Macroeconomic Insecurity • 33 growth. In contrast, macroeconomic policies in many Latin American and African countries since the 1980s have been focused on much more narrowly defined short-term stabilization objectives, often leading to declining public investment and exchange-rate overvaluation which undermine efforts to diversify production and exports (United Nations, 2006).
Capital flows and the changing dynamics of business cycles Parallel to the large expansion of trade, the lifting of capital controls in most countries supported greater financial integration in industrialized and developing countries (Prasad and others, 2003). Net financial transfers to developing countries had increased substantially starting from the early 1990s after a drought in the 1980s.5 Figure II.5 shows continued strong expansion of net foreign direct investment (FDI) flows. Growth of net transfers related to other portfolio investments were (in the aggregate) rather short-lived and these were reversed after the Asian financial crisis of 1997. The reversal more than offset the growth in net FDI flows. The shift was associated with the sudden stop in private capital flows to emerging market economies in response to the string of financial crises that had occurred in the late 1990s. This stop was followed by a strong shift towards current-account surpluses in many developing countries. The pattern is similar, though it varies in degree, across developing-country regions (see figure II.6). Strongly rising current-account surpluses were registered in East Asia from 1998 onward thanks to a combination of sharply declining imports (due to an economic slowdown) and rising exports (due to currency depreciation). Many commodity-exporters also started to generate large current-account surpluses, oil-exporters in particular, following the surge in commodity prices from the early 2000s. In Asia, growing external surpluses reflect the desire for greater “self-insurance” against external shocks through the accumulation of official reserves. As the countries in the region witnessed, at the same time, a return of strong capital inflows, part of the reserve accumulation can be seen to have consisted partly of “earned reserves” (that is, reserves generated by current-account surpluses) and partly of “borrowed reserves”, a distinction relevant for the policy implications, as discussed further below. The growing influence of financial markets and institutions on economic growth and development has been described as a process of “financialization”. It involves a structural shift in the organization of economic activity with an “increasing role of financial motives, financial markets, financial actors and financial institutions in the operation of the domestic and international economies” (Epstein, 2005, p. 3).
34 • Rob Vos, Diana Alarcón and Mariangela Parra-Lancourt Figure II.5 Net transfera of resources, developing countries, 1975-2005 A. Including fuel exporting countries
5.0
Percentage of GDP
3.0 1.0 -1.0 -3.0 -5.0
1999
2001
2003
2005
1999
2001
2003
2005
1997
1995
1993
1991
1989
1987
1985
1983
1981
1979
1977
1975
-7.0
Year B. Excluding fuel exporting countries
5.0
Percentage of GDP
3.0 1.0 -1.0 -3.0 -5.0
1997
1995
1993
1991
1989
1987
1985
1983
1981
1979
1977
1975
-7.0 Year
Net transfer of resources (NTR)
FDI NTR
Financial NTR
Source: UN/DESA calculations, based on data from International Monetary Fund (IMF) International Financial Statistics (IFS) online database. a Defined as net financial inflows less investment income payments to abroad.
Dealing with Macroeconomic Insecurity • 35 Figure II.6 Net transfera of financial resources, Latin America, Africa and East Asia, excluding China, 1975-2005 A. Latin America
5.0
Percentage of GDP
3.0 1.0 -1.0 -3.0 -5.0
2005
2003
2001
1999
1997
Year
1995
1993
1991
1989
1987
1985
1983
1981
1979
1977
1975
-7.0
B. Africa
5.0
Percentage of GDP
3.0 1.0 -1.0 -3.0 -5.0
1999
2001
2003
2005
1999
2001
2003
2005
1997
1995
1993
1991
1989
Year
C. East Asia, excluding China
15.0 10.0 5.0 0.0 -5.0 -10.0
Net transfer of resources (NTR)
FDI NTR
1997
1995
Year
1993
1991
1989
1987
1985
1983
1981
1979
-25.0 -30.0
1977
-15.0 -20.0
1975
Percentage of GDP
1987
1985
1983
1981
1979
1977
1975
-7.0
Financial NTR
Source: UN/DESA calculations, based on data from International Monetary Fund (IMF) International Financial Statistics (IFS) online database. a Defined as net financial inflows less investment income payments to abroad.
36 • Rob Vos, Diana Alarcón and Mariangela Parra-Lancourt Indeed, the global stock of financial assets has risen 12-fold since 1980, three times as fast as global GDP. The value of daily foreign-exchange transactions, which amounted to just $80 billion in 1980 now stands at close to $2,000 billion, a growth rate six times faster than that of foreign trade. There have been massive two-way flows of funds dominated by short-term capital movements in the form of cross-border bank lending, equities and bonds. The market for corporate control through cross-border mergers and acquisitions has also mushroomed and a good deal of foreign investment has been in banking, insurance and other financial services (Cumming, 2006). These trends are closely associated with the rapid liberalization of domestic financial markets and the opening up of the external capital accounts, which, together with the increase in cross-border flows, were expected to bring large efficiency gains and faster growth (Mishkin, 2006). These benefits would derive, in part, from a better intertemporal match among a larger pool of savers and investors. Moreover, financial innovation (closely associated with more competitive financial markets) and the greater depth of financial markets would greatly reduce risk as hedging and insurance options became more attractive, and the threat of shocks and crises diminished. Indeed, the term “securitization”, coined to describe the plethora of new financial instruments devised to pool and transfer risk, would suggest that the unshackling of finance brings about a safer and more stable world economy. However, in practice, these financial dynamics, with their introduction of heightened risks of strongly pro-cyclical volatility, have had far-reaching implications for the real economy. Episodes of exceptionally rapid economic expansion driven by financial bubbles can bring periods of growing prosperity, but they can end very suddenly in recessions or longer periods of slow growth. Sharp swings in asset prices, exchange rates and aggregate demand cause a fundamental uncertainty regarding the return on capital, shorten planning horizons and promote defensive and speculative strategies in investment which can, in turn, exert a significant adverse influence on the pace and pattern of capital accumulation, economic growth and employment.6 These problems are particularly serious in developing countries in view of the limited scope therein for pursuing effective counter-cyclical macroeconomic policies.7 The nature of vulnerability to capital flow reversals varies, but in many emerging markets since the 1970s, a financial crisis has often been triggered by factors beyond the control of recipient countries, including shifts in monetary and financial policies in the major industrialized countries. The developing world has experienced two full medium-term cycles in capital flows that have had a strong impact on stability and growth in many countries, and the world seems to have entered a third cycle most recently.
Dealing with Macroeconomic Insecurity • 37 The first cycle had started with the boom in international bank lending to developing countries in the 1970s and ended in debt crises in the 1980s. Another boom occurred in the 1990s, which was mainly driven by portfolio investment flows and, to a lesser extent, FDI; it came to an end with a sharp decline in net flows after the Asian financial crisis. The recovery from the global slowdown in 2001, an improved international economic environment and strengthened economic conditions in developing countries have provided the basis for a renewed recovery of private capital flows since 2003, indicating the beginning of a third cycle. The pro-cyclical nature of capital movements has been well documented (see, among others, United Nations Conference on Trade and Development, 1991; Vos, 1994; World Bank 1999; United Nations, 2006, chap. IV). Aside from being characterized by strong pro-cyclical features, boombust cycles tend to spill over to other markets (contagion). Mexico’s currency crisis led to capital reversals in other emerging market economies. The Asian crisis and the Russian default in 1998 caused a more general withdrawal of funds invested in developing countries. Since a country’s loss of access to markets for international banks or bond markets spreads to include other sources of financing (in addition to the fact that it may affect market access of other countries), an across-the-board market closure may follow. Even when countries do not fully lose market access, they tend to be subject to increases in risk premiums. The pro-cyclical downgrades by credit-rating agencies often exacerbate both reduced access to portfolio loans and the higher spreads at which bonds can be issued. Although FDI flows had also been negatively affected by the Asian crisis, they remained positive and became the dominant source of private capital flows to developing countries. It is worth noting, however, that FDI also moves pro-cyclically, although not to the same extent as do short-term lending and portfolio investment (World Bank, 1999). Therefore, FDI can also increase macroeconomic instability. This is so, in part, because an important share of FDI takes the form of mergers and acquisitions of firms in developing countries, which are pro-cyclical (United Nations, 2006, chap. III). Moreover, to the extent that FDI is geared towards the domestic market, it is also likely to respond to an economic downturn in the same way that domestic investment does. The pro-cyclical nature of private capital flows limits the space available to Governments in developing countries for conducting counter-cyclical macroeconomic policies. In this respect, capital-account liberalization has added a new and increasingly dominant dimension to financial cycles in developing countries, creating mutually reinforcing interactions among credit,
38 • Rob Vos, Diana Alarcón and Mariangela Parra-Lancourt capital and currency markets. The failure to contain the impact of surges in capital inflows can thus lead to large macroeconomic imbalances, which will call for sizeable downward adjustment of the economy when there is a sudden stop in the access to external financing. This reduced capacity to implement counter-cyclical policies implies that access to international financial flows also has an impact on the real economy, although not by smoothing the business cycle, as had been anticipated by economic theory, but rather by magnifying it (Kaminsky, Reinhart and Végh, 2004; Ocampo and Vos, 2008). Under weak regulation, common to most developing countries, surges in capital flows will exacerbate the tendency towards excessive risk-taking and create the conditions for boom-bust cycles. The volatility and pro-cyclical nature of private capital flows to developing countries explain in part why no evidence can be found indicating that such capital movements in general have resulted in increased investment or higher long-term economic growth during the past three decades (Prasad and others, 2003; Ramey and Ramey, 1995). While capital surges stimulated aggregate demand and investment, a large part of the gains were often more than reversed in cases where the sudden stop triggered a financial crisis. Financial volatility thus translated into increased investment uncertainty and greater output volatility, which were detrimental for long-term economic growth, consistent with the evidence presented in the previous section. Over the past decade, liquidity expansion and low interest rates have also resulted in a rapid growth of lending in property markets in developed countries, notably the United States of America, where high-risk sub-prime mortgages rapidly became a source of global instability. The impact has been felt beyond the mortgage market by third-party investors, as the rights to mortgage payments had been transferred by original lenders in packages of mortgage-backed securities and collateralized debt obligations. Despite the intervention by central banks in industrialized countries, conditions in credit markets are tight as banks started to reveal major losses. There are strong signals that the exceptionally favourable cyclical conditions prevailing in the world economy since the early years of the decade are coming to an end, creating a growing concern that the financial excesses may not be undone through an orderly correction (United Nations, 2008a). Financial bubbles almost always give rise to lopsided expansions in some sectors which become unviable with a return to normal conditions. This is particularly true for areas susceptible to speculative investment such as that involving residential and commercial property, although more productive sectors can also experience such a phenomenon, as was the case in SouthEast Asia in the run-up to the crisis in 1997. Furthermore, with increased
Dealing with Macroeconomic Insecurity • 39 access of households to credits, financial booms can also produce sharp increases in consumer spending, reducing household savings and raising indebtedness, as in Latin America during the 1990s. Greater prominence of financial markets in the world economy could thereby divert resources from productive investment. This draining of resources for productive investment may be one of the reasons why the output lost during a negative economic shock is usually not regained during periods of expansion, particularly in countries with liberalized capital accounts.
From economic vulnerability to economic insecurity The pro-cyclical behaviour of finance and the vulnerability of countries to external shocks result in economic insecurity for individuals and households. Evidence presented above shows that reduced volatility in key macroeconomic variables is not enough to stimulate productive investment and faster growth in many countries. The remaining high investment volatility and consequent lower growth has adversely affected growth of employment and household incomes. Episodes of exceptionally rapid economic expansion driven by financial bubbles can no doubt bring greater prosperity than expansions where finance plays a more passive role. However, there are serious questions about how far that prosperity spreads and whether susceptibility to deeper recessions or longer periods of stagnation do not result in considerable waste of resources of both capital and labour. Economic insecurity is further aggravated by the absence of a social contract that provides minimum protection to citizens against unanticipated income loss (see chap. V). The problem is particularly serious in many developing countries in view of their limited capacity to pursue effective counter-cyclical macroeconomic policies. Extreme poverty, defined as the lack of resources to meet the daily food intake requirement of individuals, is the most damaging expression of economic insecurity. Economic growth in recent years has, in many cases, failed to generate rising incomes for the poor. Even countries that have been growing faster and showed more stability were not necessarily able to translate growth into poverty reduction. This is one of the reasons only a weak correlation has been observed between per capita income growth and poverty reduction across countries (see figure II.7).8 Such an outcome reflects, in part, the tenuous links among growth, investment and labourmarket performance in the new economic environment. Concerns about the instability of employment, low pay and lack of protection systematically appear among the top preoccupations of people
40 • Rob Vos, Diana Alarcón and Mariangela Parra-Lancourt Figure II.7 Growth, volatility and poverty reduction, 1981 and 2004 Percentage
100 90 Incidence of poverty, 2004
80 70 60 50 40 30 20 10 0 0
20
40 60 Incidence of poverty, 1981
80
More growth-less volatility
More growth-more volatility
Less growth-less volatility
Less growth-more volatility
100
Source: UN/DESA based on United Nations Statistics Division National Accounts database; and World Bank PovcalNet, for poverty estimates. Note: The classification of countries was based on the following criteria: More (less) growth refers to countries with faster (lower) rates of growth in GDP per capita in the period 2001-2006 when compared to average growth in 1971-1980. More (less) volatility refers to countries with higher (lower) volatility of GDP per capita growth in 2001-2006 when compared to 1971-1980. Volatility was measured by the coefficient of variation of GDP growth.
in developed and developing countries. In Latin America, unemployment is mentioned as the number one problem in 10 out of 18 countries. In 2006, 67 per cent of people in the region were preoccupied (or very preoccupied) by the possibility of losing their job.9 In Asia, opinion surveys in 34 countries pointed to poverty and unemployment as the issues of most concern .10 Opinion surveys conducted in 15 African countries in 2002-2003 had revealed a rather pessimistic view about the economy and the personal situation of people and families. While there was no explicit reference to employment, about 50 per cent of people felt their living conditions were “fairly bad” or “very bad”.11 In the 2007 opinion surveys in Europe, unemployment figured prominently as the most important problem: 34 per cent of people said it was the issue of most concern to them, followed by crime (24 per cent), the economic situation, inflation and health care.12
Dealing with Macroeconomic Insecurity • 41 Such perceptions seem to be at odds with the reference to sound fundamentals and the observed declines in macroeconomic volatility. Hence, it must be the case that, underneath those aggregates, there have been changes in labour markets, affecting the sense of job security, fair remuneration, career perspectives, and minimum income security. The present section will try to identify the changes that have taken place in global labour markets over the past decades in order to assess whether vulnerability has in fact increased.
Increased labour-market vulnerability in developed countries The sense of insecurity reflected in opinion surveys is likely associated with more fundamental changes in the structure of employment and the system of social protection, particularly in developed countries. As we have seen, macroeconomic instability in previous decades and orthodox policy responses in most countries have produced a more pronounced investment cycle, with investment rising faster than income during expansions and falling faster during contractions; this higher degree of investment uncertainty has generally been accompanied by a lower average rate of investment growth. A concomitant feature of this cycle has been a rising share of profits in most countries which has not translated into an equally strong increase in the share of investment in GDP, and which has in many cases been accompanied by a declining share (figure II.8). Ceteris paribus, slower investment growth translates into lower employmentcreation and a likely deterioration in the conditions of employment. This would be especially the case if the reduction of investment affects those productive sectors that require large investment in fixed capital over longer periods of time—presumably, the sectors that would normally be able to offer greater job stability and better conditions of employment. The combination of higher profits and stagnant or lower investment appears to be linked to the prominent role of the financial sector in recent years. Stockhammer (2004) suggests that the advent of new financial instruments and changes in the pay structure of managers (for example, stock options) has changed management priorities in some countries, moving them away from long-term company growth and towards short-term shareholder returns. This change can include large restructuring and an intensive search for cost-cutting strategies even in reasonably good times, leading to the reduction of jobs and productive capacity for the purpose of generating cash to boost share prices and buy-backs. Moreover, the exposure of financial fragility and over-indebtedness during a cyclical downturn can also lead to an
42 • Rob Vos, Diana Alarcón and Mariangela Parra-Lancourt
Percentual change in investment as a percentage of GDP, 2000-2006, versus 1980-1990
Figure II.8 Change in profit share and investment in �developed economies, 2000-2006 versus 1980-1990 30
Spain
20
Belgium Ireland Iceland
10
Denmark 0
United States United Kingdom France Italy Canada Netherlands Australia Portugal Sweden Japan
-10 -20 -30
Austria Greece
-30
Finland -20 -10 0 10 20 30 40 50 Percentual change in profit share at market prices, 2000-2006 versus 1980-1990
Source: UN/DESA calculations, based on AMECO (annual macroeconomic database) of the European Commission Directorate General for Economic and Financial Affairs. Note: The profit share is defined as a 1-wage share, where the wage share is defined as the compensation per employee as a percentage of GDP at market prices. Investment is defined as private sector gross fixed capital formation as a percentage of GDP at market prices. Presented are the percentual changes between the variables’ annual averages for 2000-2006 and 1980-1990.
increased use of profits to reduce debt rather than expand productive capacity as things turn around, resulting in a combination of weak employment with rising productivity and profits, even as economic conditions improve. This is not helped by lingering uncertainties about the strength of the recovery following finance-driven recessions, which further discourage firms from making long-term employment commitments. Indeed, one of the consequences of increased financial instability is the growing demand by firms for more flexible hiring-and-firing practices as a buffer against large and unexpected swings in the overall level of economic activity. One sign of weak or deteriorating labour-market conditions in a number of developed countries is the increasing share of involuntary part-time employment. Some workers in the labour market may consider part-time work to be an attractive option, and this has helped to increase the participation of young people, women with children and older workers in some countries. However, for an increasing number of workers who are unable to find full-time employment, part-time employment has become an “option of last resort”, serving as a
Dealing with Macroeconomic Insecurity • 43 substitute for full-time work. Although the share of involuntary part-time workers—those who would prefer full-time work but cannot find it—constitutes a small proportion of total employment, this increasing trend in a number of countries is a cause for concern, suggesting either that not enough full-time jobs are being created for the labour force, or that the jobs being created are not suitably matched with the skills of the labour force (see figure II.9). Another factor changing the conditions of global employment is the emergence of export-oriented newly industrializing economies. This trend is part of an ongoing process of closer integration through trade which has steadily modified the structure of production and the patterns of trade across countries. The argument that trade with newly industrializing economies can cause employment adjustments, possibly quite large, in established producers is certainly a plausible one; the argument, however, that it has been an independent cause of labour-market vulnerability in the advanced countries is much less convincing. Rather, the possibility that the normal adjustments have produced an abnormal sense of insecurity has much more to do with the existence of unfavourable macroeconomic conditions since the late 1970s, even as closer trade integration continued, which has made it more difficult for displaced workers to find comparable or better employment opportunities (United Nations Conference on Trade and Development, 1995). Figure II.9 Incidence of involuntary part-time work, selected regions, 1983-2004 35
Percentage
30 North America 25 20
G7 countries
15
OECD total
10
Europe
5
Oceania
Source: Organization for Economic Cooperation and Development (2007b).
2004
2003
2002
2001
2000
1999
1998
1997
1996
Year
1995
1994
1993
1992
1991
1990
1989
1988
1987
1986
1985
1984
1983
0
44 • Rob Vos, Diana Alarcón and Mariangela Parra-Lancourt On some assessments, these adjustments have become greater and more difficult to manage as a result of the intertwining of trade, technological change and increased capital mobility in the form of global supply chains and the possible “offshoring” of economic activities. The resulting expansion of job opportunities among unskilled workers in developing countries has almost certainly led to a displacement of workers in developed countries. The scale of this recent displacement has been much debated and there are clearly variations among countries (Milberg and Scholler, 2008). However, it is not a new phenomenon and offers no more of a convincing explanation, by itself, of the rising levels of anxiety associated with deteriorating labour-market conditions than do previous episodes of rapid trade expansion.13 Rather, this latest manifestation has, in many countries, taken place against a backdrop of declining social protection, whether measured by the unemployment benefit replacement rate, trade union membership, spending on active labour-market policies, the strength of hiring and firing regulations, or other indicators. Indeed, differences across countries in the coverage of social protection appear to be a strong guide to how workers perceive the threat from international trade (ibid.). An important measure of economic insecurity is based on the ability of workers displaced by trade to find new work and not suffer a loss in earnings. Kletzer (2001) has carried out the most extensive analysis of the reemployment rate and replacement wage for workers displaced as the result of foreign trade. In a study of the United States from 1979 to 1999, she found that earnings losses from job dislocation had been large and persistent over time. Specifically, she found that 64.8 per cent of manufacturing workers displaced from 1979 to 1999 had been re-employed and one fourth of those re-employed suffered earnings declines of greater than 30 per cent. Workers displaced from non-manufacturing sectors did a little better: 69 per cent were re-employed, and 21 per cent suffered pay cuts of 30 per cent or more. The Organization for Economic Co-operation and Development (2005) conducted a similar study for 14 European countries for 1994-2001 and found that, while re-employment rates in Europe were lower than in the United States, a much lower share had earnings losses of more than 30 per cent upon re-employment and a slightly higher share either had no earnings loss or were earning more than before displacement (table II.6).
Labour-market vulnerabilities in developing economies The impact of globalization on the conditions of employment in developing countries has also brought much controversy in recent years. On the one hand, most employment in the developing world is in non-tradable sectors,
47.1
57.3
All sectors
7.5
8.4
5.4 7.0 6.8
6.5
Share with earnings losses > 30 per cent
-
69.1
63.4 65.4 66.8
64.8
Share re-employed at survey date
-
41.0
36.0 34.0 38.0
35.0
Share with no earnings loss or earning more
-
21.0
25.0 25.0 26.0
25.0
Share with earnings losses > 30 per cent
United States, 1979-1999
Sources: Organization for Economic Cooperation and Development (2005, p. 45, table 1.3); and Kletzer (2001, p. 102, table D2). a Secretariat estimates based on data from the European Community Household Panel (ECHP) for Austria, Belgium, Denmark, Finland, France, Germany, Greece, Ireland, Italy, Luxembourg, the Netherlands, Portugal, Spain and the United Kingdom of Great Britain and Northern Ireland. b Services for Europe.
49.6
57.2
Services and utilitiesb
45.8 44.0 45.7 47.3
57.0
Share with no earnings loss or earning more
51.8 58.7 59.6
High international competition Medium international competition Low international competition
Manufacturing
Industry
Share re-employed two years later
Fourteen European countries, 1994-2001a
Table II.6 Adjustment costs of trade-displaced workers in Europe and the United States of America, 1979-2001
Dealing with Macroeconomic Insecurity • 45
46 • Rob Vos, Diana Alarcón and Mariangela Parra-Lancourt including the informal urban areas, and in subsistence agriculture (especially in low-income countries). Thus, the evolution of employment conditions has been subject to significant country-specific factors. On the other hand, greater integration in the trade and financial markets has led to important changes in the nature and characteristics of business cycles and a large restructuring of production across countries. The expansion-recession-recovery cycles driven by international capital flows have been characterized by similar developments in investment and employment in developing and in developed countries. Not only do boom-bust cycles distort the composition of investment, but they tend, as discussed earlier, to lower its average level over the entire cycle. In the labour market, booms generated by capital inflows had often raised real wages, but the behaviour of employment depended on several factors. However, in all countries, real wages fell and unemployment rose sharply during busts, often to levels below those of the previous recession. Moreover, the subsequent recoveries were by and large “jobless”: the unemployment rates remained above the rates reached during expansion by between 4 and 6 percentage points even after income losses had recovered. Indeed, evidence suggests that under conditions of increased instability and uncertainty, even longer periods of growth may fail to generate decent jobs.14 In the case of Turkey, the World Bank, Independent Evaluation Group (2006, p. 4) has noted that “the growth that did occur (during 1993-2004) was relatively jobless as the volatility of the economy made employers less likely to hire new workers than to extend work hours of existing employees”. A more difficult issue entails assessing the impact of trade liberalization and the fast growth of FDI associated with the growing importance of global production chains and outsourcing. On standard theoretical grounds, expected large welfare gains in developing countries from trade liberalization would come from the fuller utilization of their existing resources, through expanded production in either the primary sector or labour-intensive manufactures. However, more sophisticated models in which trade depends on more than just factor endowments suggest more varied welfare possibilities. Empirical results show that the impact of trade on growth and employment is diverse, is generally small and is the result of the complex interaction of supply and demand factors in the economy as well as government policies designed to regulate the macroeconomy and the labour markets.15 Evidence presented in World Economic Situation and Prospects 2008 (United Nations, 2008, chap. I) and reproduced in figure II.10 below shows that the recent recovery of growth in developing countries has not been accompanied by a parallel improvement in the conditions of employment.
Dealing with Macroeconomic Insecurity • 47 Figure II.10 GDP and employment growth in selected developing countries and areas, 2000-2006 Percentage
6
Low-growth/employment achievers
High-growth/employment achievers
Costa Rica
5 Employment growth
Uruguay Guatemala
4
Jamaica
Pakistan Mongolia
Brazil South Africa
2
Trinidad and Tobago
Peru
Honduras Sri Lanka Mexico Thailand
1
Indonesia Mauritius
Low-growth/employment laggards
0 0
1
2
3
4
China High-growth/employment laggards
5 6 GDP growth
Latin America and the Caribbean
7
Africa
8
9
10
Asia
Source: UN/DESA, based on International Labour Organization, Key Indicators of the Labour Market: Fifth Edition (Geneva, International Labour Office, 2007); and World Bank, World Development Indicators (Washington, D.C., 2007, World Bank).
About one half of the countries that experienced high rates of growth had similar improvements in employment. There were few countries with low rates of economic growth and greater employment-creation. For a large number of countries, high unemployment is the expression of job creation insufficient to accommodate a rapidly growing labour force. As discussed earlier, countries with less diversified production and export structures tend to show greater investment volatility and are more vulnerable to external shocks. With the lack of adequate social protection systems, such volatility directly translates into more insecure employment conditions in most developing-country contexts. Further, specialization on primary export production and light manufacturing, typical in most offshore production zones, does not, in the absence of other policy measures, create strong employment multiplier effects. Mineral exports and some agricultural export crops tend to involve relatively capital-intensive production processes with low direct employment-creation.16 Much of the production of light manufactures for exports involves assembly operations (maquiladoras), which, while labour-intensive, are also
48 • Rob Vos, Diana Alarcón and Mariangela Parra-Lancourt characterized by a low share of value-added generation and limited spinoff effects to the rest of the economy, as production is highly reliant on imported inputs. A recent study of Mexico, for example, estimates that imports for processing constitute as much as one half to two thirds of total sales of affiliates of United States-based transnational corporations in industries such as computers and transport equipment, while the growth in value added has been negligible (Hanson and others, 2002). Even in South-East Asia and, more recently, China, where these sectors have produced very large increases in exports and employment, wages have lagged behind productivity growth and the lack of linkages to the domestic economy and the weakness of upgrading into medium-level technology sectors are raising concerns among policymakers.17 For the majority of urban workers in developing countries, the lack of employment-generation in high-productivity activities (and the downsizing of public sector employment) continues to push vast numbers of workers into low-paid informal sector jobs, generally characterized by a high degree of job and income insecurity.18 In low-income countries, agriculture remains the main employer, but with a growing share of workers engaging in urban informal activities. The absence of universal social protection for most of these workers leaves them without proper access to health-care services and pensions for old age. In 2005, in Latin America, for example, while 58.9 per cent of the total urban employed had health and/or pension coverage, the lowest coverage (33.4 per cent) was in the informal economy, where 48.5 per cent of workers are employed (figure II.11). A large share of informal employment is associated to low levels of development (Figure II.12). Decreasing the vulnerability of workers in the informal sector will require an expansion of social protection programmes and stronger regulatory frameworks (see chap. V); but more than anything, it will require the adoption of policies designed to decrease macroeconomic instability and raise the level of productive investment and, along with explicit industrial policies, to increase the level of employment and productivity in the formal economy.
Managing external shocks and the business cycle Adverse external shocks transmitted through the trade and capital accounts have direct impacts on economic security and the fight against poverty, whether through repressed investment, wasted resources or lost output. During the 1980s and 1990s, many developing countries had tried to mitigate
Dealing with Macroeconomic Insecurity • 49 Figure II.11 Urban employed population with health and/or pension �coverage in selected Latin American countries, 2005 120
Percentage Informal economy
Formal economy
100 80 60 40
Uruguay
Peru
Paraguay
Panama
Mexico
El Salvador
Ecuador
Costa Rica
Colombia
Chile
Brazil
Latin America
0
Argentina
20
Source: ILO, 2006 Labour Overview: Latin America and the Caribbean (Lima, International Labour Office, Regional Office for Latin America and the Caribbean, 2006).
Figure II.12 Relation between the share of self-employed and contributing �family workers to total employment and GDP per capita, 2005
Percentage of self-employed and contributing family workers
100 80 60 40 20 0 -20 0
5 000
10 000 15 000 20 000 25 000 30 000 35 000 40 000 45 000 50 000 GDP per capita
Sources: UN/DESA based on International Labour Office, Global Employment Trends, 2007 (Geneva, International Labour Office, 2007); and World Bank, World Development Indicators online (2008). Note: Latest available year is 2003, 2004 or 2005 depending on data availability for 89 countries; years correspond for the two variables.
50 • Rob Vos, Diana Alarcón and Mariangela Parra-Lancourt the impacts of these shocks with measures that emphasized controlling inflation and restoring fiscal balance. This not only delayed the recovery, but has, in many cases, actually made countries weaker and more vulnerable to future shocks. These policies have been detrimental to long-term investments, especially infrastructure and human capital development (United Nations, 2006). They have also intensified boom-bust cycles which have negatively impacted on productive investment. More recently, many developing countries have accumulated vast amounts of international reserves as a selfinsurance against commodity price shocks and sudden stops and reversals in capital flows. This insurance strategy comes, in most cases, with rather high costs, however. A different approach is required. The key elements of an alternative approach are presented in the present section. First of all, macroeconomic stabilization policies should be well coordinated with other areas of economic policies to ensure that the overall policy stance is conducive to preserving stability while promoting economic growth, diversification of production and employment-generation. Second, developing countries need to create more space within which to conduct counter-cyclical macroeconomic policies. This not only would involve avoiding pro-cyclical monetary and fiscal policy stances, but also might include— depending on country conditions—important roles for fiscal stabilization or savings funds and counter-cyclical prudential financial regulation and capital controls. Third, such national policy efforts will need to be supported by regional and multilateral cooperative actions. For many Governments of developing countries, the space for conducting counter-cyclical macroeconomic policies is limited, as the available fiscal and foreign-exchange resources tend to be small relative to the size of the external shocks they face. International action mitigating the impact of private capital flow volatility and providing liquidity that can be quickly disbursed with low policy conditionality can enhance the necessary policy space. This should also involve better reserve pooling mechanisms to reduce the costs of self-insurance.
Integrating macroeconomic and development policies Economic growth in recent years does not necessarily translate into better incomes and greater economic security for people. For economic growth to be inclusive in the sense of reducing vulnerability, macroeconomic policies must place employment and economic security at the centre of the policy agenda. The Millennium Development Goals were recently expanded to incorporate the objective of achieving full and productive employment and decent work
Dealing with Macroeconomic Insecurity • 51 for all as part of the first Goal. Achieving this Goal will require a view of the policy framework that extends beyond price stability and fiscal balance to incorporate employment-creation as a central policy objective. This requires that macroeconomic policies be embedded in a broader development strategy, as was the case in the fast-growing East Asian economies. Fiscal policies would give priority to development spending, including investment in education, health and infrastructure. It would also mean using fiscal instruments such as tax breaks, accelerated depreciation allowances and subsidies to boost productive investment. As with the East Asian experience, monetary policy would be coordinated with financial sector and industrial policies, including directed and subsidized credit schemes and managed interest rates, so as to directly influence investment and savings. The right mix of these policies can be applied deliberately so as to promote investment in specific industries at specific times, but it should be especially promoted in sectors with the greatest potential for upgrading skills, reaping economies of scale and raising productivity growth, thereby increasing the rates of return on investment. Such measures can further set the tone for a different kind of competition policy which, instead of promoting competition for its own sake, looks to utilize it to foster diversification and development. Maintaining competitive exchange rates is considered essential for encouraging export growth and diversification. A depreciated real exchange rate lowers labour costs and enhances the competitiveness of labour-intensive exports. The empirical evidence suggests, however, that this does not “condemn” countries to permanent specialization in low-tech exports; rather, with consistent policy direction, export diversification into higher-end products will be promoted (Rodrik, 2005; Ocampo and Vos, 2008). Macroeconomic policies in many Latin American and African countries since the 1980s, in contrast, have been focused on much more narrowly defined short-term price stabilization objectives and this has often resulted in exchange-rate overvaluation, unbalanced growth and a lack of economic diversification (United Nations Conference on Trade and Development, 2003). Although complete global food security will be difficult to achieve, in the long run, agrarian development and reform programmes are needed to raise investment and stimulate productivity of food production. These programmes should focus on small poor farmers since they constitute the most vulnerable group in the rural areas, through providing investment in rural infrastructure and access to credits, to affordable modern farm inputs and to land through land redistribution. South Asia and sub-Saharan Africa (and some countries in Latin America and the Caribbean) should be the priority focus of these
52 • Rob Vos, Diana Alarcón and Mariangela Parra-Lancourt programmes, since they are the most vulnerable in terms of food security. A recent report of the Economic and Social Commission for Asia and the Pacific (United Nations, Economic and Social Commission for Asia and the Pacific, 2008) has shown that, in Asia, raising agricultural productivity in all countries in the region to the level of that of Thailand could lift more than 200 million people out of poverty. Land and labour productivity of cereal production in Africa has been lower than in Asia and Latin America (World Bank 2007). Increased public spending on research and development to improve agricultural technology and raise productivity is essential. In the 1980s, Governments reduced research and development spending for agricultural development because it was thought that the food security problem had been resolved. This trend has been detrimental for agricultural productivity, especially for small farmers in developing countries.
The need for counter-cyclical macroeconomic policies Governments can enhance the scope for counter-cyclical policies by improving the institutional framework for macroeconomic policymaking. Setting fiscal targets that are independent of short-term fluctuations in economic growth (so-called structural budget rules) as well as commodity stabilization funds can be effective in forcing a counter-cyclical policy stance. In developing countries with open capital accounts, where conducting counter-cyclical monetary policies has become increasingly difficult, there is a need to consider effective measures to control and regulate international capital flows as well as the operations of the domestic financial sector.
A role for counter-cyclical monetary policies? The role of monetary policy in managing the business cycle is fairly limited. In general, even in developed countries, monetary policy is seen to be more effective in restraining an overheated economy than in stimulating an economy in recession. Monetary policy has proved to be ineffective in stimulating growth in countries experiencing inflation. In the United States, lowering interest rates in 2001-2003 had done little to stimulate private investment; however, it did induce a housing boom which stimulated growth of household consumption, but which also forged a widening of external deficits and the build-up to the financial sector woes that had pushed the United States economy back into recession by 2008.
Dealing with Macroeconomic Insecurity • 53 The effectiveness of monetary policies in developing countries tends to be even weaker, particularly during asset price-driven cycles.19 Monetary policy tends to have its most direct impact through the banking sector. With a more developed financial sector, the impact of monetary policies will be more significant by affecting the cost and availability of investment financing. In countries with open capital accounts, however, the degree of monetary policy autonomy is strongly reduced and fluctuations in economic activity are strongly associated with cycles in capital inflows. In such a context, lowering interest rates can induce capital outflows and a weaker exchange rate. The latter could help promote export diversification, as indicated, but the weakened balance sheets of the financial sector that often result from currency depreciation—especially when there is significant liability dollarization in the system—will limit credit availability and this in turn will weaken the stimulus to aggregate demand. Increasing interest rates could push these ambiguous effects in the opposite direction. Most importantly in the context of volatile capital flows, the uncertainty about their impact can thus easily turn the use of traditional monetary policy instruments into a source of economic insecurity rather than of stability (Akyüz, 2008; Stiglitz and others, 2006). While this does not preclude a role for monetary policy, it should operate in combination with alternative measures, including counter-cyclical fiscal policies and counter-cyclical regulation of the banking system and capital flows, as discussed below.
Counter-cyclical fiscal policies and stabilization funds Countries should avoid existing pro-cyclical biases in fiscal policy. This can be achieved through the establishment of broad fiscal rules that guarantee the longterm sustainability of fiscal balances, including targets for the budget deficit and limits to public indebtedness. However, defining and adhering to such rules may not be an easy task, not even in developed economies, as demonstrated by the debates over the European Stability and Growth Pact. Such targets will work counter-cyclically if they focus on the “structural fiscal deficit”, which measures what the budget balance would be without cyclical fluctuations. This would imply, for instance, that if tax revenues declined because of a recession, the “current” fiscal deficit would widen, but the structural (full employment) deficit would remain unaffected and the Government would not be forced to tighten fiscal policy in order to meet the given target. Some developing countries, such as Chile during the current decade, have been able to manage such structural budget rules. The management of this counter-cyclical policy
54 • Rob Vos, Diana Alarcón and Mariangela Parra-Lancourt stance has been one ingredient in the much stronger growth performance and macroeconomic stability of Chile compared with other Latin American countries (Fiess, 2002; Ffrench-Davis, 2006). The establishment of stabilization funds could also help smooth out fiscal revenues, especially in countries where commodity prices have a large impact on the economy and the fiscal balance. Commodity exporters face highly uncertain prices. Price volatility is transmitted to the government budget through its impact on tax revenue or on profits of State-owned enterprises in the commodity sector. Two key factors underscore the need for specific measures to smooth government expenditures. First, external financing for commodity exporters tends to be pro-cyclical. It is easily available when commodity prices boom, but that source of financing of fiscal deficits tends to dry up or become more costly when export prices drop. Second, the costs of shutting down lumpy investment projects and other essential public expenditures during downswings tend to be high. Countries facing such constraints will put a high premium on liquidity. A commodity fund, as a form of self-insurance, can help achieve a smoother path of fiscal expenditures and, as such, give Governments an instrument of counter-cyclical management. Also, funds set up as a savings fund to smooth public expenditure over generations (such as Norway’s State Petroleum Fund and Kuwait’s Reserve Fund for Future Generations) offer an element of short-term security if they also save a share of current revenues (Davis and others, 2001). With the help of existing or newly created stabilization or savings funds, countries like Algeria, Chile, Colombia, Ecuador, Kuwait and Mexico have been able to reduce both fiscal and overall growth volatility, but this apparently has not been the case in Nigeria and the Bolivarian Republic of Venezuela (Budnevich, 2008). Fiscal stabilization funds are by no means a panacea and careful management of such funds is required. One complication is the difficulty of distinguishing cyclical price patterns from long-term trends, in part because of the increased influence of speculative financial investments in commodity markets. This has made it more difficult for Governments to determine the adequate size of stabilization funds. The usefulness of such funds as a form of self-insurance has been questioned on these grounds, given that prolonged commodity price booms or collapses risk either endlessly accumulating resources or rapidly exhausting them. Contingent, market-based insurance instruments are sometimes seen to be better mechanisms (Davis and others, 2001; Devlin and Titman, 2004). However, such markets for commodity derivatives and insurance are rather shallow and few commodity producers have relied on them.
Dealing with Macroeconomic Insecurity • 55 The effectiveness of commodity stabilization and savings funds will very much depend on the strength of fiscal institutions. Additional rules for fiscal discipline, debt management, and overall expenditure smoothing typically are required. This requirement could be met by embedding fiscal policy in a medium-term budgetary framework, which may include stabilization funds. A preferred approach would be to base annual public expenditures on expected revenue in the medium run based on a conservative projection of the commodity price trend. In this approach, consistent fiscal surpluses would be generated over time so that financial reserves could be built up during years of upward price trends to finance desired levels of expenditures when commodity revenues fell short. It would also ensure that fiscal policy was counter-cyclical in relation to commodity prices. Appropriately designed stabilization funds can help increase transparency and accountability of fiscal policy by making it possible to track what funds are accumulated, how they are managed, and how much is transferred to be spent through the government budget. All these conditions may prove to be insufficient in situations of large or prolonged adverse commodity shocks or because of large asymmetries in a country’s export price cycles and other external shocks affecting the fiscal balance and the economy at large. It is therefore important that developing countries be able to also rely on an adequate multilateral system of compensatory financing facilities to protect them against the larger commodity price shocks (see below). Effectively managing such a system requires prudent and consistent policymakers and political support to uphold the rules. In general, in the more appropriate institutional setting for macroeconomic policies, a balance should first of all be struck between fiscal and monetary prudence and flexibility in such a way as to ensure both policy credibility and fiscal sustainability. A certain degree of discretionary power should be retained. As the structure of the economy changes over time, so will the vulnerability to external shocks. For instance, financial shocks may become more important than terms-of-trade shocks. In such a changing context, predetermined policy rules likely become less relevant or turn out to be too rigid or the nature of fiscal stabilization funds likely need to be changed. Moreover, as the risks and uncertainties facing an economy never present themselves in exactly the same way or with the same degree of intensity, a certain amount of space for discretionary policies is always needed in order for adjustments to be made that will minimize macroeconomic losses.
56 • Rob Vos, Diana Alarcón and Mariangela Parra-Lancourt
Prudential regulation, capital controls and risk management The limited effectiveness of monetary policies, the pro-cyclical nature of capital flows and the intrinsic imperfections in financial markets justify the prudent use of capital-market interventions. Such interventions may help mitigate volatility in short-term capital flows, discourage long-term capital outflows, reduce the likelihood of financial crises, and stimulate growth by reducing the volatility in the availability and cost of domestic borrowing. Prudential regulation and effective supervision of financial institutions should aim at ensuring the solvency of financial institutions by establishing adequate capital requirements, appropriate standards for risk assessment and diversification, sufficient provision for non-performing and questionable portfolios, and adequate levels of liquidity to address maturity mismatches between their assets and liabilities. However, many of the existing risk assessment methods and prudential rules, including Basel I and Basel II, can serve to amplify cyclicality. This is clearly the case for loan-loss provisions based on current rates of loan delinquency. At times of boom, when asset prices and collateral values are rising, loan delinquency falls and results in inadequate provisioning and overexpansion of credit. When the downturn comes, loan delinquency rises rapidly and standard rules on provisions can lead to a credit crunch. Similar difficulties also apply to capital charges. Banks typically lose equity when an economy is hit by a massive exit of capital, hikes in interest rates and declines in the currency. Enforcing capital charges under such conditions would serve only to deepen the credit crunch and recession. This happened in Asia during the 1997-1998 crisis as a result of extensive efforts to strengthen regulatory regimes as part of the International Monetary Fund (IMF) packages of financial support (United Nations Conference on Trade and Development, 1998). Prudential regulation of the financial sector should thus be redesigned in a counter-cyclical fashion to make the regulatory mechanisms act as built-in stabilizers.20 Forward-looking rules may be applied to capital requirements in order to introduce a degree of counter-cyclicality. This would mean establishing higher capital requirements at times of financial booms, based on the estimation of long-term risks over the entire financial cycle, not just on the actual risk at a particular phase of the cycle. Similarly, not current but future losses can be taken into account in making loan-loss provisions, estimated on the basis of long-run historical loss experience for each type of loan. Again, long-term valuation may be used for collaterals in mortgage lending in order to reduce the risks associated with the ups and downs in property markets.
Dealing with Macroeconomic Insecurity • 57 While useful in containing the damage that may be inflicted by financial crises, none of these measures could adequately deal with the risks associated with sharp swings in capital flows and exchange rates or prevent crises. Such risks can be restricted by more stringent rules for capital charges, loan-loss provisions, liquidity and reserve requirements for transactions involving foreign currencies or through direct restrictions on foreign borrowing and investment. More generally, bank regulations for the management of risks involving foreign-exchange positions need to address three fundamental sources of fragility: maturity mismatches, currency mismatches and exchange rate-related credit risks. Policymakers in China, India and Malaysia have successfully applied quantitative capital-account regulations to achieving such objectives. Malaysia, for instance, imposed direct quantitative restrictions on acquisitions of short-term securities by non-residents in 1994; and research suggests that these were effective in improving the external debt profile, preventing assetprice bubbles, and allowing greater space for macroeconomic policy (Epstein, Grabel and Jomo, forthcoming). Chile effectively used a price-based measure, unremunerated reserve requirements, in a counter-cyclical manner, which was applied to all loans at times of strong inflows in the 1990s, but the measure was phased out when capital dried up at the end of the decade. Prudent management of capital controls may be more effective with a permanent system in place (Akyüz, 2008). A problem with introducing more ad hoc counter-cyclical capital control measures is that they can trigger an adverse reaction from financial markets, leading to sharp falls in stock prices and causing concern among Governments. This was the case in Thailand when a 30 per cent reserve requirement was imposed at the end of 2006 on capital inflows held less than one year, including portfolio equity flows, in order to check continued appreciation of the currency. This provoked a strong reaction from the stock market, forcing the Government to exempt investment in stocks from reserve requirements. More recently, in October 2007, the proposal by the Securities and Exchange Board in India to restrict foreign buying of shares through offshore derivatives resulted in a plunge in shares and suspension of trade, recovery from which occurred only after a plea for calm from the Government. The adverse market reaction to the introduction of counter-cyclical restrictions could be much more dramatic in countries with large stocks of foreign debt, weak current-account positions and a high degree of dependence on foreign capital. This is why, under such conditions, Governments may be inclined to allow inflows of speculative, short-term capital even when they are aware of their potential risks. For these reasons, a permanent system of controls, with instruments’ being adjusted according to cyclical conditions, might make for a more stable environment.
58 • Rob Vos, Diana Alarcón and Mariangela Parra-Lancourt When capital inflows are excessive, it is also possible to adjust the regime for resident outflows so as to relieve the upward pressure on the currency. Chile followed this path in the 1990s for direct investment abroad. More recently, China took a decision to permit investment by its residents in approved overseas markets in order to mitigate the pressure on the exchange rate to appreciate further. Such a policy response is, in fact, an alternative to sterilized intervention, but would do nothing to prevent currency and maturity mismatches in balance sheets. Therefore, prudential management of capital control measures should go hand in hand with the application of counter-cyclical regulation of banks and other financial intermediaries.
Foreign reserve management: reducing the need for “self-insurance” As discussed earlier, a common response in many developing countries to the vulnerability associated with commodity price shocks and sudden stops and reversals of capital flows has been a rapid build-up of reserves. Official international reserve holdings surged from $1.6 trillion in 1999 to about $6.0 trillion in 2007. Developing countries as a group have accumulated three quarters of world reserves, or $ 4.3 trillion. China alone increased its reserve holdings from $0.1 to $1.3 trillion during that period. Foreign reserves held by developing countries have climbed, on average, to no less than about 30 per cent of their GDP—with or without China in the sample (see figure II.13). Even low-income countries, including the least developed countries, have increased their reserve positions so as to reduce their debt vulnerability. Reserves went up from 2-3 per cent of GDP in the 1980s to about 5 per cent in the 1990s and to about 12 per cent in the 2000s (see figure II.14). This has given developing countries a greater buffer or “self-insurance” to cope with external shocks. After the Asian crisis, following speculative attacks on currency-exposed countries, this appeared to be a sensible counter-cyclical strategy. A level of reserves covering about three months of imports had used to be considered adequate, but one of the lessons drawn from the Asian crisis by emerging market economies was that they should also have adequate reserves to cover their short-term external debt. At present, however, developing countries have been accumulating reserves well in excess of that more recent standard. Both low- and middle-income countries have reserves that are almost twice as great as the sum of the value of three months of imports and the stock of short-term external debt. China’s reserves are three times as great. Reserves of the least developed countries are now close to that target.
Dealing with Macroeconomic Insecurity • 59 Figure II.13 Foreign-exchange reserve accumulation by developing countries, 1980-2006 40
Accumulation of foreign-exchange (Forex) (percentage of GDP) All developing countries
35
Developing countries without China
30
China
25 20 15 10 5
2006
2004
2002
2000
1998
Year
1996
1994
1992
1990
1988
1986
1984
1982
1980
0
Sources: UN/DESA, based on International Monetary Fund, International Financial Statistics database.
Figure II.14 Foreign-exchange reserve accumulation by �low-income countries, 1980s, 1990s and 2000s 30
Percentage of GDP 1980s
1990s
2000s
25 20 15 10 5
Zimbabwe Least developed countries Low-income countries Low-income countries (India) Low-income countries (India and Nigeria
Uganda
Vanuatu
Haiti
Guinea-Bissau
Guinea
Gambia
Eritrea
Ethiopia
Djibouti
Equatorial Guinea
Comoros
Congo, Dem. Rep. of
Chad
Central African Republic
Burundi
Cambodia
Benin
Burkina Faso
Angola
Bangladesh
Afghanistan
0
Sources: UN/DESA, based on International Monetary Fund, International Financial Statistics database.
60 • Rob Vos, Diana Alarcón and Mariangela Parra-Lancourt The excess reserve build-up by developing countries suggests that this has been motivated by more than “self-insurance”. Export-led growth strategies in a context of rapid growth of world trade and buoyant commodity prices have led to increasing developing-country trade surpluses and, in this context, the reserve build-up is part and parcel of the dramatic widening of global imbalances over the past decade or so (United Nations, 2008a). In addition, the emerging market economies especially have also seen strong private capital inflows; and in this regard, countries have been able to increase reserve levels through both current- and capital-account surpluses or through a combination of current-account deficits and capital-account surpluses. While providing a buffer and space for counter-cyclical response to adverse external shocks and capital flow reversals, the large build-up of reserves also carries a high price tag. There are a number of significant costs to consider. First, for those countries that borrowed to accumulate reserves (that is, through running capital-account surpluses), there are substantial carry costs. Almost half of reserves accumulated since 2001 have been “borrowed reserves”, equivalent to about $2 trillion (Akyüz, 2008). The annual carry cost of borrowed reserves is estimated to amount to as much as $100 billion, representing a net transfer to reserve-currency countries well above what they provide in terms of official development assistance (ODA).21 Second, there may be important opportunity costs, as foreign-exchange reserves are the financial resources set aside for precautionary needs, which could otherwise be used at the time for domestic consumption or investment. Incurring such costs is justifiable as long as they are smaller than the potential benefits of holding the reserves. These opportunity costs may outweigh the benefits when the accumulation of reserves goes beyond the minimally required level and in cases where resources for long-term investments are scarce. Especially in the low-income countries, such opportunity costs likely will be high. Third, direct financial costs are also rising along with the accumulation of reserves. For example, monetary authorities may try to sterilize excessive domestic money supply growth associated with increased foreign-exchange reserves. However, the domestic bonds or central bank papers that are issued often carry higher interest rates than those on foreign reserve assets. The higher the interest-rate differential, the larger the costs will be. This fiscal burden can become particularly acute in situations where economies are already under pressure to reduce fiscal deficits and consolidate their public finances. In this sense, accumulation of reserves may become inconsistent with fiscal policy objectives.
Dealing with Macroeconomic Insecurity • 61 Fourth, without sterilizing the monetary effects, large reserve holdings will exert upward pressure on the real exchange rate and domestic prices. This may conflict with other policy objectives, for example, maintaining a competitive exchange rate as part of strategies to achieve diversification of production and export structures, which is critical to long-term growth and employment-generation. While reserves in developing countries have been rising in recent years for self-insurance, there has been considerable diversity regarding their size and sources, which has implications for the costs and risks of holding reserves. Countries with currentaccount surpluses are translating most or all of these surpluses into international reserves at relatively high opportunity cost. Those countries, notably in Latin America, with weak growth and balance of payments are compelled to absorb net capital inflows into low-yielding reserve assets instead of using them for investment. Moreover, some countries still lack selfinsurance and are exposed to sudden stops because large amounts of capital received have been absorbed by the current-account deficits that these inflows helped to generate by appreciating the currency. The high carry cost of official reserves coupled with the risk of exchangerate losses has encouraged alternative investments in higher-yielding foreign securities primarily through sovereign wealth funds (SWFs). These have recently been acquiring equity in developed-country banks hit by the subprime crisis, thereby acting as a force for global stability. However, this also carries high risks. An alternative would be to recycle the resources in the sovereign wealth funds to development financing in support, for example, of infrastructure development. Developing countries own over $4.5 trillion in official reserves and the estimated size of existing sovereign wealth funds assets is at least $3 trillion. An allocation of just 1 per cent of those assets (or the equivalent from the asset returns) on an annual basis would amount to about $75 billion, which is triple the size of annual lending by the World Bank. International development lending capacity could increase probably by more than double that amount if used as laid-in capital for domestic and multilateral development banks, including at the regional level. Crucially, the tendency to accumulate vast amounts of foreign currency reserves in developing countries has its roots in more fundamental deficiencies of the international monetary and reserve system. Improved prudential capital-account regulation, as sketched above, can help reduce the need for and the cost of self-insurance via reserve accumulation. The need for self-insurance can further be reduced with more effective mechanisms for liquidity provisioning and reserve management at the international level, both regionally and multilaterally (see below).
62 • Rob Vos, Diana Alarcón and Mariangela Parra-Lancourt
Multilateral responses In today’s world of increased economic and political interdependence, achieving a broad-based, rapid and sustained growth in incomes and employment involves even more complex policy challenges than in the past. Certainly, the external environment of developing countries has undergone a number of fundamental changes that are unlikely to be reversed in the foreseeable future. Despite these challenges and changes, the mechanisms and institutions in place at the multilateral level have not been adequate to strengthen global economic policymaking. The multilateral arrangements designed at Bretton Woods had not included a global regime for capital movements, given that capital mobility was expected to be limited. However, no such regime has emerged even after the breakdown of these arrangements, and despite the surge in private capital flows. Various codes and standards have been established through international institutions, not just with respect to the financial sector, but also regarding auditing and accounting, data collection, and so on. While these could have benefits over the longer term, they will not necessarily contribute to financial stability, and in many cases they will involve substantial costs. A major outstanding challenge for the multilateral financial institutions is to help developing countries mitigate the damaging effects of volatile capital flows and commodity prices and provide counter-cyclical financing mechanisms to compensate for the inherently pro-cyclical movement of private capital flows. A number of options are available to dampen the procyclicality of capital flows, provide counter-cyclical finance, and thus help create a better environment for sustainable growth.
Multilateral surveillance As a first set of measures, multilateral surveillance mechanisms should be improved to increase the scope for counter-cyclical policies. Surveillance remains a key tool responsibility of IMF in crisis prevention and safeguarding macroeconomic stability. The inability of the Fund to convince major economies to alleviate exploding global financial imbalances such as those built up over the past decade has been a stumbling block in discussions about the reform of the surveillance mechanism. With the revision of the system of surveillance of member States adopted in 2007 (the first major revision of the framework in 30 years), the Fund has put external stability and exchange-rate assessment at the centre of surveillance. The balance-of-payments position of a country should not give rise to disruptive adjustments in exchange rates. This
Dealing with Macroeconomic Insecurity • 63 requires that the underlying current account be broadly in equilibrium and that the capital-account position be such that it does not entail risks of abrupt shifts in capital flows. This requirement may lead the Fund to exert undue pressure on developing countries pursuing export-led growth strategies, by asking them to allow exchange-rate appreciation (and hence stimulate domestic demand) when successful in export growth or attracting foreign investment, and vice versa. For reasons indicated above, developing countries should try to aim at a long-term stability of competitive real exchange rates and move towards counter- rather than pro-cyclical macroeconomic policies. Furthermore, the revised framework does not differentiate among countries in terms of their influence on systematic stability, that is to say, surveillance is not more rigorous for countries issuing major reserve currencies. This is at variance with the intended “even-handedness” of the new decision. To soften swings in the global business cycle and address the global financial imbalances, a framework for internationally concerted macroeconomic policies is needed. In the current context, the recession in the United States economy should be met with a global demand stimulus in order to avert a worldwide downswing (United Nations, 2008a). The below-trend growth in the United States would justify further interest-rate cuts to stimulate the economy, but this may not be sufficient in the current context of a fragile financial sector and a weakened dollar as a result of the prolonged accumulation of external deficits. Global rebalancing would thus require stimulus from other parts of the world, especially in surplus countries like China, the major oil exporters, Japan and parts of Europe. However, acting on their own, countries may be more likely to take a “beggar-thy-neighbour” policy stance. IMF has initiated multilateral consultations to deal with the global imbalances through concerted policy actions. The participants in this dialogue, which include the United States, Japan, the euro area, China and Saudi Arabia, seem to agree on the desirability of correcting the global imbalances without jeopardizing sustained growth and on the need for concerted action to achieve this. They have not yet followed through with any concrete policy actions. It is important that the discussions be broadened to involve more parties, developing countries in particular, and that agreement be reached on multi-year policy adjustment schedules that can be monitored so as to make participants accountable and enhance the likelihood of compliance with agreed concerted action. For the multilateral consultations for policy coordination to work, the perceived legitimacy of the mediator (that is to say, IMF) needs to be enhanced and any doubts that may exist about its impartiality in the process need to be removed. This requires a reform of the voting power and governance structure of IMF in favour of
64 • Rob Vos, Diana Alarcón and Mariangela Parra-Lancourt a better representation of developing countries that is farther-reaching than the piecemeal change agreed upon at the 2008 spring meetings of the Bretton Woods institutions.
Pooling international reserves Second, fundamental reforms of the current international reserve system will be needed to prevent the current constellation of imbalances from reemerging. The use of the national currency of the United States as the main reserve currency implies that for the rest of the world to accumulate reserve assets, the United States needs to run a current-account deficit. This, as we have seen, has enabled developing countries to meet their demand for “selfinsurance” against external shocks by building up vast amounts of dollardenominated official reserves. Over time, however, such a pattern inevitably erodes the value of the dollar, as has been the case since 2002, enhancing the cost to countries for continuing to hold vast amounts of reserves; and this may well cause a run against the dollar, with probable strong destabilizing consequences that will be felt worldwide (United Nations, 2008a). Over time, a market solution to this problem may develop. If a number of competing reserve currencies existed, each of which were to account for a significant share of foreign-reserve portfolios, it would be easier for central banks to alter the composition of their reserves continuously over time and avoid situations where serious doubts would arise regarding the value of a specific reserve currency and the sustainability of the obligations of its issuer. Such a market solution is problematic, however, as it would likely not be smooth and, more likely, would involve a collapse of the dollar, which would disrupt financial markets. The emergence of a new, supranational currency based on the scaling up of special drawing rights (SDRs) is probably the best solution for redesigning the global reserve system in a stable way, but this can only be a long-term option (United Nations, 2005a). Therefore, the more immediate reform would entail promoting an officially backed multi-currency reserve system. This idea should be as compelling as the pursuit of a multilateral trading system. Similar to multilateral trade rules, a well-designed multilateral financial system should create equal conditions for all parties and prevent unfair competition and an asymmetric burden-sharing of exchange-rate adjustments. It should also help to increase stability in the international financial system by reducing the likelihood of a crisis scenario where capital flight out of the major single reserve currency causes potentially far-reaching repercussions throughout the global economy.
Dealing with Macroeconomic Insecurity • 65 A case can also be made for the development of regional reserve funds as a complement to multilateral and national mechanisms of macroeconomic insurance against external shocks. The large currency and financial crises in developing countries since the 1990s have been regional in nature. Countries should have an interest in helping put out a fire in neighbouring countries before it spreads to them. Pooling reserves regionally likely will also reduce costs to individual countries, just as a universal health insurance reduces costs to individuals. Yet, experience with such regional reserve mechanisms is limited. The Latin American Reserve Fund (FLAR), though limited in membership (to the Andean countries and Costa Rica), has had a successful experience in supporting member countries during the debt crisis of the 1980s and during the Asian crisis of the late 1990s. After the East Asian crisis, Japan had proposed the creation of an Asian monetary fund, but this proposal— while well received in the region—was not pursued after objections were presented from outside the region. Instead, initiatives have been developed to improve regional surveillance and create collective liquidity-support mechanisms. The collective liquidity support under the Chiang Mai Initiative agreed in May 2000 involves bilateral currency swap arrangement among the Association of Southeast Asian Nations (ASEAN) member countries plus China, Japan and the Republic of Korea. The effectiveness of the Chiang Mai Initiative in dealing with financial crises has as yet to be tested. This regional framework is complementary to the IMF global facilities and does not negate the need for a crisis-prevention framework for IMF itself.
International financial regulation A third set of measures would include improved international financial regulation to stem capital flow volatility and provide advice in designing appropriate capital controls, including on a counter-cyclical basis. Policymakers in developed countries should pay more attention to preventing harmful effects of financial excesses. Risk assessments by rating agencies are highly pro-cyclical (Persaud, 2000; United Nations, 2005a; International Monetary Fund, 2008) and tend to react to the materialization of risks rather than to their build-up. As indicated above, existing tools are not very effective in addressing the consequences. International regulations on the capital adequacy of banks tend to be pro-cyclical too, requiring lenders to raise more capital only when problems in financial markets have already occurred. The Basel I rules allowed banks to hide risky loans off their balance sheets, eroding effectiveness of regulation even further. The Basel II rules are more
66 • Rob Vos, Diana Alarcón and Mariangela Parra-Lancourt sophisticated in treating risk, but rely heavily on risk assessment models developed by banks themselves, which ignore contagion effects and herding behaviour which are intrinsic to the functioning of financial markets. Both national and international prudential regulatory frameworks need to be modified to focus on the systemic components of risk build-up in financial markets. Furthermore, the improved framework should apply equally to banks and to non-banks in order to be effective. Regulation can be made counter-cyclical by requiring that buffers (capital adequacy) be built up during upswings in order to both restrain excesses and provide a greater cushion against losses in the downswing. Such rules should be international so as to ensure that banks and other financial institutions do not try to evade national requirements by shifting portfolios to offshore holdings.
Enhancing and reforming compensatory financing mechanisms A fourth set of measures would address the need for enhanced provision of emergency financing in response to external shocks, whether to the current or to the capital accounts, so as to ease the burdens of adjustment and reduce the costs of holding large reserve balances. Current mechanisms are limited in coverage, too narrowly defined, or subject to unduly strict conditionality (Griffith-Jones and Ocampo, 2008; United Nations, 2008b). The Supplemental Reserve Facility, established in 1997, provides some collective insurance to countries hit by capital-account crises, but the Facility does not provide enough protection in the case of a typical sudden reversal in capital flows. The Contingent Credit Line was unused and expired in 2003, and little has been done to revitalize the Compensatory Financing Facility, which provided the liquidity to developing countries needed to manage terms-of-trade shocks. IMF has proposed the establishment of a Reserve Augmentation Line as part of the Supplemental Reserve Facility which would provide emergency liquidity to members that have strong macroeconomic policies, a sustainable debt situation and proved credibility in policy implementation, but that are still faced with vulnerabilities with respect to capital-account crises. To overcome the potential stigma associated with the facility, there is a need to enhance the reliability of access to financial resources and reinforce positive signalling to markets. A significant number of emerging market members should qualify, based on the information available from past IMF Article IV consultation reports. Allowing automatic front-loaded drawing of up to 500 per cent of quota, based on simple and transparent guidelines, for eligible members would send a clear signal to private markets that the line is an
Dealing with Macroeconomic Insecurity • 67 insurance facility. If such a mechanism could emulate the lender-of-lastresort functions of central banks, it could reduce the demand for high reserve build-up in developing countries. This in turn could create more policy space in developing countries by offloading pressures towards exchange-rate appreciation. More generally, IMF facilities should be significantly simplified and include more automatic and quicker disbursements proportionate to the scale of the external shocks. Lending on more concessional terms is highly desirable, especially for heavily indebted low-income countries. A new issuance of special drawing rights could be one option for financing a significant increase in the availability of compensatory financing.
Strengthening the multilateral trading system Despite the general acceptance of the benefits of freer trade, the international division of labour is greatly influenced by commercial policies that favour products and markets in which more advanced countries have a dominant position and a competitive edge. In particular, high tariffs, tariff escalation, and subsidies in agriculture and fisheries are applied extensively to products that offer the greatest potential for export diversification in developing countries. The situation in respect of protectionism is no better for industrial products including footwear, clothing and textiles, sectors where many developing countries have competitive advantages. The trading system is also vulnerable to the increasingly volatile working of the international financial system, reversing the original intentions of the post-war multilateral architects and adversely affecting developing-country prospects. A major concern is the destabilizing and deflationary feedbacks among trade and financial flows. These, as discussed earlier, can create impediments to development, including through unstable and misaligned exchange rates and boom-bust cycles, which lead to excessive expansion of investment, production and trade in particular sectors, and eventually come to an end with the collapse of the bubble, resulting in sharp declines in trade flows and prices. Reforming the international financial system should be undertaken with the basic objective of easing the integration of developing countries into the international trading system. The interest of developing countries in the stability of the international financial system is underpinned by the wish that it could allow greater participation in international trade to be combined with the full exploitation of their development potential.
68 • Rob Vos, Diana Alarcón and Mariangela Parra-Lancourt It is also to be expected that the internationalization of production will continue, and that the outsourcing of jobs will influence employment outcomes as emerging economies tap deeper into global supply chains in attempts to create additional job opportunities for their workers. Indeed, there are reasons to expect that this trend will become even more significant. Consequently, as labour markets become more integrated and ever more dependent on large and more footloose multinational enterprises, there may be a need for a “more transparent, coherent and balanced framework” at the global level to address the employment dimensions of globalization.22 Whether or not that materializes, a strategy of lifting all boats (and avoiding beggar-thy-neighbour responses) requires a faster pace of investment in the advanced countries, including, in particular public investment in infrastructure development and investments in low-carbon technologies consistent with commitments to mitigating the adverse impact of climate change. Moreover, a more balanced pattern of domestic demand will be achieved only when rising wages (in line with productivity gains) rather than increased levels of debt provide a solid basis for expanding domestic market demand. The challenges ahead will also require economies to continuously increase their skill and knowledge base in order to successfully integrate themselves into the global production process; to ensure that the net effect of globalized production is not simply the displacement of workers; and to uphold core labour standards in order to ensure decent and productive work for all. Active labour-market policies (including skill development) should be strengthened to better prepare workers for the future job market. When temporary dislocation of workers cannot be avoided, appropriate social protection measures can be introduced to provide worker security. In all cases, the benefits that global production can bring should be properly weighted against the costs, and these costs can be minimized only through active involvement of all the major actors (International Labour Organization, 2005a).
Dealing with Macroeconomic Insecurity • 69
Notes 1 2
3 4 5 6
7 8
9 10 11 12 13
14
See, for further analysis and discussion, Ffrench-Davis (2006); Easterly, Islam and Stiglitz (2001); and Ocampo and Vos (2008). The decomposition methodology consists of disentangling the sources of change in current-account deficits, looking at effects of terms-of-trade changes, growth of world trade, export penetration in world markets, interest-rate shocks, debt accumulation, shifts in official and private transfers, and domestic aggregate demand shifts. The methodology is described in section A of the appendix to the present chapter and is based on an earlier work of Balassa (1981) and the extensions by Avila and Bacha (1987) and FitzGerald and Sarmad (1997). For a recent application and a description of the methodology, see Morley and Vos (2006) and for a more elaborate discussion of the results presented here, see Vos and Parra (2008). Please note that the decomposition methodology describes changes in the currentaccount deficit. This means that in the tables, values with a negative sign refer to positive shocks and those with a positive sign, to adverse shocks. The latter effects are important in the rise of import dependence in Mexico and the Central American countries, for instance. See table A2.B. Net transfers are defined as net financial inflows less related investment income payments to abroad. In the East Asian countries hit by financial crisis in the late 1990s, for example, the boom had been accompanied by a 7 percentage point rise in the average investment ratio and by more than a 16 percentage point decline in the crisis. Investment stagnated in the subsequent recovery, with the result that there was a sharp decline in the investment ratio over the entire cycle (United Nations Conference on Trade and Development, 2000). See Ocampo (2003); United Nations (2006); and Ocampo and Vos (2008). While most regions of the world show greater economic stability and growth, poverty estimates for 100 countries, which account for 93 per cent of the population in lowand middle-income countries, show little progress in terms of poverty reduction, except for China (Chen and Ravallion, 2007). Results are from Latinobarómetro (Opinion Pública Latinoamericana). They can be consulted at: www.latinobarometro.org (accessed 14 September 2007). A complete list of countries included in these surveys and the country reports may be consulted at: https://www.asiabarometer.org/en/findings/General%20findings (accessed 14 September 2007). Results for Africa are based on survey results reported by AFRO barometer for 15 countries in 2002-2003. Full report and results for these surveys can be found at: http:// www.afrobarometer.org/papers/AfropaperNo34.pdf (accessed 14 September 2007). The survey was carried out in April-May 2007 in 30 European countries. See website of Eurobarometer: http://ec.europa.eu/public_opinion/archives/eb/eb67/eb_67_first_ en.pdf (accessed 14 September 2007). The first offshore assembly plant for transistors, and integrated circuits, had been established in Hong Kong Special Administrative Region of China in 1961 by Fairchild Semiconductor of the United States, but intra-European FDI in the 1960s exhibited some of the same characteristics and the implications with respect to North-South trade were already being discussed in the 1970s (see, for example, Streeten (1973)). On the evidence for jobs and wages in these cycles, see United Nations Conference on Trade and Development (2000); International Labour Organization (2004b); and van der Hoeven and Lübker (2006).
70 • Rob Vos, Diana Alarcón and Mariangela Parra-Lancourt 15 For a review of this discussion in the literature, see, for example, Vos (2007); International Labour Organization and World Trade Organization (2007); Spiezia (2004); and De Ferranti and others (2000). 16 This is linked to the employment-generating qualities of FDI; a recent study of the impact of FDI on employment found little impact in low-income countries but a stronger impact in high-income countries (Spiezia, 2004). 17 On the different employment and upgrading patterns in Asia, see United Nations Conference on Trade and Development (1996); and United Nations Industrial Development Organization (2002). A recent study of Chinese exports estimates that two thirds of the value of exports is imported (Institute for International Economics (IIE), 2006). 18 Informal sector activities are characterized by low productivity and earnings. In 2002, the International Labour Organization expanded the concept of the informal sector to extend it to the informal economy so as to account for the existence of precarious employment in the formal sector (Tokman, 2007). 19 The limitations of monetary policy rules with respect to managing asset price-driven booms is discussed by Kindleberger (1995, p. 35), who notes: “When asset and output prices are stable or move in the same direction, or domestic and international goals call for the same policy response, both of which happens much of the time, such rules are supportable. When speculation threatens substantial rises in asset prices, with a possible collapse in asset markets later, and harm to the financial system, or if domestic conditions call for one sort of policy and international goals another, monetary authorities confront a dilemma calling for judgement, not cookbook rules of the game.” 20 This approach is finding considerable support in the Bank for International Settlements (2001, chap. VII); see, also, Borio, Furfine, and Lowe (2001) and White (2006). For further discussion, see Akyüz (2008) and Ocampo, Spiegel and Stiglitz, eds. (forthcoming). 21 The estimate is based on Akyüz (2008, p. 34) who assumes a moderate average rate of a 500 basis points margin between the borrowing rate and the return on reserves. 22 See the discussion in International Labour Organization, 2004b.
Dealing with Macroeconomic Insecurity • 71
Appendix External shocks and domestic adjustment decomposition methodology The decomposition of shifts in current-account balances into different types of external shocks and domestic adjustment mechanisms is based on a methodology originating in the work of Balassa (1981) and subsequent refinements by Avila and Bacha (1987) and FitzGerald and Sarmad (1997). The analysis in chapter II follows the latter specification.
Decomposing the current account The methodology is based on the decomposition of the current-account deficit (D) in any one year (t) between imports of goods and non-factor services (M), net payments of factor services to abroad (V), exports of goods and nonfactor services (E) and unrequited transfers received from abroad (T): Dt = Mt + Vt - Et - Tt
(1)
Mt = Pmt.Jt
(2)
Imports and exports are disaggregated between price indices (Pm, Px) and volumes (J, X) at constant domestic currency prices: Et = Pxt.Xt
Jt = jt.At
(4)
At = Ct + It
(5)
Xt = xt.Wt
(3)
Import volume is linked to real domestic absorption (A)—in other words, consumption (C) plus investment (I) - by a single coefficient (j):
Export volume (X) is linked to world trade volume (W) by an “overall export coefficient” (x) which, in effect, measures export penetration as the country’s share of world trade: (6)
Finally, factor services payments to abroad (V) are broken down into net interest payments to abroad (Vi), net investment income payments to abroad (Vd) and net workers’ remittances from abroad (R). Net interest payments to abroad are defined as the product of the current dollar interest rate (r) and the debt stock (in local currency at the official exchange rate) from the previous year (Ft-1):
72 • Rob Vos, Diana Alarcón and Mariangela Parra-Lancourt Vt = Vit + Vdt – Rt Vit = rt.Ft-1
(7) (8)
It should be recalled that all the coefficients (x, j, r) are in practice derived from these equations, so that the definitional identities always sum to the observed current-account deficit (D). Substituting (2) to (8) in (1) and dividing through by national income at current prices yields the complete decomposition formula: Dt/Yt = pmt.jt(Ct – It)/Zt + rt.Ft-1/Yt + (Vdt – Rt)/Yt - pxt.xt.Wt/Zt – Tt/Yt
(9)
Yt = Pyt.Zt
(10)
(11)
pxt = Pxt/Pyt
(12)
where national income at current prices (Yt) is equal to the product of national income at constant prices (Zt) and the implicit gross national product (GNP) deflator (Pyt) and: pmt = Pmt/Pyt
Finally, a base year or years (s) is chosen in order to separate out the partial derivatives (d) of the variables, which then define the following separate effects: d[Dt/Yt] =
[js.As/Zs]dpmt - [xs.Ws/Zs]dpxt terms-of-trade effect + [Fs-1/Ys]drt
interest-rate shock
- xs.pxs.d[Wt/Zt]
world-trade effect
+ d[(Vdt - Rt - Tt)/Yt]
other external variables
+ rs.d[Ft-1/Yt]
debt accumulation burden
+ js.pms.d[At/Zt]
domestic absorption
- [pxs.Ws/Zs]dxt
export penetration
+ [pms.As/Zs]djt
import replacement
+ interaction terms
(13)
The first three phrases define the exogenous “external shock”; the next two are “debt accumulation burden” and “other external variables”, which respond to both internal and external conditions but are taken as autonomous; and the last three, although defined as “domestic policy response” in the original version of the methodology, should, more appropriately, be termed “domestic adjustment”, since the changes may be caused both by policy intervention and by private adjustment behaviour. The difference between the sum of the
Dealing with Macroeconomic Insecurity • 73 explicitly defined terms and the observed change in the normalized currentaccount deficit is defined as “interaction terms”. These interaction terms are spelled out in full in the FitzGerald-Sarmad version of the methodology. The size of this “residual term” can be rather significant when shocks are large and hence a further decomposition of the residual can provide meaningful additional detail. This is not spelled out here, because it is not part of the analysis in this chapter. Those more specific results can be found in the background paper by Vos and Parra (2008).
Data and country coverage Three main data sources were used for the application of the methodology. National accounts and world trade data were obtained from the United Nations Statistics Division database. Capital flow, debt stock, interest rate and other financial variable data were obtained from the International Monetary Fund (IMF) International Financial Statistics and the World Bank Global Development Finance databases. It is important to clarify that the estimation of the current-account balance (deficit) was based on the national accounts data. Because of statistical discrepancies, those estimates do not necessarily coincide with those reported in the IMF Balance-of-Payments Statistics. For the sake of the comparative analysis, the periods have been harmonized, even though the timing of major shocks may differ from country to country. Because of data limitations, not all developing countries could be covered in the analysis. The analysis in the text covers 21 countries in Latin America and the Caribbean, 12 in Asia, 26 in Africa and 12 small island developing States. The sample of countries by (sub)region is as follows: Latin America and the Caribbean: South America: Argentina, Bolivia, Brazil, Chile, Colombia, Ecuador, Paraguay, Peru, Uruguay and Venezuela (Bolivarian Republic of) Central America: Costa Rica, El Salvador, Guatemala, Honduras, Mexico, Nicaragua and Panama Caribbean: Barbados, Dominican Republic, Jamaica and Trinidad and Tobago Asia: East Asia: China, Malaysia, Philippines and Thailand South Asia: Bangladesh, India, Nepal, Pakistan and Sri Lanka Western Asia: Jordan, Syrian Arab Republic and Turkey
74 • Rob Vos, Diana Alarcón and Mariangela Parra-Lancourt Africa: Northern Africa: Morocco and Tunisia Least developed countries in sub-Saharan Africa: Benin, Burkina Faso, Burundi, Gambia, Lesotho, Madagascar, Malawi, Mali, Niger, Rwanda, Senegal, Sierra Leone, Sudan, Togo and Uganda Other countries in sub-Saharan Africa: Botswana, Cameroon, Congo, Côte d’Ivoire, Gabon, Ghana, Kenya, Nigeria and Swaziland Small island developing states: Small island developing States that are least developed countries: Cape Verde, Maldives, Samoa and Vanuatu Other small island developing States: Belize, Dominica, Grenada, Mauritius, Papua New Guinea, Saint Lucia, Saint Vincent and the Grenadines and Seychelles.