lost its importance and plays only a marginal role now with .... Tab. 1: Continuum of formal and informal relations. Formal-informal continuum ... constant reproduction of social reality. Informal .... such risks in regard to the frequency of their.
Zeitschrift für Wirtschaftsgeographie
Jg. 56 (2012)
Heft 1-2, S.43-57
Markus Keck/Hans-Georg Bohle, Bonn/Wolfgang-Peter Zingel, Heidelberg
Dealing with insecurity
Informal business relations and risk governance among food wholesalers in Dhaka, Bangladesh Abstract: The article investigates underlying social mechanisms that contribute to the remarkable resilience of Dhaka’s food system with a special focus on wholesalers and their informal business networks. A relational approach to the subject matter is elaborated that understands informality as a specific governance mode of business relations that is coined by horizontal power relations, and by the implicit codification, endogenous imposition, and personalized implementation of procedural rules. Empirical evidence is presented from recent fieldwork with rice and fish wholesalers that suggests that informality, in the form of trustworthy relations and social capital, has the potential to foster the traders’ adaptive capacities and thus not only their individual business performance, but also the overall robustness of the urban food system. Keywords: informality, embeddedness, wholesaling, food system, Bangladesh
Introduction
Since the 1970s, Dhaka exhibits unprecedented rates of population growth and spatial expansion that have let it become one of the largest cities worldwide (UN 2008). At a current growth rate of 3.5 % (World Bank 2007), its population increases by an estimated number of 450.000 people every year. Such a rapid urbanization process not only challenges governmental authorities –SIDDIQUI et al. (2000) attested the capital of Bangladesh already at the end of the last century a severe and extensive ‘governance crisis’ (cf. also ISLAM 2005). It also brings up the question of how urban supply and distribution systems currently work under such conditions. In the following this question is examined by taking the food system of Dhaka as a case. Food systems are conceived as a set of activities ranging from production, processing and packaging, over distribution and retailing, to final consumption (ERICKSON 2008, 236). Despite their overwhelming importance, distribution systems, particularly in the urban context, are least understood (BOHLE et al. 2009, 9). As GUYER (1987) has rightly noted, urban food supply and distribution is usually seen as a routine function in all kinds of so-
cieties and taken for granted most of the time by those not directly involved. More often than not, it is under conditions of food crises that urban food supply suddenly becomes “a public issue which can blaze on the political agenda with suddenness, urgency, and often ferocity” (loc.cit. 1). While the persistence of famines in the era of global change has been discussed from manifold and diverse vantage points (DEVEREUX 2007), the question of what social mechanisms exactly shape the resilience of urban food systems during non-famine times widely lacks empirical evidence in the literature. Our study concentrates on the entry points of food into the city, i.e. on the wholesale markets as the major distributional nodes from which food flows into various channels of the urban food system. Empirical data are presented on rice and fish wholesalers’ risk adaptation activities, with a special focus on informality. It is assumed that it is the continuous effort of food traders in general and their constant investment in informal business relations in particular that determines the food system’s overall resilience to a large extent.
44
Zeitschrift für Wirtschaftsgeographie
The food system of Dhaka and its robustness
In 1951, Dhaka had a population of 336,000 (BBS 1951 after ISLAM 2005, 13); today there are roughly 14.2 million (ISLAM 2010, 6): 42 times more inhabitants than before! While the first figure refers to the area of the Dhaka City Corporation (DCC) with an extension of 145 km2, the latter number refers to Dhaka Metropolitan Development Planning Area (DMDP) with a size of 1,528 km2. For all those people who are involved in the megacity’s food system, the rapid urbanization means a challenge in economic, financial and logistical ways. Surprisingly, however, Dhaka’s food supply system has been remarkably resilient over the past 40 years.
In most of South Asia, rice is the major staple of the people, regardless of their economic, social, or ethnic background. On average, the citizens of Dhaka meet their caloric demand to 65 % by cereals. With an average intake of 378 g per head and day, cereals (almost exclusively rice) are the most important basic food items for Dhaka’s and Bangladesh’s population (cf. BBS 2007). Bangladesh’s rice granaries are located in north-western and northern regions of the country (KECK et al. 2008, 29). Rice is grown mostly on small farms of less than 2.5 acres (1 ha). Up to three harvests are possible per year, i.e. aman, boro and aus (AHMED 2001, 2; DOROSH et al. 2004, 14). In the fiscal year 2006/07 55 % of the total rice production stemmed from the boro season, whereas aus lost its importance and plays only a marginal role now with hardly 6 % (FPMU 2009, 1). Bangladesh has been able to more than triple rice (paddy) production since independence in 1971. Domestic production rose from 14.9 million tons in 1971 to 43.1 million tons in 2007 and to a record harvest of 46.9 million tons in 2008 (here and in the following “tons” refer to metric tons). This success was possible only because yields increased from 1,602 kg/ha in 1971 to 3,995 kg/ha in 2008. Today, Bangladesh holds the fourth position among the world’s rice producing countries. But despite all impressive production increases, Bangladesh is still not in a position to feed its population. More than 3 million tons foodgrains had to be imported in 2007: 2.4 million tons wheat, 0.6 million tons (milled) rice and 0.2 million tons maize (FAOSTAT 2010). In 2008 rice imports counted for well over 1 million tons (FAO 2009b, 25).
Heft 1-2 / 2012
Bangladesh’s market liberalization of the 1990s coincided with India’s removal of export restrictions. India’s rice exports increased dramatically from 0.9 million tons in 1994 to 4.9 million tons in 1995. India started dominating the rice imports of her neighbour, thus replacing Thailand as the major source of rice imports to Bangladesh (DOROSH/MURSHID 2004, 109). One has to bear in mind, however, that India had been exporting rice to Bangladesh also before, although illegally and unrecorded. The long and winding border was never effectively controlled and whenever prices differed in the two neighbouring countries, large quantities would be smuggled across. But also after India started to liberalise its foreign trade, she continued to look at her consumers first. In times of high world market prices, India restricts her exports rather than allow her domestic prices to rise. As a consequence, India’s rice exports were reduced from 5 million tons in 2007 (FAO 2008, 32) to 3.57 million tons in 2008 (FAO 2009a, 29) at a time when Bangladesh needed to import. In 2007, floods and the cyclone Sidr brought devastation and much of the paddy crop was destroyed. Consequently, the country had to import large quantities of grain just when world market prices started to rise to unprecedented heights. In late 2007, the price of the major rice exporters showed a pronounced increase with a peak in mid-2008. The price of high quality Thai rice almost quadrupled (!) within a period of one year. From August 2004 until November 2006 it had risen from 250 US$/t to 300 US$/t, while afterwards it jumped up to more than 1,000 US$/t in mid-2008. From the end of 2008 onwards prices fell and remained at a high level of around 600 US$/t (www.indexmundi.com, 20.8.2009). The situation in Dhaka followed this general trend. Here, prices of low quality (coarse) rice, that is mainly consumed by low income groups, more than doubled in the mentioned period, i.e. from 16.50 Bangladesh Taka (BDT) in January 2006 to 35.00 BDT in December 2008. Since the beginning of the year 2009 prices have come down again to a rate of 20.00 BDT to 25.00 BDT (ZINGEL et al. 2011, 305; according to data provided by the Ministry of Agriculture, Department of Agricultural Marketing, Government of the People’s Republic of Bangladesh). Although this hike of world rice prices caused severe distortions of Bangladesh’s food security situation (for a discussion of its impact on
Markus Keck / Hans-Georg Bohle / Wolfgang-Peter Zingel: Dealing with insecurity Dhaka’s urban poor see ZINGEL et al. 2011), there has always been enough food in the city to secure at least a minimum supply for the urban population. Without wanting to downplay the “silent violence” (cf. WATTS 1983) that was caused by the food price hike, it must be mentioned that dispite Dhaka’s rapid growth, countrywide floods, the devastating cyclone Sidr, the global food price hikes, and political upheaval, the food supply and distribution system as a whole remained remarkably stable. What are the social mechanisms that made this system so resilient? To answer the question, our analysis will focus on food wholesalers and their informal business networks. Before moving to the empirical part of this paper, the term of informality has to be clarifyed.
Informality – a relational approach
Although HART (1973) and his colleagues of the International Labour Organization’s employment missions (ILO 1972) were quite positive about the informal sector – noting its efficiency, creativity, and resilience – in subsequent years, the concept was widely interpreted in negative terms. Scholars from many disciplinary backgrounds referred to informality in such a way and assessed it predominantly in terms of demanding, dirty, and dangerous labour conditions, unregistered and partly illegal small-scale ‘survival economies’, or marginal residential areas (for the informal sector debate see CHEN 2006). From this vantage point, megacities are often described as global risk areas (KRAAS 2008), that are menaced by environmental degradation, capacity overload of public distribution systems, marginalization, social exclusion, and prevailing poverty that all together add to the vulnerability of large segments of cities worldwide (KRAAS/ MERTINS 2008). But, despite these sad truths, informality in today’s megacities also bears the inherent potential for adaptive and efficient governance modes and, thus, opportunities for future development that should not be overseen (KRAAS/NITSCHKE 2006). In this article, it is the positive aspects of informality that are aimed to be put back on the agenda of the current debate.
In order to elaborate a relational approach to informality, we draw back on the work of NORTH (1990) on formal and informal institutions. According to NORTH (loc.cit. 3), institu-
45
tions are understood as all kinds of “humanly devised constraints that shape human interaction”, whereas constraints encompass obligations and restrictions, but also rights and privileges (SCOTT 2008, 50). Since human beings live in an uncertain world, they device institutions to bring about some security and to minimize related transaction costs (DE SOYSA/ JÜTTING 2007, 31). While formal institutions are codified political, juridical, and economic rules that are outlined in constitutions, laws, ordinances, and all kinds of legal contracts, that are usually enforced by official entities such as parlaments, courts, bureaucrats, and other legal persons (NORTH 1990, 55 ff.), informal institutions are basically understood as uncodified social norms that are reproduced largely through self-enforcing mechanisms of mutual agreement. As such they comprise customs and habits, obligations and social entitlements, and all kinds of other deontic rules (loc.cit. 43 ff.). According to NORTH (loc.cit. 55), the difference between formal and informal institutions is a matter of degree; both kinds of rules together span a continuum. Consequently, social realities seldomly fit into either the one or the other category. Instead, organizations as the players of the game are rather embedded in an “institutional matrix” that comprise both formal and informal institutions at the same time (loc.cit.1990; 2005). Despite these regulative and normative aspects of formal and informal institutions (cf. SCOTT 2008), SEARLE (1995) convincingly addressed the underlying constitutive element of institutions. Based on collective intentionality, that is the cognitive property of human beings to direct their minds in agreement with each other at specific states of affairs in the world, people turn brute facts into institutional facts and thus produce social reality in accordance to the logical form of “X counts as Y in C”. For instance, the brute fact of a handshake (X) in the context of a market place (C) counts as the closing of a contract (Y), if both partners of this interaction agree upon it. As such, all institutional facts, e.g. money, marriage, business organizations or governments, do indeed exist only because we believe them to exist.
This constitutive feature of institutions is most tricky (ADELSTEIN 2010, 344), especially when considering informal institutions. Since it is a matter of social consensus, first of all, different scales of institutions are to be distinguished, from mutual agreements between two partners
46
Zeitschrift für Wirtschaftsgeographie
Heft 1-2 / 2012
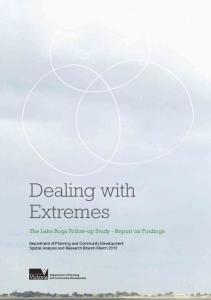
Tab. 1: Continuum of formal and informal relations Formal-informal continuum
Institutions reproduced in social relations
Weak-formal
Market and delegation Culture and ethics
Strong- formal
Weak-informal
Strong-informal
Statutory law and authority
Personal trust and friendship
Source: LI 2007, 230; ETZOLD et al. 2009, 8
in dyadic relationships over widely accepted norms of a society to nearly universalistic values of global humanity. Secondly, institutions must be perceived as being in permanent flux and motion, they constantly arise and vanish as they are the subject of permanent negotiation in contested political arenas (ETZOLD et al. 2009). Taking into account GIDDENS’ (1984) theory of structuration and his elaboration on people’s agency, we can speak of a duality of institutions that constitutes them as both medium and outcome of social practices. With these considerations in mind, we may distinguish with LI (2007) between formality and informality as a specific governance mode of social interaction. Formality refers to procedural rules that are “explicitly prescribed, exogenously imposed, and rigidly enforced by vertical authority powers in a (sic!) universalistic depersonalized process”, while informality refers to institutions that are “implicitly assumed, endogenously embraced, and flexibly enforced by horizontal peer pressures in a particularistic personalized process” (loc.cit. 229). By these criteria, personalized trust, strong social ties, and affective commitment are strong-informal elements, while clan control, religion, culture and ethics are weak-informal. Similarly, law, state policies, legal ownership, and organizational hierarchies are strong-formal, while more or less regularized markets and delegation are weak-formal (see Tab.1). Such a conceptualization, thus, allows to apply informality to both the political and the economic sphere of society. With this differentiation, LI (2007) builds a bridge to the debates on embeddedness (cf. GRANOVETTER 1973, 1985; UZZI 1996, 1997)
Governance and social interaction
Explicit codification, exogenous imposition, as well as rigid and depersonalized implementation of processual rules in hierachical power relations Rigid and depersonalized implementation
Implicit codification, endogenous imposition, as well as flexible and personalized implementation of processual rules in horizontal power relations Flexible and personalized implementation
and social capital (cf. COLEMAN 1990; PUTNAM 1993; PORTES 1998; BURT 2001; BOHLE 2005). With the term of embeddedness, GRANOVETTER (1990, 98; cited after GLÜCKLER 2001, 214) insists on the fact that economic action and outcomes “are affected by actors’ personal [dyadic] relations, and by the structure of the overall network of relations”. In this regard he speaks of relational and structural aspects of embeddedness. LI (2007, 231 ff.) also follows this differentiation and distinguishes between the structure of social relations, expressed as measures of network diversity and density, as well as positions of centrality and rank, and the content of social relations, expressed as measures of dyadic tie strength and access benefits. The focus of this article is on the content of social relations at the scale of dyadic relations and – more precisely – on personalized trust as a “mode of commitment [that] results from strong ties, and also results in relationship commitment behavior” (loc.cit. 236). By following GRANOVETTER (1985, 487), informality is thus approached empirically from the perspective of “concrete, ongoing systems of social relations”. In this regard, social capital is addressed as “an informal access to others’ resources due to social ties” (LI 2007, 231). To sum up, informality is a specific governance mode of social relations in horizontal networks, most prominently expressed in trustworthy ties, that comprise institutional arrangements that are implicitly codified, endogenously imposed, and dealt with in a flexible, personalized and thus particularistic manner. While social ties are the antecedents or prerequisites of relations, social practices are the outcome or consequence of institutions. As
Markus Keck / Hans-Georg Bohle / Wolfgang-Peter Zingel: Dealing with insecurity such, social relations, institutions, and social practice together appear as an interdependent trialectic which is the founding pillar of the constant reproduction of social reality.
Informal relations and risk adaptation of food wholesalers in Dhaka
Food wholesalers in Dhaka As prerequisite for empirical work, the food system of Dhaka was analytically subdivided into three different layers, i.e. (i) the wholesaling of raw food (wholesale markets; single wholesale stores), (ii) the retailing of raw food (kitchen markets; permanent retail shops; supermarkets; semi-permanent and mobile hawkers), and (iii) the sale of cooked food (restaurants; canteens; street food stalls). For the study of the first layer, in total, 42 rice and fish wholesalers were consulted by means of qualitative interviews. In addition, certain questions were deepened with the help of the participatory tool of Venn diagrams (KUMAR 2000), that were undertaken with support of local market associations. Quantitative measures such as mappings and a panel survey were used to broaden the perspective of the study. A standardized random sample survey was conducted with 448 wholesalers (206 rice and 242 fish wholesalers) at 21 wholesale markets (twelve rice and nine fish markets) to test certain hypotheses.1
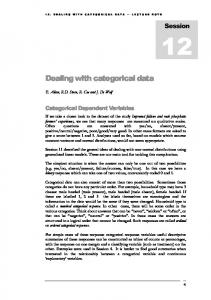
Food wholesalers play a pivotal role within the megaurban food system of Dhaka. They are crucial intermediaries between providers and suppliers on the one hand, and retailers and consumers on the other. The panel survey (2009 and 2010) revealed that, at present, raw food is sold at 87 wholesale markets within the area of Dhaka City Corporation (DCC) (see Fig. 1).2 Out of them, there are 24 rice and 13 fish markets with an estimated total number of 1.700 wholesalers (roughly 900 fish and 800 rice wholesalers) who work in 90 % of the cases as commission agents by order of rice millers, pond owners or intermediary suppliers in rural areas (own survey 2009). Sales amounts of 3,800 kg rice and 800 kg fish on average per day, and monthly expenses of 32.000 Bangladesh Taka (BDT) in the case of rice traders and 63.000 BDT in the case of fish traders on average are substantial compared to those of retailers or street food vendors. These sheer numbers show the traders’ significance
47
within the urban food system. Nevertheless, there are great socioeconomic disparities amid the wholesalers. In terms of business volume, the top 10 % of Dhaka’s fish merchants sell 39 % of the total turnover, while the bottom 10 % sell only 2 %; respective numbers for rice traders are 35 % and 2 % (own survey 2010). Besides few ‘big fishes’ among the wholesalers, large millers and pond owners in rural areas and the emerging supermarkets with their much higher profit margins dominate the food system. Urban stress and business risks Qualitative interviews revealed a variety of insecurities that the merchants face in Dhaka. From the traders’ perspective, we can distinguish between the general stress that is related to social life in the megacity, and particular risks that are related to the business of wholesaling as such. Stress refers to negatively perceived long-term trends such as the accelerated population growth and spatial expansion of Dhaka especially since independence that bestows on customers and merchants ever increasing distances and travel times. In order to keep in step with these developments, wholesalers establish more and more markets at the urban fringe. For the merchants, this is a viable strategy to secure their livelihoods. For the city, these markets are of vital importance. Despite Dhaka’s rapid urbanization and a number of inhabitants that easily exceeds that of most European states, a sufficient number of markets guarantees enough food to be brought to the consumer in an efficient way.
Other types of stress are related to the goverance of the megacity. The most prominent example is the bribing of numerous power brokers, such as patrolling policemen in order to get access to otherwise restricted roads, bureaucrats in order to reduce the time waiting in queues, or criminals that would guarantee market place security in return. Other examples are the governmental markets of the city. Wholesalers need to pay high advance payments in order to be allowed to appropriate and use these public places. Actually, these markets have been established by the municipality for being leased out to the merchants. However, more often than not, there are lessees who lease particular market plots in order to rent them out to the merchants. As such, the public markets of Dhaka are severely subject to rent-seeking
Zeitschrift für Wirtschaftsgeographie
48
Fig. 1: Food wholesale markets in Dhaka City
Heft 1-2 / 2012
Uttara International Airport
4 60
Pallabi 45 48 10 14
50 8
Shah Ali 51 35 58 7
Cantonment 49 12
46 7
44 14
41 5
Gulshan 66 18
40 65
54 >250
56 12
59 60
43 5
Karful
55 4
7 15
62 4
76 20
Mohammadpur
Foodtype
61 3
60 7
Rice
80 23
Fish
84 45
77 8
Tejgaon I/A
Animals / Meat / Eggs
70 30
Dhanmondi 79 >250
81 15
>50 - 250 Tons >1 - 50 Tons
8 30 New Market
10 100
9 40
Settlements in Dhaka Metropolitan Area (2003) Water Bodies Major Roads Railway 0
1
2 km
Kamrangir Char
Kamalapur
28 Train Station 100 Motijheel
24 3
12 15
27 30 29 30 12 22 5 201 Old Dhaka
15 30
Buriganga River
31 17
14 21 40 12
16 60
Draft: M. Keck and S. Raupp Source: Author's own survey 2008-2010 Cartography: G. Storbeck, Department of Geography, University of Bonn
13 63 18 11
23 17 100 30
25 100 33 65 19 30
74 34 73 12 36 34 22 258
26 >250
Kotwali
32 35
72 8
75 11 Sabujbag
Paltan
Shahbag
20 150
11 8
87 30
78 >250
Lalbag 12 Name of Market 45 Number of Wholesale Stores
71 8
Khilgaon
Hazaribag
Daily Turnover in Metric Tons >250 Tons
69 3
82 48 86 5
Pulses / Edible Oil Fruits / Vegetables / Wheat
68 79
67 4
Tejgaon 85 83 35 70
Badda
65 5 64 7
63 4
Military Airport
6 153
57 10 Adabar
1 16
5 2
42 20
53 8
Uttara
47 7
Mirpur
52 9
2 77
3 20
38 100 Sutrapur
37 >250
35 Jatra250 bari
39 35
Markus Keck / Hans-Georg Bohle / Wolfgang-Peter Zingel: Dealing with insecurity 1 Azampur Rail Gate Fish Market 2 Sultan Shah Fish Market 3 Tarun Mahmud Shah Fish Market 4 BDR Wholesale Markt 5 Narda Bazar Rice Market 6, 7 Krishi Market 8 New Market 9 Hazi Sayed Hossain Fruits Market 10 Khalil Sarder Krishi Market 11 Nawabganj Rice Market 12 Lalbag Fort Mor Bazar 13 Swarighat Fish Market 14 - 19 Moulavi Bazar 20 Chowk Bazar 21 Begum Bazar 22, 23 Badamtuli / Babubazar 24 Nazira Bazar 25 Sadar Ghat 26 - 28 Shyam Bazar 29 - 33 Kaptan Bazar 34 - 39 Jatrabari 40 - 43 Kochukhet Market 44 Fakirbari Bazar 45 Mirpur 10 Rice Market 46 - 49 Mirpur 11 Kacha Bazar 50 - 52 Mirpur 1 Kacha Bazar 53 Boro Bazar 54 Gabtoli Cattle Market 55 - 57 Dipjol Bazar 58 Mirpur 2 Bazar 59 Notun Bazar 60, 61 Mohakhali Puran Bazar 62 Modda Badda Bazar 63 - 65 Uttor Badda Bazar 66 Uttor Badda Rice Market 67 Merul Badda Fruits Market 68 Merul Badda Fish Market 69 Rampura Bazar 70 Chowdhuripara Rice Market 71 Sipahibag Hotel Bazar 72 Madertek Bazar 73 Mugdapara Boro Bazar 74 Mugdapara Fish Market 75 Khilgaon Railgate Bazar 76 Govt. Hawkers Market Tejgaon 77 West Nakhal Para Bazar 78 - 86 Kawran Bazar 87 Malibag
49
activities of widely unknown actors who use their social relations to political elites to capitalise on the contested public space in Dhaka.
In terms of business risks, the wholesalers mentioned a range of adverse incidents that can be further differentiated in risks that (i) are related to internal affairs of a wholesaling enterprise, (ii) those that are related to the wholesalers’ suppliers and customers, and (iii) those that are related to the wider context of the megacity. Examples of the first case are the replacement of staff or employees’ accidents. Examples of the last category comprise the theft of goods by outsiders, the robbery on the way to the bank, or the eviction by state authorities. In the following the focus is on the second category of risks that are related to the merchants’ business relations to their suppliers and customers. Based on results of qualitative interviews, in the standardized survey, the traders were asked to appraise a selected number of such risks in regard to the frequency of their occurance, the perceived severity of their impact, and the time and effort that is necessary to cope with them. In the survey it was asked for six particular types of risks, i.e. the default of credit paybacks by customers, late delivery of goods, the delivery of already deteriorated goods, the default of an entire truck load, the default of the delivery of goods by a supplier after the wholesaler paid him in advance, and the closure of the shop for one day due to supply cuts. In relation to each of these risks, four related questions were asked. The first question was: How often did this incident happen in the course of the last three years?. Answers were predefined and ranged from never (that equals a value of 1), over once (2), 2-3 times (3), and 4-5 times (4), to more than 5 times (5). In a second question, it was asked for the perceived severity of the risk impact. It was asked: How do you assess the severity of the impact of this/these event/s on your business performance?. Answers ranged from not severe (1) to extremely severe (4). The third question addressed the recovery time after the specific event occured. It was asked: After this/these event/s, how long did you need to recover from its negative impact? Similar to the questions before, answers were pregiven; at most a week was weighted with 1, a month with 2, several months with 3, a year with 4, and more than a year with 5 points. Eventually, it was asked: After this/these events, how much extra management effort did you need to overcome the
Zeitschrift für Wirtschaftsgeographie
50
Heft 1-2 / 2012
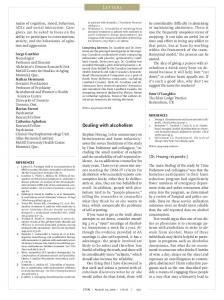
Fig. 2: Rice and fish wholesalers’ susceptibility to business risks
Severity
2.80
2.30
1.80 0.70
B
F
3.30
B E
E F
D
Source: own survey 2010, own draft
2.70
Frequency
A
C
D 1.70
A
Fish Wholesalers (n=242) Rice Wholesalers (n=206)
3.70
problem? Answers ranged from no extra effort (1) to extreme extra effort (4).
The results in Fig. 2 are the mean numbers, for rice and fish wholesalers individually. While the severity and frequency of the mentioned risks are plotted on the x- and y-axis, the recovery time and managerial effort are expressed in a combined way as cost of coping, that is indicated in the diagramme as symbol sizes. This cost of coping is calculated by summing the scores of recovery time (1 to 5) by the scores of managerial effort (1 to 4), thus resulting in an index with a range from 1 to 9. The risk appraisal from the perspective of the food wholesalers generally follows the logic that more frequent shocks are evaluated as much less severe (see Fig. 2). Contrary, less frequent shocks are assessed as being not only much more severe in their impact, they also involve much higher costs of coping for the traders. As such, late delivery of goods is more frequent in its occurance but perceived as less severe in its impact than the supply of already deteriorated goods. As the approximation curves show, fish business in general involves more frequent and
C
A: Default of credit payback by customer B: Default of delivery by supplier despite advance payment C: Late delivery of goods D: Default of truckload E: Shop closure for a day due to supply cuts F: Delivery of deteriorated goods Costs of Coping: 7.05
4.70
2.82
more severe risks in comparison to rice business, a matter that is explained by the different perishability of both goods.
Nevertheless, four business related risks do not fit into this general trend. First of all, the risk of shop closure due to supply cuts equals a frequency of nearly zero in the case of rice traders. The reason behind is, that rice traders usually command godowns that allow rice to be stored at least for some days. Beside that, the risk of customers who do not pay back their credits is evaluated to be not only highly frequent, but also highly severe in its consequence. In case of fish wholesalers, the risk that suppliers do not deliver goods despite the fact that money was already paid in advance, is also assessed in this way. The extraordinary positions of these last three risks in the appraisal are seen as an indication for the general importance they have for the everyday business of the merchants. It is argued that it is especially these financial risks that make informal trustworthy relationsships between the traders and their suppliers and customers so important.
Markus Keck / Hans-Georg Bohle / Wolfgang-Peter Zingel: Dealing with insecurity
Case study: A fish wholesaler and his business relations
Md. Gilgad Gazi is one of more than 270 wholesalers of Five-Star Fish Market at Kawran Bazar in the heart of Dhaka City (market no. 78, Fig. 1). He is in his late 30s and comes from a small village (gram) not far from the city of Narail (in Narail district). Mr. Gazi moved to Dhaka in 1993. He lives together with his wife and children in a small appartment in Mohammadpur, some three kilometers away from his place of work. His father was a salesman for clothing and taught him everything he needed to know about how to manage a store. Mr. Gazi started his business in 1993 with a vending stall at Sonali Market (one of the five compounds of Five-Star Fish Market). He rented a second stall in 1997, and a third one in 2001. In 2007, he had the financial resources to rent three further stalls. Today, he runs six fish vending sites with a total number of 20 employees. Each one is run by a manager, an auctioneer and a weigher. Two helpers rotate between the single stalls to make shure that there is always enough fish to be sold (Venn-diagram of Mr. Gazi in Fig. 3).
From all his employees, Mr. Gazi places one of his managers (1) first, giving him the highest score of importance. During the market hours, this manager is responsible for the same tasks as the other managers. But afterwards, he collects the records and earnings of all other managers for the central book-keeping. As such, he has decisive control over the total income of Mr. Gazi’s six vending sites. The six auctioneers (2) are placed second. From all other workers, they are most important due to their responsibility to realize good sales prices. As he explains, the auctioneers must be very experienced. They need to know the customers and their bargaining behavior, and they need to strategically manage the auctioning by forcing or reducing the pace. In third position are the managers of his remaining five vending sites and his six weighers (3). He underlines that all of them fulfill important tasks. Nonetheless, he evaluates them to be of lower importance compared to the hitherto mentioned employees. Interestingly, the night labourers (4), who are not directly employed by himself but by the market association, are assessed to be more important and socially
51
closer to him than his own labourers (5). He explains this by the fact that the night labourers bear the responsibility for the unloading of the trucks and for the correct allocation of his supplies, a task that they perform independently at night when his workers are not yet at the market. The responsibilities of his own labourers are much less.
After the explanation of the role of his employees, Mr. Gazi turns to his suppliers. He divides his 16 suppliers into three groups. Each group is regarded with different degrees of importance and placed in different distances to himself: “There are times, when I deal only with ten suppliers. But there are also times when I deal with up to 16 suppliers at the same time. Ten of my suppliers are very important for my business. They all deliver fish around the whole year. The others are far less important. I know them, but we do business only from time to time”. In fact, the first (6) and the second (7) group of suppliers are those whom Mr. Gazi provides with advance payments (dadon) that range from 50,000 to 150,000 BDT per year. As return service, they are bound to deliver a certain amount of fish of a specific type in regular intervals. Every New Year, at hal katta, the contracts are anewed. With four of them (6), very close bonds exisit, as they stem from Mr. Gazi’s home district Narail. These four suppliers are those partners with whom he started his business. To share the same home district is seen as the fundamental pillar of these relationships. The relations to the six following suppliers (7) rest on a long joint business history. In fact, Mr. Gazi deals with all of them for ten years and more. These long-lasting business relations and the shared experience are enough proof for the good will of each of them. The remaining six suppliers (8) can be harked back to in times of need or can be dealt with in case of good offers. As Mr. Gazi underlines, these suppliers must be trustworthy as well for fullfilling mutual agreements. Nonetheless, these six latter suppliers are not as familiar to him as his other suppliers are. Mr. Gazi mentions further that there are approximately 250 customers who come to his vending sites every day. He divides his stock of customers into two categories. The first category (10) consists mainly of retail shop owners that can be located easily. All actors of this first category are regular customers. They
Zeitschrift für Wirtschaftsgeographie
52
Heft 1-2 / 2012
Fig. 3: The Venn-diagramme of Mr. Gazi Market Association Suppliers 11
8
Customers 10 Employees
7 6
4
5
9
3
2 16
13 Bank, Moneylender
Lessor, Land Owner 17
14
15
Mr. Gazi
Source: own draft
Business Partner
12
1
Scale of Social Proximity: Close – – – – – – – – – – Distant
are well known to Mr. Gazi and his employees and they usually purchase large quantities of fish. There is usually not much bargaining with these customers, and most of them get fish on credit. The second category (11) consists of all casual customers who are not personally known to Mr. Gazi and with whom no social relation exists. For purchasing fish, they need to participate the auctions. None of them gets fish on credit.
Beside his employees, his suppliers and his customers, Mr. Gazi mentions five more actors or actor groups that are of relevance for his business performance. The first one is his The sentimental and instrumental value of informal relations
The Venn diagramms proved that food wholesalers in Dhaka are embedded in social networks linking them to various actors. The traders maintain ties not only to their suppliers and customers, but also to other wholesalers, to banks and local money lenders, to land lords, local policemen, ward commissioners and municipal bureaucrats. Regarding the organization of supply, it was found that the food traders ba-
Government, Dhaka City Corporation
Relevance for Business Performance: „very low“ – – – – – – – „very high“
brother (12), whom he calls his closest business partner. The second actor is his bank (13) that he needs to transfer money to his suppliers. The third actor group is the DCC (14) and the central government (15), which are relevant for the trade license and tax that need to be paid. Furthermore, there is the market association (9), which runs a credit system. Each wholesaler usually pays a daily amount of 20.00 BDT into a common pool, which is available as credit in case of need. The last actors that Mr. Gazi mentions are the land owners of the market (17) and his lessor (landlord) (16) Source: own interview, 23.2. 2009
sically apply two strategies. On the one hand they maintain long-standing informally governed relations to a limited number of suppliers. On the other hand they maintain relations to a number of socially distant suppliers that are governed by formal arrangements. Even though there are businessmen who pursue either the first or the second strategy, in most cases, both are applied at the same time. Typically, traders are tied to a number of selected and socially close suppliers from whom they regularly receive large portions of goods.
Markus Keck / Hans-Georg Bohle / Wolfgang-Peter Zingel: Dealing with insecurity Additionally, they maintain redundant relations to suppliers that may be harked back to in times of shortages. Even though the intimate suppliers are evaluated as much more important for the merchants’ business performance, it must be mentioned that both goals, a broadening and a deepening of their network relations, are on the businessmen’s agenda.
Given the perishability and seasonality of rice and fish, the traders’ business performance turns out to be to large extent a question of the quality of their networks. While rice can be stored over months, fish rots within few hours if not properly cooled and looses its value within a single day. In the absence of cold stores, fish merchants bear a much higher risk of making losses. This fact makes fish wholesalers even more reliant on strong, trustworthy business relations and ongoing, frictionless supplies. A young shop owner explains the consequences of supply shortfalls: “Sometimes all of my three suppliers can not deliver fish at the same day. This happens around 90 days a year! I can not do business then in these days” (Interview 3.4. 2009).
The way how business is carried out is shaped by the immanent institutions which constitute the relation. The statement of another fish merchant helps to understand the difference between formal and informal relations that holds relevance for their dealings with both suppliers and customers. On the informal relations to his customers he states: “I usually call my permanent customers to sell them their preferred fish. Occasional customers come to me independently. They buy fish only in case they can make profit. I have a pure business relation to them. With my permanent customers this is different. I tell them the purchase price and my expenses. I add my personal profit and tell them the price. And they have to buy [the fish] for that price. Even though other wholesalers here at the market have better prices, they would never buy fish from someone else. Because they have 100 % trust in me!” (Interview 3.4. 2009). This statement should not be misinterpreted in the sense that an attitude of individual profit maximization would dominate only the formal market arrangements. An attitude of profit maximization can also be found in informal relationships. The above mentioned statements show that formal market relationships are mainly
53
maintained to floating customers and to additional, sometimes redundant suppliers. Since both exchange partners hardly know each other, the transaction is agreed upon on the sheer basis of prices. In stark contrast to that, the traders share much more information with their close exchange partners, such as on the conditions of acquisition and the quality of goods, their personal expenses and profit margin. Furthermore, in formal relationships the exchange partners themselves as well as the relations to them are appraised as being of no special value. In fact, the traders have no special word for this kind of relationsships; they are either called pure business relation or it is stated that there would not exist any relation at all. On the contrary, the traders evaluate the relationships to their close partners as being of severe importance. This is expressed in their everyday language as they circumscribe these relations with several words such as trust or faith (biswas), commitment (protigha or protisruti), courage (utshaho) or honesty (dan).
It is argued here that basically two aspects are responsible for this value enhancement of informal relationsships, that is their sentimental and their instrumental significance (cf. LI 2007, 236). In regard to the sentimental dimension of informality, a rather short statement of a rice trader may serve as eye-opener. On the question of how he perceives his five most important suppliers he answered briefly: “To some extent, we are businessmen. But we are also brothers [bhai, which literally means brother, but is generally used to express social proximity]. We are both, brothers and businessmen.” (Interview 7.4. 2009). What is designative in this statement is the fact that the trader does not perceive the two roles of businessman and brother as two opponents. He does not draw a clear cutting line that would separate them. It is rather both roles that are accepted as being constitutive of the relationship. If we consider formal relations as being basically uni-dimensional, as allowing only few scope for abnormal behaviour between, for instance, a seller and a buyer, informal relationships are more diversified and basically multidimensional. By the means of iterative interaction, a pure businessman may thus become gradually a person with various social roles such as family head, friend, neighbour, religious fellow and supplier, each one bringing up another logic and code of conduct. In this context, LI (2007, 239) speaks of the versatility of
54
Zeitschrift für Wirtschaftsgeographie
Heft 1-2 / 2012
Table2:2:Assessment Assessmentofofbusiness Businessrelations, Relations, Wholesalers Tab. riceRice wholesalers “Please consider the relations to your customers and suppliers: What role plays ... for these relations?” In Relations to Regular In Relations to Occasional Difference Business Partners (Mean) Business Partners (Mean) (Mean) The quality of goods Very important (1.00) Very important (1.00) 0.00 To push prices for personal gain Important (2.18) Important (2.32) 0.14 To follow same religion Not important (3.81) Not important (3.96) 0.15 To be relatives Not important (3.60) Not important (3.88) 0.28 To share same home district Not important (3.67) Not important (3.99) 0.32 The reputation of your partner Very important (1.15) Important (1.86) 0.71 To get credit* Important (2.48) Not important (3.60) 1.12 To understand other’s business* Important (2.01) Rather not important (3.48) 1.47 To do each other a favour* Very important (1.47) Rather not important (3.03) 1.56 To help in difficult times* Very important (1.50) Rather not important (3.09) 1.59 The balance of favours* Important (1.59) Rather not important (3.43) 1.84 To give credit* Very important (1.42) Rather not important (3.41) 1.99 Source: survey 2009-2010 Source: Ownown Survey 2009Ͳ2010
Note: The single-factor (one-way) analysis of variance (ANOVA) revealed a significant difference between relations to regular and occasional business partners in regard to the inherent “joint problem solving attitude” with p