Preliminary version of: Brinkman, W.-P., Haakma, R., & Bouwhuis, D.G. (2005). Usability Testing of Interaction Components: Taking the Message Exchange as a Measure of Usability, Computer-Aided Design of User Interfaces IV: Proceedings of the Fifth International Conference on Computer-Aided Design of User Interfaces CADUI '2004 , pp. 159-170, Kluwer Academic, Dordrecht, The Netherlands, 2005.
Chapter # USABILITY TESTING OF INTERACTION COMPONENTS Taking the message exchange as a measure of usability Willem-Paul Brinkman, Reinder Haakma, and Don. G. Bouwhuis Brunel University, Uxbridge, Middlesex, UB8 3PH United Kingdom, email:
[email protected]; Philips Research Laboratories Eindhoven, Prof. Holstlaan 4, 5656 AA Eindhoven, The Netherlands, email:
[email protected]; Technische Universiteit Eindhoven, P.O. box 513, 5600 MB Eindhoven, The Netherlands, email:
[email protected]
Abstract:
Component-based Software Engineering (CBSE) is concerned with the development of systems from reusable parts (components), and the development and maintenance of these parts. This study addresses the issue of usability testing in a CBSE environment, and specifically automatically measuring the usability of different components in a single system. The proposed usability measure is derived from the message exchange between components recorded in a log file. The measure was validated in an experimental evaluation. Four different prototypes of a mobile telephone were subjected to usability tests, in which 40 subjects participated. Results show that the usability of the individual components can be measured, and that they can be priorities on their potential for improvement.
Key words:
Usability testing, Usability evaluation, component-based software engineering, log file analysis, sequential data analysis.
1.
INTRODUCTION
Although Component-Base Software Engineering (CBSE) is becoming more popular, so far, no empirical usability testing methods have been
2
Chapter #
developed that correspond well with this engineering approach. CBSE is a sub-discipline of software engineering, which is primarily concerned with the following three functions: development of software from pre-produced parts; the ability to re-use those parts in other applications; and easy maintenance and customisation of those parts to produce new functions and features [4]. Instead of building an application from scratch, the CBSE approach focuses on building artefacts from already made components (e.g. pop-up menus, radio buttons, and list boxes). The idea behind the engineering concept is that components can easily be re-used in other systems since they are autonomous units, free of the context in which they are deployed. The promise of CBSE is reduced development cost and time since ready-made and self-made components can be used and re-used. The development organisation for CBSE differs from the ‘traditional’ engineering organisation that focused on writing new software and not on composing an application from existing software. Therefore, an empirical usability testing method in which the usability of an individual component can be measured after they are deployed in an application is of course welcome. The usability of components has not yet been measured individually. Several authors [3][6][12] have proposed analysing the user interaction with a component to determine the usability of individual component. To reduce the amount of work and to overcome the low reliability of existing usability evaluation methods [5], employing automatic procedures has been suggested [3] to determine the performance-oriented aspects of usability on the basis of usage logs.
2.
ARCHITECTURE OF INTERACTIVE SYSTEMS
The following three sections introduce the concepts: interaction component, router, and layer. With these concepts it is possible to identify interactive system architectures on which the testing method can be applied, such as for example the CNUCE agent model [10]. The general architecture described here is based on the ideas of the Layered Protocol Theory [12], which decomposes the user-system interaction into different layers that can be designed and analysed separately.
2.1
Interaction components
Interaction components define the elementary units of interactive systems, on which behaviour-based evaluation is possible. An interaction component is a unit within an application that directly or indirectly receives signals from the user. These signals enable the user to change the physical
#. USABILITY TESTING OF INTERACTION COMPONENTS
3
state of the interaction component. Furthermore, the user must be able to perceive or to infer the state of the interaction component. Therefore, an interaction component should provide feedback. Without the possibility of perceiving the state, users cannot separate the component from the whole system and are not able to control it. Without the ability to control the feedback, users’ behaviour is aimless.
2.2
Routers
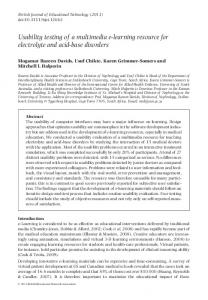
Another element in the general architecture is the Router. Routers are binding elements that direct the communication flow between interaction components, and do not have to have an own state. This component’s only function may be merging the messages of two lower-level interaction components into a message for the high-level interaction component or vice versa. Alarm time
Current time
Set alarm time
:
Alarm time set
a.m.
Mode
Mode
Hour
Minute
On/ Off Minutes set
Hours set
Set minutes Set hours
On/off symbol Press
On/off button
Press
Mode button
Press
Hour button
Clock/bell symbol
Hours
Hour digits
Press
Minute button Minute digits
User
Alarm clock
Figure #-1. Front and component structure of an alarm clock.
Minutes
4
2.3
Chapter #
Layers
The points where input and output of different interaction components are connected demarcate the border between layers. An interaction component operates on a higher-level layer than another interaction component, when the higher-level interaction component receives its user’s messages from the other interaction component. With the definition of interaction components, routers, and layers it is possible to describe the architecture of a regular alarm clock to illustrate these concepts. With this alarm clock, users can set the alarm time by setting the clock in the right mode, changing the hours and minutes digits, and finally activating the alarm. Figure 1 shows the interaction components involved. The Hour and Minute interaction components are located on the lowest-level layer, where they manage the state of the hour and minute digits. The Mode interaction component is placed on the middle-level layer. The component is responsible for the mode of the alarm clock, and consequently whether the current or the alarm time is visible or set. To indicate that the alarm time is displayed, a small icon of a bell is shown in the top-left corner of the display. The Alarm Time and Current Time interaction components, which keep the corresponding times, make up the top-level layer in the architecture. The Alarm Time interaction component shows a small icon in the top-right corner of the display to indicate whether the alarm is activated or not.
3.
THE TESTING METHOD
3.1
Test procedure
The test procedure of the testing method roughly corresponds to the normal procedure of a usability test. Subjects are observed while they perform a task with the system. The task is finished once subjects attain a specific goal that would require them to alter the state of the interaction component under investigation. In advance, subjects are instructed to act as quickly as possible to accomplish the given goal. As subjects perform the task, messages sent to the various interaction components are recorded in a log file. Once they reach the goal, the recording stops.
3.2
Component-specific usability measure
The number of messages received by a component is a powerful measure to study the difference in usability between two versions of a component [2]. This raw measure forms the basis for a usability measure that can be applied
#. USABILITY TESTING OF INTERACTION COMPONENTS
5
on different components in a single system. Instead of a direct comparison, the proposed method compares the performance of an (fictional) ideal user with that of real users. The method looks at the performance of a component as if higher-level components operated optimally. This way the inefficiency of higher-level component is compensated for. In this context, inefficiency means that a component requests more lower-level messages than optimal required. The method assumes that lower-level components only sent messages upwards intended by users (no effectiveness problem) and messages sent by an ideal user are also sent by real users. Valuable information for evaluators is which interaction components should be changed to create the largest usability improvement of the whole system, i.e. impact assessment and effort allocation [7]. The impact an interaction component has on the overall performance can be estimated by assigning an effort value to each message received. These effort values are based on the effort value of the lowest-level messages that are linked to higher-level messages. At the lowest-level layer, weight factors of an arbitrary unit are assigned to the messages, which present the user effort value to send a single message. This can be a number for each keystroke or for the time users need to make an elementary message. The users' effort, to make these elementary actions, is regarded as similar throughout task execution. In the next section, an example is worked out to explain the performance evaluation in detail. 3.2.1
Example
Imagine a drawing application. A circle and polygon are drawn. Now, the task is to change the circle’s colour into red and remove its black outline. If users perform the task optimally, they first select the circle by clicking on it, and then they open the Right Mouse Button Menu (RMBM) and choose the option Properties. The application comes up with a property window, where the users select the red box in the Fill tab sheet (Figure 2). They also check the No Line check box on the Outline tab sheet. Finally, the users click on the Ok button of the property window and the circle changes accordingly. Figure 3 presents the message exchange between the relevant interaction components of the drawing application when the task is conducted in this optimal way. In this example, (imaginary) recordings are also made of the behaviour of a (imaginary) real user who has three problems: first, with selecting an object; second, with setting the right tab sheet; and third, with distinguishing a circle from a polygon. The real user selects objects with a selection window instead of clicking on the objects themselves. Furthermore, the real user takes the polygon for a circle, and consequently makes two selections.
6
Chapter #
After the circle is selected, the real user searches for the right tab sheet, starting with General, then Detail and ending with the right tab sheet. Figure 4 shows the message exchange between the same interaction components as before, but now for the real user.
Figure #-2. Property window for setting the fill colour of the selected circle.
3.2.2
Analysis of the example
In this example, a value 1 is assigned to all Click messages (Figure 3 and 4). After effort values are assigned to the lowest-level messages, the effort values are calculated for the messages sent upwards. The effort value of a message sent upwards is, in principle, the sum of the effort values of the messages received between this and the previous message sent upwards. Figure 3 gives the effort values for the messages sent upwards in the case of the ideal user. Take for example the Call message sent upwards by the RMBM at event 4. Two Click messages, each having an effort value 1, were received before this message was sent (see event 3); therefore, an effort value of 2 is assigned to this message. The calculation starts at the lowestlevel layer and works its way upwards. This means that first the effort value for the Selection and RMBM interaction components is calculated, followed by the effort value for the messages sent upwards by the Properties and finally by the Visual Drawing Objects (VDO) interaction component. If messages are sent upwards through actual task execution (the real user), the inefficiency of lower-levels is removed from the effort value. The
#. USABILITY TESTING OF INTERACTION COMPONENTS
7
effort values of the messages that are also sent upwards in optimal task performance receive a similar effort value as if these messages are sent upwards in optimal task performance. If another type of message or a message with another effect is sent upwards compared to that in optimal task performance, it will receive the sum of the effort values of messages received. However, if this message is of the same type as messages sent upwards in optimal task performance, it may not exceed the maximum optimal effort value of messages of this type. For example, the Select messages, sent upwards by the Selector in Figure 4 at event 2 and 4, have an effort value of 1 because the ideal user made a Select message that has the same effect with only an effort value of 1. Set object {8} 7 {8}
1 message Visual Drawing Objects {8} Set {7} 6 {7}
1 message
Select {1} 2 1 message
Properties
{1} {7} Call
{2} 4
1 message {2}
Right Mouse Button Menu
Selection
Click {1} 1 1 message
{1}
Click Click Click Click Click
{1} {1} {1} {1} {1}
5 messages
{5}
5
Click {1} Click {1} 2 messages
3
{2}
Figure #-3. Message exchange between the components of the drawing application in the case of optimal task execution (ideal user). Effort values are given within brackets. The numbers in the black circles give the event sequence of the task execution.
The total effort for the control of an interaction component is the sum of the effort values of the messages received (third and fourth column of Table 1), which, in the case of real users, is later on corrected for the inefficiencies of a higher-level. Without correction, the total effort still may include inefficient high-level demands, which should not be charged to the interaction component. Therefore, the analysis only looks at the number of messages sent upwards that are required to fulfil the optimal request of higher-level layers. This corrected value is called the user effort and is also given in Table 1. It is calculated by first taking the total effort in the case of the real user (fourth column) and dividing it by the number of messages the
8
Chapter #
real user sent upwards (second column); and second, by multiplying the result by the number of messages the ideal user sent upwards (first column). This correction assumes that the same number of messages have to be received to send a message upwards again, which is the case when the state of the interaction component is reset after a message is sent upwards. Set object {8} 9 {8}
1 message Visual Drawing Objects {9} Set {7} 8 1 message Select {1} 2 Select {1} 4 2 messages
{7}
Properties
{2}
{9}
Selection Click Click Click Click
{1} {1} {1} {1}
4 messages
{4}
1 3
Call
{2} 6
1 message
{2}
{1} Click {1} Click {1} Click {1} 7 Click {1} Click Click {1} {1} Click 7 messages
Right Mouse Button Menu
{7}
Click {1} Click {1} 2 messages
5
{2}
Figure #-4. Message exchange between the components of the drawing application in the case of observed task execution (real user). Effort values are given within brackets. The numbers in the black circles give the event sequence of the task execution.
Table #-1. The extra user effort and the parameters to calculated it. Sent upwards Total effort Optimal Observed Optimal Observed Properties 1 1 7 9 VBO 1 1 8 9 Selection 1 2 1 4 RMBM 1 1 2 2
User effort 9 9 2 2
Extra 2 1 1 0
The extra user effort is a measure of the effort difference when a real user or an ideal user controls an interaction component. The extra user effort is the result of the subtraction of the total effort made by the ideal user from the user effort made by the real user. Table 1 shows the extra user effort per interaction component. The Selection interaction component is charged with 1 extra keystroke. Although the real user made an inefficient selection two times, only the average extra user effort per selection is taken into account because the repetition is attributed to inefficiency of higher-level layers. The
#. USABILITY TESTING OF INTERACTION COMPONENTS
9
RMBM interaction component, with its optimal performance, is subsequently charged with no extra user effort. The Properties interaction component is charged with two extra keystrokes; the two keystrokes for searching the right tab sheet. The VDO interaction component is charged with only one extra keystroke; the one keystroke, an ideal user would need to select the polygon. Finally, ordering the interaction components by their extra user effort creates the priority list of the most effective improvements; putting the Properties component on top of the list.
4.
EXPERIMENTAL VALIDATION
An experiment was conducted to study the method and to validate the proposed component-specific usability measure. The experiment compared prototypes with variations in their usability. The use of predefined usability variations had to emphasise the validity of the usability measures. All usability variations addressed the complexity of dialogue structures that can be understood in terms of Cognitive Complexity Theory (CCT) [8]. This theory holds that the cognitive complexity increases when users have to learn more rules.
4.1
Prototypes
A mobile telephone was chosen for the experiment because of its relatively complex user interface architecture. Two interaction components of a mobile telephone were manipulated. They were responsible for the way subjects could activate functions in the telephone (Function Selector), and send text messages (Send Text Message). For each of these two interaction components two versions were designed. In one version of the Function Selector (FS), the menu was relatively broad but shallow, i.e. all eight options available within one stratum. In the other version, the menu was relatively narrow but deep, i.e. a binary tree of three strata. Users tend to be faster and make fewer errors in finding a target in broad menus than in deep menus [11]. In terms of CCT, the deep menu structure requires subjects to learn more rules to make the correct choices when going through the deep menu structure. In the more usable version (simple version) of the Send Text Message (STM) component, the component guided subjects through the required steps. The less usable version (complex version) left the sequence of steps up to the subjects. All these options were presented as icons that forced the subjects to learn the icon-option mapping rules in the complex version. Furthermore, they also had to learn in which order to choose the options. Combining these versions led to four different mobile telephone
10
Chapter #
prototypes. The experimental environment was programmed in Delphi 5, and included PC simulations of all mobile telephone prototypes and a recording mechanism to capture the message exchange between the interaction components [1].
4.2
Procedure and Subjects
All 40 participating subjects were students of Technische Universiteit Eindhoven. None of them used a mobile telephone on a daily or weekly basis. The kinds of tasks they had to perform with the mobile telephone were calling to someone’s voice-mail system; adding a person’s name and number to the phone’s address list; and sending a text message. The application automatically assigned the subjects in a random order to a prototype. At the end of the experiment, subjects were asked to evaluate the mobile telephone and the two components with a questionnaire on the computer. The computer gave the questions in a random order. The questions addressed both the ease-of-use and satisfaction of the overall mobile phone, and the FS and STM components separately [1]. After the experiment, the subjects received NLG 22.50 (roughly €10) for their participation.
4.3
Results
The extra user effort was calculated for the two interaction components per prototype over all types of tasks (Table 2). For each prototype a multivariate analysis of variance was conducted on the extra user effort. The analyses took the components as an independent within-subject variable. The results revealed a significant difference in prototype 2, which was equipped with the narrow/deep version of the FS component and the simple version of the STM component. As expected, designers confronted with this prototype should focus their attention on the FS component rather than on the STM component. With prototype 3, designers should focus on the STM component, although the analysis failed to reach a significant level. The ability to say something about the accuracy of the extra user effort measurement is limited. For the versions of the STM interaction component, a difference of 29 keystrokes was found in the extra user effort, whereas a difference of 64 keystrokes was found in the overall number of extra keystrokes. A relative similar deviation was found for the difference between the versions of the FS component, 55 versus 105 keystrokes. An explanation for the difference between extra keystrokes and extra user effort is that the extra keystrokes measure also includes the additional effect usability problems had on other components with usability problems.
#. USABILITY TESTING OF INTERACTION COMPONENTS
11
After the multivariate analyses, the validity of extra user effort measure was examined by correlating it with other measures obtained in the experiment. Table 3 shows the partial correlations between these measures and the extra user effort to control the FS and the STM components. All correlations were controlled for the versions of the other interaction component. Only significant partial correlations, in the expected direction, were found; except for the correlations between the mobile telephone satisfaction and extra user effort for STM component. The results validate the extra user effort measure as a component-specific usability measure. Table #-2. Results of multivariate analyses of variance on the extra user effort for prototypes with the components as independent within-subject variable. Extra effort df Versions Prototype components FS STM Hyp. Err. F Simple 1 Broad/shallow 0 2.2 1 9 1.34 2 Narrow/deep 47.7 13.6 1 9 34.91 Complex 3 Broad/shallow 0 33.6 1 9 4.85 4 Narrow/deep 61.6 39.5 1 9 1.78
the four
p 0.277