Usability Testing of Mobile Devices: A Comparison of Three Approaches Adriana Holtz Betiol1 and Walter de Abreu Cybis2 1
Department of Computer Science, Pontifical Catholic University of Paraná, Brazil
[email protected] 2 Department of Computer Science, Federal University of Santa Catarina, Brazil
[email protected]
Abstract. This paper describes a study that compares the results of usability testing of mobile interfaces based on three different evaluation approaches: (i) using a computer-based mobile phone emulator inside the laboratory (ii) using a mobile phone inside the laboratory (iii) using a mobile phone linked to a wireless camera in the field. The results regarding user performance and usability problem identification showed the existence of more similarities than significant differences between the results of the three evaluation contexts. Moreover, in the simplest evaluation context of the emulator it was possible to identify a large percentage of the overall set of usability problems found.
1 Introduction The usability of the mobile devices and their applications is a key factor for the success of mobile computing. The needs and characteristics of the mobile user, the usage context of the mobile devices, the characteristics of the applications and the physical limitations of these equipments are factors which can influence the interaction and should be considered in the design of the interfaces, as well as in the usability evaluation. An important issue currently presented in the area of Human-Computer Interaction addresses the importance of the context of use of mobile devices in their usability evaluation, so that the traditional HCI evaluation criteria and methods should be reconsidered in order to meet the requirements of mobile interaction. Johnson [1] addresses the difficulties in reproducing inside the lab all the elements which belong to a context so dynamic and diversified as that of the mobile user. Researchers like [2,3,4] highlighted the importance of measuring usability outside the lab, in more realistic situations. As Brewster [4] suggests “it is important that mobile devices are not tested only in the lab as many potential problems may be missed”. Some authors [5] also state that the use of mobile device emulators on a desktop computer cannot provide reliable indications for the usability measured. However, we don’t have a good understanding about how usability measures done inside the lab differ from similar studies in the field. From these findings, this research was proposed to compare the results of usability testing of mobile interfaces based on three commonly used setups, inside and outside the lab. M.F. Costabile and F. Paternò (Eds.): INTERACT 2005, LNCS 3585, pp. 470 – 481, 2005. © IFIP International Federation for Information Processing 2005
Usability Testing of Mobile Devices: A Comparison of Three Approaches
471
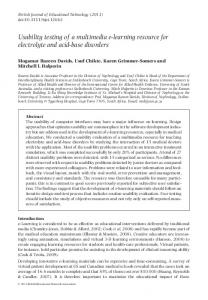
2 Experimental Design The usability tests were conducted for the purpose of evaluating the overall usability of the user interface of a Wireless Application Protocol (WAP) portal accessed through a mobile phone. This portal offers access to various typical mobile services such as leisure information, news and e-mail. All these services may be consulted anytime, anywhere, provided the user is in the area of coverage of the mobile phone operator. There is no pre-requisite necessary to access this service and any person who owns a mobile phone compatible with the WAP technology can be considered a potential user. Three distinct approaches were defined to conduct the usability tests based on the evaluation contexts. These contexts differed only in three aspects: the equipment used for navigation on the WAP portal (mobile phone or emulator), the location for conducting the tests (usability lab or field) and the equipment used to register the interaction (computer, document camera or wireless camera). The remaining components of the evaluation contexts such as criteria for choice of participants, tasks, measures and metrics of usability were exactly the same for the three approaches. A total of 36 participants (18 men, 18 women) between 21 and 40 years, with different educational backgrounds and professions were split into three groups of 12 persons, so each one of the users participated in one only usability test. All participants were mobile phone users with at least one year of computer experience, but none of them had used WAP or the mobile phone model used in this study. 2.1 Context of Evaluation 1: In the Laboratory, Using an Emulator The first group performed the usability tests inside the lab using a computer-based emulator. Even though the emulator permitted the use of a keyboard, the participant was instructed to use only the mouse. The entry of data was only possible by clicking on the keys of the mobile phone simulation on the computer screen. All the user interactions with the interface and verbal comments were recorded in videotape. There were no cameras filming the participant, the image recorded on tape was only that of the computer screen. The evaluator was in the same room as the participant observing the interaction on the TV screen. From now on this context will be referred as “emulator context”. 2.2 Context of Evaluation 2: In the Laboratory, Using a Mobile Phone and a Document Camera The second group performed the usability tests inside the lab using a mobile phone fixed to a tripod which was positioned under a document camera. The tripod was developed with dimensions that enabled the users to handle the phone in the palm of their hands and touch the keypad with their thumbs (Fig. 1). However, they could not move the tripod from its initial position, so the mobile phone could not leave the visualisation area of the camera. The degrees of freedom of the supporting base were also carefully defined to enable the best angle of view for the user and for recording the phone display and keypad.
472
A.H. Betiol and W. de Abreu Cybis
Fig. 1. Tripod for fastening the mobile phone
All the user interactions with the interface and verbal comments were recorded in videotape. There were no cameras filming the participant, the image recorded on the tape was only that of the mobile device. The evaluator was in the same room as the participant observing the interaction on the TV screen. From now on this context will be referred as “document camera context”. 2.3 Context of Evaluation 3: Outside the Laboratory, Using a Mobile Phone and a Wireless Camera The third group performed the interaction tests outside the lab, in a busy and distracting environment that reproduced several possible locations pertaining to the usage context of this type of equipment, such as airports, shops, restaurants, etc. The system which was designed to record the interaction in an open environment was developed specially for this research inspired by the work from Nyysonen [6]. The system consisted of a wireless mini-camera (Fig.2) with a built-in microphone that communicated with a receiver on a portable digital video camera (Fig.3). The camera was fixed to a support so its movements would accompany the movements of the mobile phone. The support had several degrees of freedom of movement, which enabled the camera several different adjustments to obtain the image of the phone desired without hampering the users view and quality of filming.
Fig. 2. Wireless mini-camera system
Fig. 3. Reception and recording system
The participant could operate the mobile device normally. This condition contributed with greater fidelity to the reproduction of the real usage context. The evaluator was seated close to the participant observing the interaction through the
Usability Testing of Mobile Devices: A Comparison of Three Approaches
473
video camera screen. There were no cameras filming the participant. The image recorded on tape was only that of the mobile phone. From now on this context will be referred as “wireless camera context”. 2.4 The Emulator and the Mobile Phone Several models of mobile phones and various emulators were studied with the purpose of finding the pair that presented the greatest number of similarities in terms of: disposition and functionalities of the keys and the visualisation of the application. Based on these criteria, an Openwave [7] emulator was selected, with a standard phone mask. The mobile phone model selected was the BD4000 by LG [8] operating in the 2.5G network in the CDMA 1X technology. The disposition and functionalities of the keys for data entry, selection and navigation were rigorously the same in the emulator and the mobile phone. The texts and menus of application were presented on the display following the same disposition. However, there were two main differences in relation to the two displays: the number of lines on the display and the scroll bar. The emulator presented two more lines of text on the display in relation to the mobile phone and the indication of the scroll bar for text that appeared on the right-hand side of the mobile phone did not exist in the emulator. Table 1. Description of tasks #
1
2
3
4
5
6
7
DESCRIPTION You are in a restaurant having dinner with friends and you’re talking about soccer. One of your friends cheers for “Internacional” and would very much like to know when his team is next playing in the Brazilian championship. You volunteer to find this information. Your objective: Find the date, time and opponent in the next “Internacional” game in the Brazilian soccer championship. You are seated in the departure lounge of the airport awaiting your flight to Rio de Janeiro. You would like to go to the theatre tonight. Your objective: Find the names of all the plays on show tonight in the theatres of Rio de Janeiro. You are participating in an important business meeting when a colleague asks you for updated information on the dollar rate. Your objective: Find the value of the commercial dollar, the percentage of increase or decrease and the date and time that this information was referred to. You are with a client visiting a firm in the Cabral district. You do not know this district very well and would like to know which are the options of restaurants so that you can have lunch/dinner now. Your objective: Find the name, address and opening hours of a restaurant in the Cabral district. You notice there is a voice message in your mobile phone. It is from a friend of yours living in New York. He asks you to call back at a certain phone number still today at 9:00 pm punctually. You are not very sure of the difference in time between Curitiba and New York, and would like to know at what time you should make this call. Your objective: Find the time in New York now. I called you yesterday and said that I would send you an e-mail with the information on our meeting. You did not have time to read your e-mails in the computer today. Now you’re out of the office and remember that you need to read this e-mail because the meeting may have been set for today. Your objective: Find the e-mail that I sent you, read it through, checking what time, date and where our meeting will be held. Your e-mail is:
[email protected] Your password is: senha You read the e-mail and are in agreement with the date and time appointed. You now need to confirm your presence at the meeting. Your objective: Reply to this e-mail with the text: Ok, confirmed!
474
A.H. Betiol and W. de Abreu Cybis
2.5 Procedure The usability tests were rotated among the contexts of evaluation and performed during two weeks. Each usability test took an average of 1 1/2 hour and rigorously followed the same test script. After being introduced to the test environment the participant was requested to fill out a screening questionnaire. He was instructed on the main functionalities of the mobile phone or emulator and also asked to familiarise himself with the basic commands of WAP navigation. The user was asked to accomplish seven independent tasks concerning information search over the WAP portal (Table 1). The evaluator did not interfere in the user’s performance. He took notes of verbal comments and reactions of the participant. At the end of each task a quick interview was held with the participant to clarify possible doubts with regard to the interaction incidents observed. The participant was also requested to fill out the satisfaction and workload questionnaires. A debriefing was held to obtain general comments on the evaluation and to clarify possible difficulties that the participant may have faced during the test. The sessions generated a total of 32 hours of videotapes that were analysed with the following purposes: measure the total task time; analyse the task outputs to determine whether the task goals where achieved; identify the interaction problems faced by the user, classifying them by degree of severity. 2.6 Criteria for Comparison The results were compared according to two criteria: (i) the user performance in each context and (ii) the context performance in identifying usability problems. The definition of usability for mobile devices adopted in this study was that of ISO 9241-11 [9]: “The extent to which a product can be used by specified users to achieve specified goals with effectiveness, efficiency and satisfaction in a specified context of use”. Once the usability components (effectiveness, efficiency and satisfaction) were determined by this definition, the Performance Measurement Method [10], integrating part of the MUSiC project [11], was used to establish the definitions and methods of measurement of these components. As well as the differences between equipment used to navigation (emulator X mobile phone) and to register the interaction (computer X document camera X wireless camera), the users were exposed to different environments (inside the lab X outside the lab) and situations (quiet location X noisy and busy location). So it was also decided to evaluate the workload perceived by the participants in each of the three evaluation contexts using the NASA Task Load Index [12]. The context performance in identifying usability problems was compared in terms of the number of usability problems identified, the severity of these problems and the number of hours spent in performing the evaluations. To be able to identify the capacity of the context in identifying more serious problems, to each usability problem identified a degree of severity was attributed. The degree of severity was defined as a function of two factors: the impact that the problem caused on the user and the frequency with which it occurred [13]. The impact was defined as a scale of three points: impact 1: the user becomes a little confused or
Usability Testing of Mobile Devices: A Comparison of Three Approaches
475
disappointed and hesitates briefly; impact 2: the user makes an error, which he manages to recover; impact 3: the user makes an error which he does not manage to recover, making it impossible for him to complete the task with success [14]. The frequency was defined as a result of the number of users that faced the same problem during the interaction. As a cost measurement, we considered the hours spent by the evaluator in the performance of usability tests and in the analysis of the videotapes. In this way it was possible to determine a benefit/cost ratio for each context, which would indicate the severity of problems found per hour of evaluation.
3 Results One-factor ANOVA tests were conducted across the three evaluation contexts results. Table 2 presents a summary of the comparison of usability results measured in the three evaluation contexts, indicating where a statistically significant difference occurred. Table 2. Summary of statistically differences in usability measured Document Camera X Emulator Task 1 2 3 4 5 6 7 1 Effectiveness X = = = = = = = = X X = X X = = Efficiency Satisfaction X = Workload X = lower results in the document camera context
Document Camera X Wireless Camera 2 = X
3 = =
Task 4 5 = = = = X =
6 = =
Emulator X Wireless Camera 7 = =
Task 1 2 3 4 5 6 7 = = = = = = = = = = = = = = = =
3.1 Task Effectiveness The statistical analysis revealed there was no difference in effectiveness measured in the three evaluation contexts, with exception of task 1 which presented a smaller effectiveness in the document camera context in comparison with the emulator context (α=5%, F(3,32) = 5.28, p=0.01).
Fig. 4. Task 1 screens on the emulator and mobile phone
To understand better these results it is necessary to analyse task 1 content. This task had as objectives to find the opponent, the date and time of the next soccer game
476
A.H. Betiol and W. de Abreu Cybis
which the “Internacional-RS” team would play in the Brazilian Soccer Championship. All participants managed to find the correct card where this information was found and hence the effectiveness value was determined in view of the quantity of information found. The quantity was calculated as 30% for the correct opponent, 35% for the correct date, and 35% for the correct time. Fig. 4 illustrates two examples of screens for this task in the emulator and the mobile phone. All participants answered the correct opponent (Guarani-SP) however the majority got confused with the date. On reading the information the participants thought that the date would be 21/09. This is the date which appears close to this game information but it refers to the next games set (no dot line was provided to separate information sets). In fact the correct date was 20/09, which was no longer visible on the screen. The same confusion happened with the time of the game when many people thought it would be at 16.00h, when in reality the correct time was 18.00h. In the emulator context 50% of the participants found all the correct information whereas the other 50% got the correct opponent and time, but failed on the date. In the document camera context only 8.3% (1 participant) managed to find all the correct information, 33.3% got the correct opponent and time, while 58.3% got only the correct opponent. In the wireless camera context 41.6% found all the correct information, 8.3% got the correct opponent and time, while 50% got only the opponent right. These results could be attributed to the difference that existed between the emulator and mobile phone user interface. On the smaller phone display the participant could have greater difficulty in identifying the correct date and time. However this difference between sizes of screens did not cause a significant difference in averages in the emulator and wireless camera contexts. In the wireless camera and document camera contexts, where the participants visualised the same mobile phone display, there was also no significant difference between the averages. The results for effectiveness also showed that in the document camera context users gave up completing the tasks with greater frequency in comparison with the other two evaluation contexts. 3.2 User Efficiency The averages of user efficiency for tasks 1, 4 and 7 presented no statistically difference in the three evaluation contexts (α=5%, F(3,32)=1.58, p=0.22; F(3,32)=1.33, p=0.27; F(3,32)=3.28, p=0.046 respectively). The user efficiency was lower in the document camera context in relation to the emulator context for tasks 2, 3, 5 and 6 (α=5%, F(3,32)=9.91, p=0.0004; F(3,32)=9.01, p=0.0007;F(3,32)=4.27, p=0.022; F(3,32)=3.62, p=0.0378 respectively). Efficiency was defined as the ratio effectiveness/task time. Since the effectiveness for tasks 2, 3 and 6 was 100% in the three contexts, we may conclude that the lower efficiency in these tasks was due to the fact that in the document camera context the participants took more time to achieve the task objectives in comparison with the participants that performed the same tasks in the emulator context. This statement was confirmed when we performed the ANOVA for the average times in the three contexts and found that the time in the document camera context was always longer for tasks 2, 3 and 6 (α=5%, F(3,32)=5.96, p=0.0061; F(3,32)=3.87, p=0.03; F(3,32)=5.11, p=0.01). The lowest efficiency for task 5 may be attributed to the fact
Usability Testing of Mobile Devices: A Comparison of Three Approaches
477
that three participants gave up completing this task in the document camera context and those who managed to complete the task took more time in this context than in the emulator context. Between the document camera and the wireless camera contexts there was no significant difference for the task efficiencies except for task 2, where the user efficiency was lower in the document camera context. Since the effectiveness of this task was 100% in the two contexts, this difference in efficiency can be attributed to the longer time that the users took to perform it in the document camera context in comparison with the wireless camera context (α=5%, F(3,32)=5.96, p=0.0061). There was no significant difference between the efficiency measured in the emulator context and the wireless camera context in any of the tasks. 3.3 User Satisfaction The results of applying the SUS Questionnaire [15] to measure user satisfaction in relation to the interaction with the system was reduced significantly in the document camera context in relation to the other two evaluation contexts (α=5%, F (3,32)=4.60, p=0.01). The SUS values were 72.92 in the emulator context, 58.33 in the document camera context and 71.88 in the wireless camera context. 3.4 Workload ANOVA tests showed that there were no statistical differences in the results obtained for the NASA TLX general value in the three evaluation contexts (α=5%, (F(3,32)=2.40, p=0.10)). There was also no statistical differences among the factors isolatedly, the Mental Demand (α=5%, F (3,32)=0.82, p=0.44), Physical Demand (α=5%, F (3,32)=1,14, p=0,33), Temporal Demand (α=5%, F (3,32)=0.60, p=0.55), Effort (α=5%, F (3,32)=1.69, p=0.19), Performance (α=5%, F (3,32)=2.31, p=0.12) and Frustration (α=5%, F(3,32)=1.63, p=0.21). These results show that through the participants’ perspective, the subjective experience of the workload was the same in the three evaluation contexts. 3.5 Quantity of Usability Problems Considering the three evaluation contexts, a total of 43 unique usability problems were identified in the interaction with the system. The usability problems were distributed among the different evaluation contexts as showed in Fig. 5.
Emulator 2
3
0
Document camera
32 0
4 2
Wireless camera
Fig. 5. Usability problems distributed according to evaluation contexts
478
A.H. Betiol and W. de Abreu Cybis
These results show that the document camera context was the context in which it was possible to identify the greatest number of usability problems, 95.35% of all the problems found. This value corresponds to 8% more usability problems identified in relation to the wireless camera context and 17% more than the emulator context. However in the emulator context it was possible to identify more than 80% of the total problems. There was no usability problem identified exclusively in the emulator context. However, the contexts of the document camera and the wireless camera detected 2 exclusive problems each. From the total of 8 problems not identified in the emulator context only one was a problem relative to the characteristic of the mobile phone being used and could not have happened in the emulator. This problem refers to prompting a field for text entry. In the emulator this field already appears as prompted, while in the mobile phone it is necessary for the user to press a key before starting to enter text. Since there is no indication that it is necessary to take this one extra step to prompt the field, the participants were very confused. The emulator interface eased the usability in this context since the field already appeared as prompted. 3.6 Severity of Usability Problems The document camera context was the context that totalled the highest degree of problem severity with a result 23% superior in relation to the wireless camera context and 59% superior in relation to the emulator context. Between the contexts of the wireless camera and the emulator, the context of the wireless camera presented a result 29% superior. The analysis of Fig. 6 shows that the usability problems identified occurred with much greater frequency in the document camera context, for all impact degrees of the problem.
F r e q u e n c y o f u s a b ilit y p r o b le m s p e r im p a c t 120
103
100 73
80 60
93
79 E m u la to r
59 47
D oc u m en t C am era 28
40 8
20
17
W ir e le s s C a m e r a
0 Im p a c t 1
Im p a c t 2
Im p a c t 3
Fig. 6. Frequency of usability problems per impact
The greatest visibility of impact 3 problems in the document camera context is an important aspect to be considered since these are considered the most important problems to be detected for they are the most serious. When they occur, the user is incapable of achieving his objectives in the task. In this way they are related to usability aspects in the interface that have higher priority to be modified. The difference between the frequency of occurrence of impact 3 problems in the emulator and the wireless camera context was significant, a value of 113%, indicating
Usability Testing of Mobile Devices: A Comparison of Three Approaches
479
that the most serious problems appear with greater frequency on the mobile phone. However, we may consider that in spite of appearing with less frequency in the emulator context it was possible to identify 75% of the problems of greater impact (impact 2 and 3) in this context. While in the document camera and in the wireless camera contexts 100% of these problems were identified. 3.7 Benefit/Cost Ratio Considering the hours spent on evaluation, the document camera was the context which presented the best benefit/cost ratio since it was able to identify the greatest number of usability problems, including the most serious, per hour of evaluation. The benefit/cost ratio greater advantage for the document camera context was 82% greater in relation to the emulator context and 30% more in relation to the wireless camera context. Table 3 presents a summary of the contexts performance in identifying usability problems. Table 3. Contexts performance in identifying usability problems
Usability problems Severity degree Benefit/cost
Emulator 3rd 81.4% 229 7.49
Document Camera 1st 95.35% 363 11.38
Wireless Camera 2nd 88.37% 296 8.79
4 Discussion Overall, the results show that user performance rates were lower and that usability problems appeared with a higher frequency in the document camera context. These results can not be attributed only to the fact of using different interfaces such as the emulator vs. the mobile phone, and performing the tests inside the lab vs. in the field. Otherwise comparing the results from the emulator and wireless camera setup could have shown statistically significant differences, which didn’t happen. This suggests that the fact of needing to operate the phone that was positioned on the tripod which could not be moved, since it might be out of the visualization area of the document camera, caused an extra concern to the user. This concurrent cognitive task ended up influencing the test results. The emulator context was the simplest evaluation setup since it did not require special equipment for recording the interaction and there was no need to use the real phone. However, the use of the emulator places a restriction on the choice of participants, since it is necessary for the participant to be a computer user. Otherwise the difficulties with the use of the mouse and other devices for interaction will be the principal ones faced by the user. Generally speaking, the emulator context attained excellent performance rates in identifying usability problems. In the emulator context it was possible to identify more than 80% of the total usability problems and three out of the four most severe problems. This suggests as stated in [16] that many important usability problems can be found in simpler laboratories approaches. However, the validity of the usability problems identified in the emulator setup may depend on the similarity between the emulator and mobile phone interfaces. It was found that a
480
A.H. Betiol and W. de Abreu Cybis
slight change in the emulator interface, such as a greater number of lines, for example, may cause a large effect in the usability measured, for better or worse. The solution of the wireless camera to record the interaction in the external environment was satisfactory, since it was capable of generating high quality images and did not hamper the participant interaction with the mobile phone. Although the external environment was busy and noisy, in the field the user was not as susceptible to outside interference as expected. The fact that the users knew that they were participating in an evaluation, that the test administrator was nearby, and that they could see the equipment used to record the interaction may have helped to increase their concentration in the tasks at hand. This data suggests the research development of new evaluation techniques which enable the user to handle a mobile device in real situations, in movement, in several different environments, being exposed to concurrent tasks, without the presence of the evaluator, and at the same time enabling to record the interaction. This experiment was based on three representative evaluation contexts for usability tests of mobile devices. However, its results are limited in a number of ways. First the users were not exposed to explicitly concurrent tasks. The document camera context results showed that the appearance of a concurrent cognitive task, as small as it may be, had a negative impact on the usability measured. Secondly, although the participants performed the usability tests seated, which also corresponds to a possible real context once “mobile user” doesn’t necessarily mean that the user is “in movement”, the mobility aspect of the user was not directly evaluated. Finally, based on its results, this experiment should be repeated using the wireless camera and real phone in the laboratory and in the field, with the user standing or walking, for better test the effects of the mobility aspect and of these two different contexts over usability evaluations.
References 1. Johnson, P. Usability and Mobility: Interactions on the Move. First Workshop on Human Computer Interaction with Mobile Devices. Glasgow, UK (1998) 2. Petrie, H., Furner, S., Strothotte, T. Design Lifecycles and Wearable Computers for Users with Disabilities. First Workshop on Human-Computer Interaction with Mobile Devices. Glasgow, UK (1998) 3. Waterson, S., Landay, J.A., Matthews, T. In the Lab and Out in the Wild: Remote Web Usability Testing for Mobile Devices. Extended Abstracts of ACM CHI 2002 Conference on Human Factors in Computing Systems. Minneapolis, MN (2002) 4. Brewster, S. Overcoming the Lack of Screen Space on Mobile Computers. Personal and Ubiquitous Computing (2002) 6 (3):188-205 5. Chittaro, L., Cin, P. Evaluating Interface Design Choices on WAP Phones: Single-Choice List Selection and Navigation Among Cards. Proceedings IHM-HCI Mobile HCI 2001. Lille, France (2001) 6. Nyyssönen, T., Roto, V. Kaikkonen, A. Mini-camera for Usability Tests and Demonstrations. Demonstrated at Mobile HCI 2002 – Fourth International Symposium on Human-Computer Interaction with Mobile Devices. Pisa, Italy (2002)
Usability Testing of Mobile Devices: A Comparison of Three Approaches
481
7. Openwave Developer Network web site: Tools and SDK. Available at: http://developer. openwave.com/dvl/ (February, 2004) 8. LG Corporate web site: BD4000 Mobile Phone Characteristics. Available at http://www. lge.com.br/produtos/ (February, 2004) 9. ISO 9241-11 – Ergonomic Requirements for Office Work with Visual Display Terminals (VDT)s – Part 11: Guidance on usability (1998) 10. Cooper, D. - Performance Measurement Handbook. National Physical Laboratory, Teddington, Middlesex, UK (1995) 11. Macleod, M., Bowden, R., Bevan, N., Curson, I. The MUSiC Performance Measurement Method. Behaviour & Information Technology (1997) 16 (4/5): 279-293 12. NASA TLX - NASA Task Load Index. Human Performance Research Group, NASA Ames Research Center. Moffett Field, California, USA (1986) 13. Jeffries, R., Miller, J., Wharton, C., Uyeda, K. User Interface Evaluation in the Real World: a Comparison of Four Techniques. Proceedings of CHI’91, New Orleans, USA (1991) 14. Desurvire, H. W. Faster, Cheaper!! Are Usability Inspection Methods as Effective as Empirical Testing? In: Nielsen, J., Mack, R.L. Usability Inspection Methods. John Wiley & Sons, USA (1994) 173-202 15. Brooke, J. SUS – A Quick and Dirty Usability Scale. In: Jordan, P.W. et al., Usability Evaluation in Industry. Taylor & Francis, London, UK (1996) 189-94 16. Kjeldskov, J., Skov, M. Creating Realistic Laboratory Settings: Comparative Studies of Three Think-Aloud Usability Evaluations of a Mobile System. Interact 2003. Zurich, Switzerland (2003)