6 36001 (2010) EPJ Web of Conferences 6, DOI:10.1051/epjconf/20100636001 © Owned by the authors, published by EDP Sciences, 2010
Characterization and comparison of defects detection limits of three ultrasonic non destructive methods E. Péronnet 1,3,a, F. Eyma 2, H. Welemane1 and C. Pescay2 1
PRES Université de Toulouse, INP, ENIT-LGP, Av.Azereix, BP1629, 65016 Tarbes Cedex PRES Université de Toulouse, UT3, IUT-ICA, 1, rue Lautréamont, BP 1624, 65016 Tarbes Cedex 3 DAHER SOCATA Aéroport Tarbes-Lourdes 65290 LOUEY 2
Abstract. This work deals with the Liquid Resin Infusion (LRI) process developed within the research program “FUSelage COMPosite” of DAHER SOCATA. This manufacturing process enables the realization of complex composite structures or fuselage elements in a single phase (mono-material), which considerably reduce connections and relative difficulties. The concern here is the investigation of non destructive testing (NDT) methods that can be applied to LRI-structures in order to define their capacities for defect detection, and especially their associated critical defect size. In aviation industry, the AITM standards require the ultrasonic testing as NDT for composite materials. Therefore the aim of this work is to characterize and compare three different and complementary ultrasonic techniques on composite specimens. Such analysis allows to define the NDT application field of each method in term of defect detection.
1 Introduction This paper involves the liquid infusion process developed within the research program “FUSelage COMPosite” of DAHER SOCATA. It enables the manufacturing of complex composite fuselage elements reducing connections. The aim of this research is to investigate various non destructive testing (NDT) methods that can be applied to LRI parts in order to define their capacities for defect detection, and especially their associated critical defect size. One of the first NDT tested is the ultrasonic methods, required by the AITM standards on composite parts. In the IUT-ICA Laboratory, three different and complementary ultrasonic techniques are available: contact pulse echo testing, ultrasonic spectroscopy and immersion pulse echo testing. For each of these three ultrasonic methods, the aim of this study is to investigate their potentialities in view of aviation industry issues, namely: - Define the defect detection limits (size and location), in order to know the equipment capacities in relation with a critical defect size determined by aviation rules, - State the specific application fields for each technique. a
e-mail :
[email protected]
This is an Open Access article distributed under the terms of the Creative Commons Attribution-Noncommercial License 3.0, which permits unrestricted use, distribution, and reproduction in any noncommercial medium, provided the original work is properly cited.
Article disponible sur le site http://www.epj-conferences.org ou http://dx.doi.org/10.1051/epjconf/20100636001
EPJ Web of Conferences
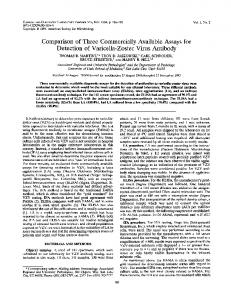
2 Different ultrasonic techniques The ultrasonic testing is the most widely used and the most efficient NDT method for composite parts [1].This kind of testing is able to identify the majority of defects occurring in composite structures as described on the figure 1.
Fig. 1. Defects in composite structures [2]
The ultrasonic method consists in transmitting ultrasonic pulses into the inspected specimen, by probe with a piezoelectric crystal. Concerning the pulse echo methods, the same transducer transmits and receives the wave. The frequency used in ultrasonic testing is high, varying from 100 kHz to 25 MHz. Thereafter we describe the three ultrasonic methods used. 2.1 Contact pulse echo testing In the contact pulse echo testing, the ultrasounds are transmitted and received by the same transducer. The acoustic link is made by a water coupling between probe and specimen. Moreover, in order to optimize the measurements (taking away the dead zone of Fresnel area), we use a wedge between probe and coupling. The wedge allows to have the maximum wave intensity at the specimen beginning surface. During the manual scanning of the specimen, the thickness must be perfect and constant so that the coupling ensures the wave path. The real difficulty in contact techniques is to certify a perfect and constant acoustic link between probe and specimen. During the scanning, when the wave goes through the specimen we analyse the echoes produced by breaking the acoustic impedance due to the heterogeneities into the inspected sample. The result is an A-Scan as shown on the figure 2 which measures the echo amplitude according to the time of flight.
Fig. 2. Contact A scan with defect [3]
The A-Scan is always made up of at least two echoes: the specimen front side corresponding to the emission echo and the specimen backside corresponding to the back wall echo. When the wave meets a defect on the way, the breaking of the signal creates a defect echo between the emission echo and the back wall echo [4].The time of flight enables locating the defect in the specimen thickness. The amplitude of these three echoes allows us to estimate the defect size. In order to analyse scanning results, the most used display is the C-Scan which is a defect map in term of amplitude or depth [5].
36001-p.2
14th International Conference on Experimental Mechanics In our study of contact pulse echo testing, the following equipments have been used: -The Freescan enabling space location of transducer during the specimen scanning with a locating disk on the transducer (supplier: IXTREM), -The Omniscan enabling the recording and analysis of ultrasonic wave only at high frequency (supplier: OLYMPUS), -The transducer used is a phased array with 64 elements and with a wedge. Its frequency is 5 MHz. The coupling is made by water. 2.2 Ultrasonic spectroscopy This method aims at measuring the variation of electrical impedance with a manual scan [6]. It is also a pulse echo testing. Therefore there is also the same issue concerning the coupling. According to P. Cawley [7-8], the measurement is a probe electrical impedance variation between an undamaged and a damaged sample part as shown on figure 3:
Fig. 3. The spring model of P. Cawley [7-8]
The scan result is a defect map on top view. When there is no defect, the cartography is white and when there is a defect, the cartography is coloured. This technique cannot locate defects within the specimen thickness. Therefore, this method is complementary to ultrasonic pulse echo without replacing it. Besides, results provided are satisfactory on disbonds, crushed core, and bond defects on the inside wall of a composite structure [7-8]. In the present case, the following equipments have been employed: -The same Freescan as for the contact pulse echo technique, -The N-BUS for the recording and analysis of ultrasonic wave only at high frequency (supplier: IXTREM), -The transducer used is a mono-element at 1 MHz frequency. 2.3 Immersion pulse echo testing In this testing, the specimen and the probe are in complete immersion in water tank without contact between them [4]. Its specificity is the automatic system and the perfect and constant acoustic link. There are no more errors of operator about imperfect or variable acoustic link thickness. The advantages are automatic system, accurate measurements and quick acquisition of the C-scan cartography. The disadvantages are cumbersome system, use of a tank, need of a complete specimen/probe immersion and limitation of specimen size. We cannot test specimen bigger than the tank size. Moreover, the shape of controlled specimens depends on technical characteristics of tank axis. In our study we use the same equipments as contact pulse echo testing to realize the immersion testing. The only difference is the position of probe in relation with sample which is automatic.
36001-p.3
EPJ Web of Conferences
3 Experimental results In order to define the detection limits and the specificity of each testing method, three different composite specimens were used: -A multilayered composite with flat-bottomed holes defects, -A multilayered composite with Teflon insert defects, -A foam-core composite with Teflon insert defects. 3.1 A multilayered composite with flat-bottomed holes defects For a better understanding, the sample drawing is given on figures 4 and 5.
110 mm
180 mm
Fig. 4. Top view drawing
Fig. 5. Depth view drawing
The graph shown on figure 6 allows us to analyse the measurement errors in relation with the defect depth for each ultrasonic technique. Six defects without measurement error have been detected: three for contact pulse echo testing, one for ultrasonic spectroscopy and two for immersion pulse echo testing. Consequently, the contact pulse echo testing is the most accurate method. The biggest errors concern the 2 mm diameter defect. We can consider that it may be the ultrasound limitation in detection for this sample. 70%
50%
2
40%
30%
3
Diameter
Error compared with the real diameter
60%
20% 6
10% 10 0% Pulse echo Ultrasonic Pulse echo contact spectroscopy immersion testing testing
Pulse echo Ultrasonic Pulse echo contact spectroscopy immersion testing testing
0,52
1
Pulse echo Ultrasonic Pulse echo contact spectroscopy immersion testing testing
Pulse echo Ultrasonic Pulse echo contact spectroscopy immersion testing testing
Pulse echo Ultrasonic Pulse echo contact spectroscopy immersion testing testing
2,8
5,2
7,48
Defect depth (mm)
Fig. 6. Depth impact on the detection accuracy
A synthesis of the capacities of the three ultrasonic techniques is presented in the table 1. The performance of each technique is different. All defects are detected by the two pulse echo ultrasonic methods excepting near the testing surface (1 mm depth) of 2 mm diameter defects by contact pulse echo ultrasound. We note that these methods are adapted to this specimen and this kind of defects, contrary to the ultrasonic spectroscopy which enables to detect only three defects.
36001-p.4
14th International Conference on Experimental Mechanics Table 1. Performances of ultrasonic techniques on the multilayered composite with flat-bottomed holes defects Method Results
Contact pulse echo ultrasound
Ultrasonic spectroscopy
Immersion pulse echo ultrasound
14/15
3/15
15/15
Circular 11 % 5 min Manual Variable Phased array 5 MHz Amplitude / Time Of Flight
Near elliptic 13,33 % 20 min Manual Variable Mono-element 1 MHz Impedance variation
Circular 16,33 % 1 min Automatic Perfect / constant Phased array 5 MHz Amplitude / Time Of Flight
C-Scan Number of detected defects Shape Accuracy Testing time Testing type Acoustic link Probe Acquisition
According to table 1, the most accurate method is the contact pulse echo ultrasound and the most efficient is the immersion pulse echo ultrasound. Consequently, the immersion pulse echo ultrasound could be the most adapted method for multilayered composite with flat-bottomed holes defects. For this specific application field, the defect detection limits could be 2 mm diameter for the two pulse echo ultrasonic techniques and 6 mm diameter for the ultrasonic spectroscopy. 3.2 A multilayered composite with Teflon insert defects Figure 7 shows the sample drawing of a multilayered composite with Teflon insert defects.
Fig. 7. Drawing of the multilayered composite with Teflon insert defects
The graph shown in figure 8 is the result of the depth impact on the detection accuracy of each ultrasonic method. Six defects without error with contact pulse echo ultrasound have been detected and one defect without error with ultrasonic spectroscopy have been detected. The biggest errors concern the 4 mm diameter defect. However the two pulse echo techniques detect all the defects. Therefore this defect size is not the detection limitation but is close to accuracy limitation.
36001-p.5
EPJ Web of Conferences 90%
70% 60% 50% 4 40%
6 8
30%
10
20%
Diameter
Error compared with the real diameter
80%
12 10%
15
0% Pulse echo Ultrasonic Pulse echo contact spectroscopy immersion testing testing
Pulse echo Ultrasonic Pulse echo contact spectroscopy immersion testing testing
Pulse echo Ultrasonic Pulse echo contact spectroscopy immersion testing testing
1,4
2,1
0,7
Defect depth (mm)
Fig. 8. Depth impact on the detection accuracy Table 2. Performances of ultrasonic techniques on the multilayered composite with Teflon insert defects Method Results
Contact pulse echo ultrasound
Ultrasonic spectroscopy
Immersion pulse echo ultrasound
18/18 and porosity Circular 8,10 % 5 min Manual Variable Phased array 5 MHz Amplitude / Time Of Flight
7/18 and porosity Near elliptic 24,05 % 20 min Manual Variable Mono-element 1 MHz Impedance variation
18/18 and porosity Circular 20,49 % 1 min Automatic Perfect / constant Phased array 5 MHz Amplitude / Time Of Flight
C-Scan
Number of detected defects Shape Accuracy Testing time Testing type Acoustic link Probe Acquisition
According to table 2, all these techniques detect the porosity in this specimen and all the pulse echo techniques detect the totality of defects. Therefore the contact and immersion pulse echo ultrasound are particularly well adapted to this specimen and this type of defect. The performance of ultrasonic spectroscopy is better than for the first sample. The ultrasonic spectroscopy is more sensitive to delaminations between layers representing by Teflon insert defects than flat-bottomed holes defects. The most accurate method is the contact pulse echo ultrasound, consequently the contact pulse echo ultrasound could be the most adapted method for a multilayered composite with Teflon insert defects. For this specific application field, the defect detection limits could be 4 mm diameter for the two pulse echo ultrasonic techniques and 10 mm diameter for the ultrasonic spectroscopy. 3.3 A foam-core composite with Teflon insert defects Figure 9 presents the sample drawing of a foam-core composite with Teflon insert defects.
36001-p.6
14th International Conference on Experimental Mechanics
Fig. 9. Drawing of the foam-core composite with Teflon insert defects
120,00% 100,00% 80,00% 60,00%
3
40,00%
6
Diameter
Error compared with the real diameter
In figure 10, the graph presents the average depth impact on the detection accuracy. All defects have been detected with measurement errors. Therefore the three ultrasonic methods have detection difficulties for this specimen. The synthesis of the three ultrasonic techniques is presented in table 3.
20,00% 0,00% Pulse echo contact testing
Ultrasonic spectroscopy
Pulse echo immersion testing
Pulse echo contact testing
0,22
Ultrasonic spectroscopy
Pulse echo immersion testing
Pulse echo contact testing
0,44
Ultrasonic spectroscopy
Pulse echo immersion testing
0,66
Defect depth (mm)
Fig. 10. Average depth impact on the detection accuracy Table 3. Performances of ultrasonic techniques on the foam-core composite with Teflon insert defects Method Results
Contact pulse echo ultrasound
Ultrasonic spectroscopy
Immersion pulse echo ultrasound
8/18
11/18
0/18
Elliptic 65,28 % 5 min Manual Variable Phased array 5 MHz Amplitude / Time Of Flight
Elliptic 44,38 % 20 min Manual Variable Mono-element 1 MHz Impedance variation
1 min Automatic Perfect / constant Phased array 5 MHz Amplitude / Time Of Flight
C-Scan Number of detected defects Shape Accuracy Testing time Testing type Acoustic link Probe Acquisition
Table 3 shows that no technique detects all sample defects. The most efficient and the most accurate is ultrasonic spectroscopy. This is in line with the mechanical impedance inspection results of B. S. Wong [9]. The ultrasonic spectroscopy is more sensitive than pulse echo methods concerning delamination detection in sandwich structure. Concerning the two pulse echo techniques, due to the cannot distinguish the defect thin skin, defect echoes are drowned with emission echo. Therefore we cannot echoes to the emission echo. One can conclude that pulse echo ultrasound could not be adapted for defect detection on thin skin (less than 1 mm) and for the sandwich structure: 1 mm thickness skin could be the thickness detection limitation. In aviation industry, this kind of sample is inspected with squirters in through transmission ultrasound [10]. In our study, the most adapted method is ultrasonic spectroscopy for foam-core composite with Teflon insert defects.
36001-p.7
EPJ Web of Conferences
4 Conclusion
50 % 80 % 3% 14 % 6% 6% 5% 10 % 20 %
Fig. 11. Pulse echo contact ultrasound
0 0,52 0,7 1 1,4 2.1 2,8 5,2 7,8 8
30 % 75 % 20 % 20 % 32 % 0% 0% 10 % 10 %
Fig. 11. Ultrasonic spectroscopy
Specimen depth
0 0,52 0,7 1 1,4 2.1 2,8 5,2 7,8 8
Specimen depth
Specimen depth
This work allows comparing three ultrasonic methods able to satisfy aviation industry issues. From the different results, the contact pulse echo ultrasound could be the most adapted method for multilayered composite with Teflon insert defects. The immersion pulse echo could be the most efficient method for multilayered composite with flat-bottomed holes defects. The most adapted method for foam-core composite with Teflon insert defects could be the ultrasonic spectroscopy. Figures 11, 12 and 13 allow us to indicate the average measurement error estimation in percentage compared with the real defect sizes from 2 mm diameter to 15 mm diameter. The defect depth impact the detection accuracy. For the two pulse echo ultrasonic methods the minimum limit depth could be 1 mm and the defect size limit could be 2 mm diameter. From the results, for the ultrasonic spectroscopy we did not reach the depth limit. Its defect size limit could be also 2 mm diameter.
0 0,52 0,7 1 1,4 2.1 2,8 5,2 7,8 8
16 % 16 % 12 % 31 % 14 % 11 % 15 % 15 % 20 %
Fig.13. Pulse echo immersion ultrasound
Only ultrasonic spectroscopy is adapted to sandwich structure contrary to pulse echo ultrasound which are more adapted to multilayered structure. However, some problems remain opened as the definition of nailhead and hat section. That is the reason why, in the next part of our work, the three used ultrasonic non destructive methods could be compared with other techniques as through transmission ultrasound, IR thermography, acoustic emission, shearography….
References 1.
Adams, R D et W, Drinkwater B., NDT & E International, Nondestructive testing of adhesivelybonded joints, 30, pp. 93-98 (1997) 2. Boro Djordjevic, B., The 10th International Conference of the Slovenian Society for NonDestructive Testing, Nondestructive test technology for the composites, pp. 259-265 (2009) 3. Cherfaoui, M., Techniques de l'ingénieur, Essais non destructifs chapitre contrôle par ultrason (2006) 4. Y. Bar-Cohen, A. K. Mal, C. J. Hellier, W. Plumstead, K. Fowler, R. Grills, G. Anderews, M. C. Tsao, J. J. Snyder, J. F. Cook, D. A. Aldrich, R. W. Pepper, ASM International, Non destructive evaluation and quality control, chapter Ultrasonic Inspection, 17, p. 231 (1996) 5. Perdijon, J. Le contrôle non destructif par ultrasons (1993) 6. Engholm, M., A Narrowband Ultrasonic Spectroscopy : Technique for the inspection of layered structures (2006) 7. Cawley, P., NDT International, The Impedance Method of Nondestructive Inspection, 17, pp. 59-65 (1984) 8. Cawley, P., NDT Journal, The Sensitivity of the Mechanical Impedance Method of Nondestructive Testing., 20, pp. 209-215 (1987) 9. Wong, B. S. Non-destructive testing of fibre reinforced composites and honeycomb structures (1998) 10. Hsu, D K., 17th World Conference on Nondestructive Testing, Nondestructive inspection of composite structures: methods and practice (2008)
36001-p.8