Detection and Characterization of Defects in Microelectronic Packages and Boards by Means of. High-Resolution X-Ray Computed Tomography (CT).
Detection and Characterization of Defects in Microelectronic Packages and Boards by Means of High-Resolution X-Ray Computed Tomography (CT) Mario Pacheco and Deepak Goyal Intel Corporation 5000 W. Chandler Blvd., M/S CH5-263 Chandler, AZ 85226, e-mail: mario.pacheco at intel.com Abstract In this paper a review of the development of x-ray computed tomography (CT) for non-destructive failure analysis in microelectronics packages and boards is presented. The general operation principle, key design considerations and technical challenges faced by x-ray CT technology are discussed. A comparison between 2D and 3D x-ray imaging capabilities is presented, and critical failure analysis case studies for first and second level interconnect that are hard or not possible to isolate by alternative methods are also discussed, as well as its unique progressive testing capability. Introduction The non-destructive detection and characterization of defects in microelectronic packages and boards has become increasingly difficult with the complexity and reduced interconnect dimensions of advanced package technologies; these changes are making destructive analytical methods more tedious and time consuming, and with higher risk of creating artifacts. Traditional non-destructive 2D x-ray methods are facing imaging limitations due to the relatively larger amount of interfering features in the field of view. For instance, package failure mechanisms such fatigue, cracking and nonwetting in solder joints at first and second level interconnect, copper migration, and trace cracking all present challenges to non-destructive imaging due to small size of defect (typically < 1 micron) and the complex geometries of packages such as multi-layer stacks and materials that are highly x-ray absorbing, e.g. copper heat sinks, dense solders and multilayer interconnects. One of the x-ray techniques identified as potentially feasible to fulfill these defect detection gaps was x-ray CT [1]. However, the standard assembly imaging techniques of x-ray CT had important limitations in terms of defect detection capability and time-to-data, and thus it needed to be extended into the next generation [2]. Key technical drivers for x-ray CT are the need to non-destructively and quickly detect micron and sub-micron sized defects. In this paper, we review key technical challenges faced by x-ray CT technology, leading technical developments that have overcome some of these challenges, a general comparison between 2D versus 3D x-ray imaging for defect detection, the general requirements for x-ray CT technology in the semiconductor industry, as well as application development for critical defect detection case studies to demonstrate the potential that tomography has to fulfill some of the analytical gaps in the semiconductor industry. We also review one of the compelling capabilities of x-ray CT to perform defect inspection at different readout times during reliability testing to feedback to predictive reliability models, as well as at different steps during production for process development.
978-1-61284-498-5/11/$26.00 ©2011 IEEE
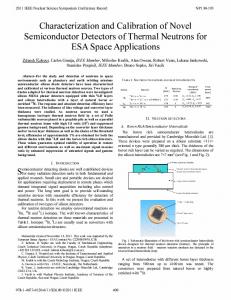
X-ray CT Operation Principle Industrial x-ray CT systems have different configurations; however, they all rely on a basic operation principle of using an x-ray source to radiate the object at different tilt angles, with a rotating stage providing such angular displacement in equally spaced angles, and a detector collecting the 2D x-ray images at each angle, figure 1a. All 2D images are mathematically superimposed and processed to obtain a three dimensional map of the sample, as it is shown schematically in Fig. 1b.
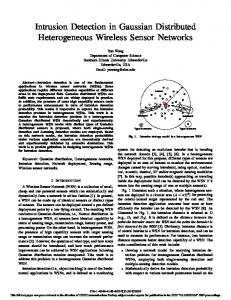
Figure 1: (a) Basic schematic of the x-ray CT setup consisting of x-ray source, rotating stage and detector. (b) The projections at each angle of the intensity of collected 2D x-ray images are superimposed and mathematically processed to generate the three dimensional image. Since the processed data contain the volumetric information of the sample under test, the analyst can manipulate it to display virtual cross-sections or slice views at any give location of the three dimensional data set. This provides the capability of removing interfering features in the field of view that may have been masking out the signal produced by the defect in single 2D x-ray images; the outstanding property of x-ray CT as analytical method comes from the fact that the subtle information of the defect contained in each 2D image becomes important when it is added to signal contributions at the specific xyz location that such a defect has in every single of whole set of images that were collected at equally spaced angles. Figure 2 shows an example of typical virtual cross-sections, slice or planar, and orthogonal views of a capacitor; notice how the virtual cross sections in 2a and 2b provides details of shape and xyz localization of solder voids, while the virtual plane view 2c reveals voids that were hiding underneath the highly x-ray
1263 2011 Electronic Components and Technology Conference
absorbing capacitor. The orthogonal view, 2d, helps the analyst to visualize the xyz location of voids. Figure 2e shows a 3D rendering of the capacitor, which is a capability that can be used to visualize the external surface in case the capacitor in not optically accessible, like inside a heat sink or molding compound.
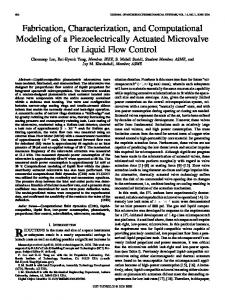
between x-ray source and detector is fixed by tool setup dimensions, thus the sample-to-source distance strongly limits system magnification. Smaller sample-to-source distances provide higher magnification and thus better spatial resolution. One of the key technical challenges is the fact that in order to obtain the highest possible resolution, the sample has to be positioned very close to the x-ray source and since the sample has to fully rotate for 2D images collection the sample hits the x-ray source, as illustrated in Fig. 3. In order to avoid sample to source collision, the sample has to be positioned far enough from the source to freely rotate without hitting it, thus limiting the achievable resolution. One simple solution is to trim the sample under test so that it does not snag. However such sample preparation consumes time, it is invasive and nonpractical in most cases. Resolution also depends on the spot size of the x-ray source; in general, the smaller the spot size the higher the resolution.
Figure 3: Conventional x-ray systems face a technical challenge: the sample has to freely rotate without hitting the xray source, thus it has to be positioned far enough to avoid hitting the source; however, increasing D1 deteriorates magnification and thus limits the achievable resolution. Figure 2: Typical example of x-ray CT data display of a capacitor that was mounted on a package and not optically accessible because of metallic heat sink: (a) and (b) are virtual cross sections, (c) is a virtual planar or slice view, (d) is an orthogonal rendering showing the planes location, and (e) 3D rendering. Key Design Factors in X-Ray CT In this section we’ll review and discuss the critical design considerations for successful x-Ray CT systems that are targeted for failure analysis in microelectronics applications Resolution: x-ray image resolution depends on several factors, however geometric magnification, which is given by the ratio between sample-to-source and sample-to-detector distances, is one of the most critical ones, given by the following expression.
M =
D1 + D2 D1
where D1 and D2 are the sample-to-source and sample-todetector distances, respectively (Fig. 2). The total distance between x-ray source and detector is fixed by tool setup dimensions, thus the sample-to-source distance strongly limits system magnification. Smaller sample-to-source distances provide higher magnification and thus better spatial resolution to detector distances, respectively (Fig. 2). The total distance
This technical issue is one of the key fundamental limitations of x-ray CT technology in microelectronics applications. Limited angle scanning routines could be used as a way around to avoid sample to source crashing; however, the missing 2D images at high tilt angles have considerable amount of information of the defects, especially if the best way to visualize a specific defect is by using virtual cross sections, rather than virtual plane views. Design solutions to overcome these issues may require innovative x-ray optics configurations. Maximum Energy: The maximum energy of the x-ray source is important in microelectronics applications because the copper content in the samples may highly absorb the x-ray radiation and thus directly impact the required exposure time to get a good quality two dimensional x-ray image and therefore the total tomography scanning time. This is especially important when there are solder joints in the field of view or even worse if they are located in the region of interest. In general, x-ray CT systems with higher maximum energy will provide better x-ray penetration that will allow scanning highly absorbing samples. In addition, the higher the energy used to scan a specific sample, the faster the exposure time and thus total data collection time. For most microelectronic applications an x-ray source with maximum energy of at least 120-150kV is recommended.
1264
It is important to keep in mind that based on current x-ray source technology the higher the maximum energy the bigger the spot size, so in order to take advantage of maximum energy in microelectronics applications at micron level resolution, the x-ray CT system needs to have a means to compensate for such resolution deterioration Data acquisition: Data acquisition time depends on several factors, e.g. x-ray source energy as was mentioned earlier, sample density, sample size, detector-to-sample and source-tosample distances, detector system sensitivity and the required resolution to detect the feature of interest. All these factors define the required minimum exposure time for each two dimensional image, thus contributing to total data acquisition time. The number of two dimensional images that needs to be used to obtain the required image quality in the tomography results for a given case study adds to the total data acquisition time. In many cases long data acquisition times could be show stoppers, especially when an alternative destructive or nondestructive method is available. Developing approaches to achieve data collection and 3D image reconstruction times less than 10 minutes is very important for x-ray CT technology to succeed in integrated circuit (IC) packaging applications Data Reconstruction: All x-ray CT suppliers have focused efforts on decreasing the data reconstruction time being achieving improvement from several hours to a few minutes in only a few years. The development of more efficient reconstruction and image processing algorithms has been crucial to improving the time to data. On the other hand, the availability of faster computing technologies have also been an important factor in reducing reconstruction processing time. Image Quality: Regarding image quality, the greater the quality and the number of the two dimensional images used for reconstruction the higher the quality of the reconstructed tomography data. Depending on the specific case, the analyst can adjust the number of collected 2D images according to the required resolution and tomography image quality. Several filtering techniques to enhance the image quality have been developed, and the failure analyst could always find the best one to use for specific applications without introducing image processing artifacts. Requirements for X-ray CT Systems in Microelectronics Considering the diverse spectrum of package and board application sizes as well as all key design factors described above, a suitable x-ray CT system for failure analysis in microelectronics needs to meet the following highlights: (a) must have a way to compensate for magnification / resolution deterioration due to large sample sizes, (b) a maximum energy of 120kV to 150kV or higher to deal with highly absorbing cooper features, and (c) fast data acquisition / reconstruction throughput time down to 10 minutes of scanning time to compete with alternative failure analysis methods. The X-ray CT Microscope The microelectronic package and board case studies that are presented in this paper were analyzed using the x-ray CT microscope, model MicroXCT-200, manufactured by Xradia [3,4].
One of the key components of this system is an x-ray detector with proprietary x-ray optics and optical design that provides significant reduction of the dependence that magnification has with respect to the source-to-sample distance. The design achieves resolutions in the range of 1.5 to 2 microns without the need of placing the sample close to the source, thus allowing full sample rotation required for 3D xray imaging without sample-source collision for samples up to 4 inches in diameter (Fig. 3).
Figure 4. Xradia Micro XCT tool configuration The system also uses an x-ray tube that has a maximum voltage and power output of 150kV and 10W, respectively. This high voltage allows for effective penetration through highly absorbing samples with features like solder balls. The proprietary detection scheme also helps reduce the impact on resolution of increased spot size produced by higher x-ray source energy. 2D X-ray Vs X-ray CT 2D x-ray imaging is a matured and widely used analytical method for failure analysis in microelectronics. One of the important reasons, besides demonstrated capability for defect detection, is its real time nature; in most cases, the user interface makes it easy to obtain good quality images without the need of intensive training, not to mention the good amount of automated routines that can be used for the detection of specific defects. On the other hand, some image quality and resolution improvements may be expected in the near future as a consequence of detector technology development. The main technical challenges for 2D x-ray technology in microelectronics arise with the development of smaller and more complex microelectronic packages. Analysts often find that the combination of small defect dimensions with a lot more interfering features in the field of view makes it increasingly difficult and sometimes impossible to image certain defects in non-destructive fashion. Such samples often require preparation that may produce artifacts. This fundamental limitation of 2D x-ray imaging technology is a common roadblock that has been driving the development efforts of x-ray CT for failure analysis in microelectronic devices. In the following sections we will review different applications in which x-ray CT has demonstrated capability to detect defects that are hard or impossible to detect by alternative methods [5].
1265
First Level Interconnect Solder Bump Non-Wet Detection Non-wet detection in solder joints at first level interconnects (FLI) using 2D x-ray is based on the rounded shape of solder ball indicating non-wetting issues. When due to the shape of the defect is such that it is difficult to differentiate between passing and failing bumps due to 2D xray imaging limitations, this type of non-wet is often referred as “invisible”. Figure 5 shows the physical cross section pictures of both passing and non-wet failing solder bumps. This figure also shows that the best 2D X-Ray image obtained using high magnification at an oblique view angle cannot detect these types of non-wet solder bumps
typical scanning time for solder bump non-wet detection in first level interconnects is around10 minutes per data set of 4mm2 Solder Joint Cracking at First Level Interconnect (FLI) Cracks in FLI solder bumps could appear in units under thermal stress for reliability evaluation. Electrical test cannot isolate partial cracks but just full solder joint cracks and the isolation resolution depends on the number of solder bumps between test points. Destructive techniques like Dye and Pull produce artifacts and cannot be used in packages with underfill. Physical cross-sectioning is a tedious and time consuming process that requires more than 3hrs for about ten FLI solder joints. The objective of this application development is to establish a non-destructive method to detect cracks in solder joints with faster throughput time (TPT) than using destructive techniques. Figures 7a and 7b show the virtual cross section and plane views of solder joints that were obtained for a sample size of 6cm x 6cm, without any sample preparation required. The TPT for this application is around 1 hr per corner for a data set of 2mm2. Notice that this is a large sample size for a FLI solder joint cracking detection application, which is important because imaging smaller sample size should require less data acquisition time.
Figure 5: On the left, physical cross section view of both a non-wet failing solder bump and a passing one. On the right, the best 2D x-ray image of those two bumps indicating that they cannot be detected. It is possible to isolate the electrical structure that has nonwet solder bumps by electrical testing for either dead open or high resistance electric failure modes. The technical gap is to further non-destructively isolate failing bump locations in the failing electric structure.
Figure 7. (a) Virtual cross section and (b) plane view of corner solder joints. Yellow dotted line on plane view indicates line of cross section.
Figure 6: Virtual 3D model, planar and cross section views of a solder bump non-wet that cannot be detected using conventional 2D x-rays. The objective of this application development was to establish a fast solution to detect solder bump non-wets along the failing structures using x-ray CT. The results are shown in Fig. 6 where the non-wet is clearly visible using either virtual cross section or planar grinding tomographic views. The
1266
Figure 8. X-ray CT image comparison between a failing solder joint (left images) and a passing solder joint (right images): virtual planar views (top) and virtual cross sectional views (bottom).
Figure 8 shows a comparison between virtual planar and cross sectional views for both a failing solder joint from the corner of the die and a passing solder joint from the center of the die. Results show that x-ray CT can provide a clear finger print of cracking issues, either using a virtual plane or a crosssectional view. In this slice the surface of a good solder joint looks smooth and uniform; whereas the slice surface of a failing bump looks uneven. A similar situation occurs with the virtual cross-sectional views. Ball Grid Array (BGA) Micro Voiding Another compelling application of x-ray CT is the detection of porosity or voiding in BGA at second level interconnects (SLI). Here the voiding size is typically larger than voiding at FLI, but the bigger volume of the solder joints makes it harder for 2D x-ray imaging to detect them; the typical maximum detectable void size for conventional 2D xray is around 40-50 microns, or worst depending on density of interfering features in the field of view. A sample having a metallic socket (Figure 9a) was selected for this application development as a worst case scenario in terms of x-ray absorption in which a non-destructive characterization of voiding in solder balls is required. 2D xray imaging can provide some information about voiding; however it is limited to a single top view with overlapping details as shown in Fig. 9b. This application requires obtaining a 2D x-ray image of the whole sample to select the solder balls to be inspected with x-ray CT. Once the area of interest has been determined, higher resolution scans can be performed in those areas to fully characterize voids as indicated in Figs. 9cd. Figure 9c shows a virtual cross section view of a solder ball, indicating planes where voids are formed. Virtual planar views can be obtained at any plane level to detect its voiding, as can be seen in Figs. 9d-f. Typical data collection time is around 15 minutes per region of interest of about 4mm2.
cracking issues (a), and also a virtual cross section confirming the existence of cracks and their plane location. Scanning times for this application is around 30 to 60 minutes, with a field of view of ~4mm2.
Figure 10. (a) Virtual plane view and (b) virtual cross section view of solder balls corresponding to yellow-doted line after thermal cycle stress testing, indicating typical finger print of solder joint cracking. Progressive Testing One of the compelling capabilities of x-ray CT is the possibility of performing defect inspection during reliability testing to provide feedback to predictive reliability models, as well as at different steps during process development. In order to demonstrate progressive testing capability, the solder bump area of a unit without underfill was imaged before and after thermal stressing. The absence of underfill helped in cracking the solder bumps during thermal stress. A routine was created to scan the units with high resolution, with a data acquisition time of about 90 minutes. Figure 11a shows the virtual planar view image of the same solder joint area obtained prior to thermal stress to verify that solder joints were not cracked and Fig. 11b shows a similar view after thermal stress displaying that solder joints with a finger print of bump cracking compared to the good joint and cracked joint show in Fig. 8.
Figure 9. (a) Board sample with metallic socket. (b) Best 2D x-ray image of voids. (c) Virtual cross section of solder ball and (d)-(f) virtual plane views of voids. BGA Solder Joint Cracking Another compelling capability of x-ray CT is the detection of solder ball cracking in the SLI BGA package. In this case, the typical sample dimensions are in the range of 1-2 inches wide. Figure 10 shows a planar view indicating solder ball
Figure 11. Comparison between virtual planar view of FLI solder joints (a) before and (a) after the applied thermal stress.
1267
Conclusions This paper presented a review of x-ray CT in failure analysis of microelectronics package and boards, with emphasis on the general operation principle, key design considerations, challenges for both 2D and 3D x-ray imaging, and compelling package and board failure analysis case studies. The small dimensions of the defects with increased interfering features in the field of view makes it increasingly difficult and sometimes impossible to image certain defects in a non-destructive fashion, which is a fundamental limitation of 2D x-ray imaging technology and the roadblock that has been driving the development of x-ray CT technology in microelectronics. A critical x-ray CT design factor is the use of proper schemes to compensate for magnification deterioration due to large sample sizes so the tool’s highest resolution can be achieved regardless of sample dimensions. A maximum energy of x-ray source of 150KV or higher is recommended to cover the diverse spectrum of microelectronics applications. On the applications side, progressive testing was also discussed as it appears to be a unique property of x-ray CT that can be important in microelectronics, especially for reliability assessment and process development. Further development in the x-ray CT technology roadmap should include improving spatial resolution to sub-micron levels to intercept the failure analysis needs in next generation package technologies, reducing timeto-data to levels of 10 minutes, increasing usability, and customizing data inspection. Acknowledgments The authors would like to acknowledge Andrew Proctor, Joaquin Aguilar-Santillan, Ranga Prasanna, Frank Toth Jr and Lars Skoglund from Intel Corporation for technical discussions regarding applications that were presented in this paper. References 1. D. Goyal, “X-Ray Tomography for Electronic Packages”, ISTFA, 2000 2. D. Goyal, Z. Fu, J. Thomas, “3D X-ray Computed Tomography for Electronic Packages”, ISTFA, 2003. 3. Scott, F. Duewer, S. Kamath, A. Lyon, D. Trapp, S. Wang, W. Yun, “A Novel X-ray MicrotomographySystem with High Resolution and Throughput for Non-Destructive 3D Imaging of Advanced Packages”, ISTFA, 2004, pp. 94-98. 4. S. Wang, F. Duewer, D. Scott, W. Yun, “X-Ray Microscopy for NDE Micro- and Nano-structures“, Proc. of SPIE, Vol 5766, pp 40-48, 2005 5. M. Pacheco, D. Goyal, “New Developments in HighResolution X-ray Computed Tomography for NonDestructive Defect Detection in Next Generation Package Technologies”, ISTFA 2008, pp 30-35, 2008 6. M. Pacheco, D. Goyal, “X-ray Computed Tomography for Non-Destructive Failure Analysis in Microelectronics”, International Reliability Physics Symposium 2010, pp IRPS10 2008, pp 252-258, 2010
1268