II. LITHIUM CHARACTERISTICS. 7. III. LITHIUM BROMIDE CHARACTERISTICS. 8. IV. J-13 VATER Bfc?(lRE AND AFTER EQUILIBRATION VITH PROV PASS ...
LA— 11691-MS DE90 003988
Characterization of Reactive Tracers for C-Wells Field Experiments I: Electrostatic Sorption Mechanism, Lithium H. R. Fuentes W. L. Polzer E. H. Essington B. D. Newman
DISCLAIMER This report was prepared as an account of work sponsored by an agency of the United States Government. Neither the United States Government nor any agency thereof, nor any of their employees, makes any warranty, express or implied, or assumes any legal liability or responsibility for the accuracy, completeness, or usefulness of any information, apparatus, product, or process disclosed, or represents that its use would not infringe privately owned rights. Reference herein to any specific commercial product, process, or service by trade name, trademark, manufacturer, or otherwise does not necessarily constitute or imply its endorsement, recommendation, or favoring by the United States Government or any agency thereof. The views and opinions of authors expressed herein do not necessarily state or reflect those of the United States Government or any agency thereof.
Los Alamos National Laboratory Los Alamos.New Mexico 87545
CONTENTS LIST OF FIGURES LIST OF TABLES
vi viii
ABSTRACT
1
1.0
INTRODUCTION
2
2.0
TRACER SELECTION CRITERIA
5
3.0
LITHIUM
6
4.0
MATERIALS AND METHODS
13
4.1 Prow Pass Samples and J-13 Water 4.2 Procedures 4.2.1 Adsorption Kinetics 4.2.2 Desorption Kinetics 4.2.3 Equilibrium Adsorption 4.2.4 Equilibrium Desorption 4.2.5 Potentiometric Titration 4.2.6 Electrophoresis 4.2.7 Abrasion Effects 4.3 Models 4.3.1 Isotherms 4.3.2 Thermodynamics 4.4 Pre-experimental Geochemical Modeling
13 18 18 20 21 21 21 22 24 26 26 30 34
RESULTS AND DISCUSSION
37
5.1 Kinetics Experiments 5.2 Equilibrium 5.2.1 Sorption Calculations 5.2.2 Isotherm Evaluation 5.2.3 Thermodynamic Parameter Estimation 5.2.4 Deso-ption 5.3 Potentiometric Studies
37 38 38 40 50 60 63
SUMMARY AND CONCLUSIONS
71
5.0
6.0
ACKNOWLEDGMENTS
74
REFERENCES
76
APPENDIX A. ANALYTICAL INSTRUMENTATION APPENDIX B. ESTIMATES OF LITHIUM ADSORPTION AND DESORPTION EQUILIBRIUM CONCENTRATIONS APPENDIX C. EQUILIBRIUM CONCENTRATIONS AND MODELING VARIABLES . . . . APPENDIX D. STATISTICAL AND MODEL PARAMETER ESTIMATES FOR ISOTHERMS .
81 85 95 113
LIST OF FIGURES Figure 1.
Observed and predicted adsorption of lithium on a Prow Pass suspension in J-13 well water at 25°C for an initial concentration range of 1 to 2000 fig Li mL and a solid-to-liquid ratio of 1:20. Adsorbed lithium is determined in two ways: (1) based on measured lithium in solution (Li) and (2) based on a combination of measured lithium and other cations in solution (best estimate). Predicted lithium is based on the Modified Freundlich isotherm 41
Figure 2.
Observed and predicted adsorption of lithium on a Prow Pass suspension in J-13 well water at 38°C for an initial concentration range of 1 to 2000 fig Li mL" and a solid-to-liquid ratio of 1:20. Adsorbed lithium is determined in two ways: (1) based on measured lithium in solution (Li) and (2) based on a combination of measured lithium and other cations in solution (best estimate). Predicted lithium is based on the Modified Freundlich isotherm 42
Figure 3.
Observed and predicted adsorption of lithium on a Prow Pass suspension in J-13 well water at 45°C for an initial concentration range of 1 to 2000 fig Li mL and a solid-to-liquid ratio of 1:20. Adsorbed lithium is determined in two ways: (1) based on measured lithium in solution (Li) and (2) based on a combination of measured lithium and other cations in solution (best estimate). Predicted lithium is based on the Modified Freundlich isotherm 43
Figure 4.
Observed and predicted adsorption of lithium on a Prow Pass suspension in J-13 well water at 25°C for an initial concentration range of 1 to 150 fig Li mL" and a solid-to-liquid ratio of 1:10. Adsorbed lithium is determined in two ways: (1) based on measured lithium in solution (Li) and (2) based on a combination of measured lithium and other cations in solution (best estimate). Predicted lithium is based on the Modified Freundlich isotherm 44
Figure 5.
Observed and predicted adsorption of lithium on a Prow Pass suspension in J-13 well water at 38°C for an initial concentration range of 1 to 150 fig Li mL" and a solid-to-liquid ratio of 1:10. Adsorbed lithium is determined in two ways: (1) based on measured lithium in solution (Li) and (2) based on a combination of measured lithium and other cations in solution (best estimate). Predicted lithium is based on the Modified Freundlich isotherm , 45
vi
Figure 6.
Observed and predicted adsorption of lithium on a Prow Pass suspension in J-13 well water at 45°C for an initial concentration range of 1 to 150 fig Li mL~ and a solid-to-liquid ratio of 1:10. Adsorbed lithium is determined in two ways: (1) based on measured lithium in solution (Li) and (2) based on a combination of measured lithium and other cations in solution (best estimate). Predicted lithium is based on the Modified Freundlich isotherm 46
Figure 7.
Observed and predicted adsorption and desorption of lithium on a Prow Pass suspension in J-13 well water at 38 C for an initial concentration range of 1 to 2000 fig Li mL" and a solid-to-liquid ratio of 1:20. Predicted lithium is based on the Modified Freundlich isotherm 64 Observed and predicted adsorption and desorption of lithium on a Prow Pass suspension in J-13 well water at 38°C for an initial concentration range of 1 to 150 fig Li mL" and a solid-to-liquid ratio of 1:10. Predicted lithium is based on the Modified Freundlicb isotherm 65
Figure 8.
Figure 9.
Potentiometric titration of Prow Pass in suspension with J-13 well water and NaClO. electrolyte at 38°C without the addition of lithium
67
Figure 10. Potentiometric titration of Prow Pass in suspension with J-13 well water and NaC10 4 electrolyte at 38°C with the addition of 900 fig Li mL" 1
68
Figure 11. Electrophoretic behavior of a colloidal suspension of Prow Pass in J-13 well water and NaClO. electrolyte at 38°C with the addition of 900 fig Li mL Figure 12. Electrophoretic behavior of a colloidal suspension of Prow Pass in J-13 well water and NaC10 4 electrolyte at 38°C without the addition of lithium
69
70
vii
LIST OF TABLES I.
GENERIC CLASSIFICATION OF ADSORPTION PROCESSES
3
II.
LITHIUM CHARACTERISTICS
7
III.
LITHIUM BROMIDE CHARACTERISTICS
8
IV.
J-13 VATER Bfc?(lRE AND AFTER EQUILIBRATION VITH PROV PASS MATERIALS (ng mL" J )
V. VI. VII.
VIII.
15
PHYSICOCHEMICAL CHARACTERIZATION OF PROV PASS TUFF SAMPLES (20 kcal mole" are indicative of chemical sorption. The ZPC can be determined from potentiometric titrations of electrolyte solutions in contact with the sorbent material and from electrophoretic measurements. If the presence of the tracer displaces the ZPC, then chemical sorption is indicated; if the ZPC is not displaced, then physical sorption is indicated. The objective of the laboratory efforts is to characterize lithium (Li), introduced as lithium bromide (LiBr), as a candidate tracer of the electrostatic sorption mechanism for the field experiments. Laboratory batch experiments were conducted to evaluate and to model the extent of lithium adsorption to prepared samples from the Prow Pass Member of Yucca Mountain in J-13 well water (groundwater from the Yucca Mountain vicinity used as reference water in most geochemical investigations) by isotherms. In an attempt to demonstrate the physical nature of the adsorption of lithium, additional tests, including desorption in solutions of different ionic strengths and potentiometric studies, were conducted.
2.0 TRACER SELECTION CRITERIA The selection of a tracer that adsorbs predominantly by physical adsorption was based on the following criteria: •
physicochemical properties,
•
environmental regulations,
•
detection, and
•
cost.
The most important physical property is the reaction of the tracer with the rock matrix. Bowever, the tracer should be sufficiently mobile to travel from the injection well to the observation wells in a reasonable period of time with reasonable groundwater flow rates. Thus, conventional tracers (5) that migrate with groundwater velocities are not adequate. On the other hand, the tracer must be stable so that other processes (for example, microbial uptake, complexation, and volatilization) do not complicate the monitoring, measuring, and modeling of the tracer. One criterion for the selection of tracers is obtaining approval from environmental agencies (federal, state, and local). Thus, chemicals included in major regulatory actions and their amendments have not been considered. Organic compounds with significant volatility and potential for complexation and compounds subject to biotransformation have also been excluded. These constraints leave limited choices. Radioactive tracers that offer advantages, for example, simpler analysis and more realistic simulation of repository releases, have been excluded from consideration for field tests because of their potential rejection by regulatory agencies.
3.0 LITHIUM Literature searches and consultations with experts indicate that lithium as LiBr may satisfy most of the requirements discussed in Section 2.G. Tables II and III contain information on lithium and lithium bromide. This information includes physicochemical, thermodynamic, and toxicological characteristics, as well as references to the more pertinent federal environmental regulations. Lithium bromide dissolves and speciates into Li and Br in water, thus producing two tracers, one reactive (nonconservative) and one nonreactive (conservative). LiBr is soluble in water at sufficiently high concentrations for easy use in field tests (i.e., hundreds of /jg mL ) . Lithium does not appear to form complexes that can complicate its chemistry and analytical identification. Additionally, its low potential for microbial conversion increases its traceability in laboratory and field studies. As in the case of the rest of the alkali elements, lithium has a single electron in the outermost energy level of its atom. This electron, which is easily detachable, causes an extremely reactive chemical character. Because of the small size of its atom and ion, the behavior of lithium is transitional between the behavior of the alkali metals and that of the alkaline earth metals. These groups present a high ionic potential (ratio of ion radius to ion charge), which implies that lithium is expected to be highly soluble and more easily weatherable (leachable) than transition metals, aluminum cations, and oxyanions (15). General information on lithium is available from a number of sources. Thermodynamic data include enthalpy, entropy, and free energy of formations for lithium and lithium species (16, 17, 18). Information on the distribution of lithium in the lithosphere and in specific geochemical systems has also been documented (19, 20). 6
TABLE II LITHIUM CHARACTERISTICS
Physicochemical Atomic number Atomic weight Specific gravity Hydrated radius Ionic radius Heat of solution Natural isotopes
3 6.941 0.53 at 20°C (solid) 3.4 A 0.68 A -17,500 cal g 6 (7.47. abundance), 7 (92.67. abundance)
Thermodynamic (Li ). AG° f = -70.1 kcal mole" 1 at 298.15K AH° f = -66.6 kcal mole'1 at 298.15K S° = 3.2 cal deg"1 mole"1 at 298.15K Toxicity • • • • •
The lithium ion may injure kidneys, especially if sodium intake is limited. Effect of low concentrations on aquatic life is unknown. Waterfowl toxicity data: not available. Food chain concentration potential: none. CAS RN: 74 39-93-2, NIOSH No: OJ 5540000
Environmental Regulations Lithium is not included in the Clean Water Act, the Resource Conservation and Recovery Act, the Superfund Amendments Reauthorization Act or the Safe Drinking Water Act. It is inventoried in the Toxic Substances Control Act. Sources: References 6, 7, 8, 9, 10, 11, 12
TABLE III LITHIUM BROMIDE CHARACTERISTICS
Phvsicochemical
Heat of solution
White hygroscopic granular powder 86.85 550°C 1265°C 3.464 at 25°C 177 g at 20°C 202 g at 40°C 224 g at 60°C 11.4 cal mole" (water)
Hydration states
Mono, di, tri and penta hydrate
Six-fold coordination
Bond length: 2.75 Angstrom
Form Molecular weight" Melting point Boiling point Specific gravity Solubility in 100 g water
Thermodvnamic 4G° f = -94.95 kcal mole" 1 at 298.15K 4H° f = -95.61 kcal mole" 1 at 298.15K S° = 22.9 cal mole" 1 at 298.15K Toxicitv
LD 50 = 1,680 mg kg-1 (tests with mice, subcutaneous) • Large doses may cause CNS (central nervous system) depression. Chronic adsorption may cause skin eruptions and CNS disturbances because of bromide. May also cause disturbed blood electrolyte balance. • CAS RN: 75 50-35-8; NIOSH No: OJ 5755000 Environmental Regulations Lithium bromide is not included in the Clean Vater Act, the Resource Conservation and Recovery Act, the Superfund Amendments and Reauthorization Act (lithium chromate, lithium hydride and bromine are included), or the Safe Drinking Vater Act. It is inventoried in the Toxic Substances Control Act. Sources: References 6, 9, 10, 11, 12, 13, 14
Sorption information for lithium on soils and rocks is scarce. A survey of the literature indicates a lack of pertinent investigations. The survey used computer searches to inventory journals in the fields of environmental science or engineering, soil chemistry, and geochemistry. This lack of success may be because lithium is not an element of concern in agricultural production and is not considered a contaminant according to environmental regulations. Two references (21, 22) deserve mention because they constitute recent summaries on the sorption of inorganic elements by materials of the subsurface environment. The first summary (21) reviewed literature from approximately 500 papers on cation exchange in soil systems. Selectivity coefficients and estimated thermodynamic parameters were compiled for soils and soil components in well-defined systems. Lithium was reported only as the resident cation of Li-clays in exchanges with alkali and ammonium ions NH, in solutions. The estimates of the excess free energy indicate that the exchange favors the adsorption of all the ions over lithium. A second recent bibliography was completed by the Energy Power Research Institute (EPRI) (22). This bibliography contained over 350 references, published before February 1983, dealing with chemical and biological attenuation mechanisms for 21 inorganic elements; lithium was not included. This survey found that adequate data exist to make quantitative estimates for only a few solutes and that attenuation is expected to vary as a function of the chemical element and the composition of the subsurface media. The above limited information on lithium illustrates its lack of priority in sorption research. Most available basic information on the adsorption of lithium by natural adsorbents refers to its inclusion in studies to characterize differences of behavior among ions. Investigations as early as 1922 showed low exchange of lithium for barium and calcium in soils and high exchange of lithium for ions 9
with atomic weights higher than those of barium and calcium (23). Later investigations (24) examined the influence of solution concentration and the nature of the interacting ions on lithium adsorption. Selectivity sequences are used to document the effects of ion characteristics or behavior on adsorption preference of ions for an adsorbent. Such sequences included valence, equivalent volume, polarizability, interactions with resident ions, and complex formation. Adsorption of lithium does not seem to involve a strong surface interaction. For instance, some studies strongly suggest that lithium shows a lower preference for natural ion exchangers than do the rest of alkali cations, namely, sodium (Na T ), potassium (K ), rubidium (Rb ) , and cesium (Cs+)(25). Helfferich (26) reported that exchangers show the lowest selectivity for lithium among most common cations. Other findings from investigations with soils and tuff report a low adsorption of lithiurc (27, 28). Low adsorption can be an advantage for a reactive tracer because it will result in lower retardation, which shortens breakthrough periods in field tests. The general order of preference of monovalent cations by smectites (29) for the Group IA metal cations is
Cs + > Rb + > K + ft NH 4 + > Na + > Li + .
(3.1)
This sequence indicates a greater attraction of less hydrated cations to the interlayer of smectites. The less hydrated cations can more closely fit the cavity of the smectite six-membered tetrahedral rings. The sequence is explained at the molecular level (30) by the principle of hard and soft acids
10
and bases. Lithium is the hardest acid in the selectivity sequence, so it has less ability to exchange its solvent water molecules for the oxygen ions (soft base) in surface functional groups than do softer acids such as cesium. A general selectivity sequence of most common cations by general-purpose cation exchangers is the following (26):
Ba 2 + > Pb 2 + > Sr 2 + > Ca 2 + > Ni 2 + > Cd 2+ > Cu 2 + > Co 2 + > Zn 2 ^ > Mg 2 + , > UD 2 2 + > Tl + > Ag + > Cs + > Rb + > K + > NH 4 + > Na + > Li + ,
(3.2)
This selectivity shows lithium with the lowest preference. In addition, lithium is also the least strongly held cation on synthetic zeolites, compared with most of the other alkali elements and with alkaline earth elements. Eisenman (25) developed the concept of "equivalent anion" to explain relative bonding strengths of cations in various types of exchangers. From the combination of cation size, cation charge, "equivalent anion," and hydration energies for the cations, predictions for the bonding energies of the alkali elements were made for natural exchangers. The predictions, expressed as free energies, compared fairly well with experimental measurements. The analysis predicts the bonding energies of all alkali ions to clays, zeolites, and feldspars. It predicts lithium to be the least adsorbed ion in the presence of sodium, potassium, cesium, or rubidium. The limited current toxicological information for lithium bromide indicates that toxicity to aquatic life at low lithium concentrations has not been demonstrated and that bioaccumulation in food chains is not expected. The absence of regulatory concern in the major environmental acts suggests that the use of lithium as a tracer should be feasible. This feasibility
11
could be ensured by the use of low concentrations and by effective recovery of injected solutions. Of all the pertinent Federal acts, only the Toxic Substances Control Act (TSCA) includes lithium as part of an inventory. Lithium is not included in the 129 priority toxic pollutants (31). Although regulations do not specifically address lithium, it has been known to occur in groundwater, as reported by the Office of Technology Assessment (32). Critical to the constraints set by regulations is the consideration of groundwater quality standards defined by both State and local regulations in Nevada that may apply to the Yucca Mountain area. The role of State and local regulations is not discussed in this study. Lithium in aqueous solutions can be determined by several conventional analytical techniques. Of these (33, 34), spectroscopy (e.g., atomic emission spectroscopy) and chromatography (e.g., ion chromatography) offer competitive analytical costs and low limits of detection. Limits of detection can be at least within the parts per billion range (ppb) but can be improved by concentration techniques. The background concentration of lithium in J-13 water is low (about 0.05 fig mL ) compared with an operational range at least two orders of magnitude higher. The cost of lithium bromide is low enough not to be of any importance in tracer selection. In summary, lithium as LiBr appears to be an excellent candidate tracer for hydrogeochemical investigations in Yucca Mountain because of its stability and weak adsorption. It may show enough adsorption to simulate the migration of weakly reactive tracers in the subsurface. This low degree of sorptivity has been demonstrated in intermediate-scale (caisson) experiments conducted with unsaturated and saturated Bandelier Tuff (28). Estimates for lithium retardation factors are slightly greater than one (up to about 1.3) when experimental breakthrough curves (within 6 m of traveling distance from the 12
source) are fitted to a one-dimensional advective-dispersive equation (28). Simultaneously, lithium may be more acceptable by regulatory agencies for use in groundwater studies than other tracers, is detectable in the fig I
range
by conventional analytical equipment, and is inexpensive. Currently available equipment allows adaptation to continuous-flow monitoring, which speeds up and improves the characterization of breakthrough profiles in the field.
4.0
MATERIALS AND METHODS This section describes the Prow Pass samples and the J-13 well water used
in all of the investigations. Information about experimental procedures and the application of geochemical modeling to experimental design is also presented in this section.
4.1
Prow Pass Samples and J-13 Vater Prow Pass material used in these experiments consisted of cuttings
collected from drill hole UE-25p#l about 630 m east of the C-wells complex. Fifteen sets of cuttings from depths between 1800 and 1950 feet (549 and 594 m) were selected because they represent the Prow Pass Member, which is the first geological barrier to radionuclide migration in the saturated zone (35). The general mineralogical composition of these samples is dominated by feldspars, quartz, and kaolinites, with small quantities of smectite, mica, and hematite (36). An analysis of a washed sample of cuttings (see next paragraph) showed larger percentages of feldspars, quartz, and cristobalite, with small quantities of smectite and hematite (37). This difference cannot be explained yet, but it may be related to variability of sampling.
Compared
with other cuttings from the drill holes in the C-wells area, these samples appeared to have the simplest mineralogic composition, helping to minimize 13
uncertainty in the laboratory but reducing the representativeness of the results for field projections. The 15 samples of cuttings were washed with distilled water and composited to form sufficient material for the experiments. During drilling, the cuttings may have become contaminated with overlying rock materials and drilling material residues and additives that would interfere with the experiments. Ass much of the contaminating residue and additives as possible was removed by suspending the cuttings in distilled water and gently sonifying and decanting the fines after a period of settling. Thirty such treatments were necessary to remove the fine materials believed to contain the drilling contaminants. The Prow Pass material was then ground with a ceramic pulverizer to pass a 500-fim stainless steel sieve. The ground material was conditioned with eight successive J-13 water washes; key chemical constituents of the washes were monitored for completeness of conditioning. Table IV summarizes the key constituents of the J-13 water as collected and after the first and eighth 24-h equilibrations with treated Prow Pass samples. Based on the limited change over the 8 days of treatment, it was concluded that pseudo-equilibrium had been reached within the first 24 h of contact time. The data from the eighth 24-h equilibration represent the background composition and are used as a reference for experiments with J-13 well water and Prow Pass materials. The 997. lithium will be present as the free ion Li + between pH 7 and 9 (Table VII). The species studied were liDB, LiSO4~, Li 2 SD 4 , LiCl, LiML, LinCOo, and LiBr. The equilibrium constants for these species were derived from reported free energy values (18) and were included in the thermodynamic data base of PHREEQE. The conclusions from these geochemical simulations permitted a decrease in the number of chemical analyses of ions in the experiments. The simulations also supported the use of total lithium as a good measure of Li + for lithium adsorption.
35
TABLE VII PREDICTIONS FOR LITHIUM DISTRIBUTION IN PROV PASS AND J-13 VATER ADSORPTION EXPERIMENTS AT 38°C (Li = 2000 fig mL" i A s LiBr)
Species
pH 7
Li+ LiOH
LiSO4"
1.4 6.6 3.3
X
Li 2 SO 4
7.0
X
LiCl LiNOg
1.4 2.2
X X
Li 2 CO 3
4.4
X
LiBr
8.4
X
36
X X
Concentration (mole L"l) pH 8 10" 1 10" 8 10' 5 .7 10" 5 10" 6 10" 8 -4
pH 9
1.4 x io-i 4.6 x 10" 7 3.3 x 10" 5
1.4 x 10" 1 1.4 xlO" 6 3.3 x 10" 5
7.0 x 10" 7 1.4 x -5
7.0 x 10" 7
1.1
X 10" 5
1.4 x 10" 5 1.2 x 10" 5
2.9 x
_7
8.0 x 10"7
8.4 x
-4
8.4 X10-"
5.0 RESULTS AND DISCUSSION This section presents the experimental results and their analysis and interpretation.
Emphasis is on modeling of the lithium data by isotherms and
estimation of thermodynamic constants. These constants--the relative behavior between adsorption and desorption, and potentiometric studies--are used to classify the controlling sorption mechanism as either physical or chemical.
5..t Kinetics Experiments The kinetics experiments had two main objectives: first, to determine minimum equilibration times; second, to provide data for (a) evaluating the role of film transfer and internal diffusion and (b) estimating activation energies. Batch-tube kinetics experiments conducted at 38°C provided a first measure of the minimum equilibration time needed for adsorption. Two initial lithium solution concentrations, 5 and 250 fig ml
, were used to estimate an
equilibration period. Although equilibrium was reached rapidly (about 2 hours), a 24-hour equilibrium period was selected as a standard for all adsorption equilibrium experiments. Desorption kinetics was evaluated for each of the above adsorption experiments. The results indicate that most desorption ,(-7570 occurs within 6 hours, with additional desorption occurring through the 96-hour sampling time. An analysis of the kinetics data from the controlled reactors has not been performed for this report. The quality and quantity of the kinetics data have not been evaluated for usefulness in estimating rates for film transfer, particulate diffusion, or surface reaction. A general inspection of the data suggests that it may be possible to model adsorption kinetics. However, the lacK of sufficient observations during the first 12 hours makes the desorption 37
data inadequate for modeling of rates. Both adsorption and desorption kinetics data appear to be of better quality for the controlled reactors than for the batch tubes.
5.2 Equilibrium Two sets of equilibrium experiments were performed at three temperatures (25°C, 38°C, and 45°C; 38°C is the average temperature of the Yucca Mountain aquifer water). One set was performed over an initial concentration range of 1 to 2000 fig mL
and at a solid-to-liquid ratio of 1:20. The amount adsorbed
is based on the difference between the initial concentration and the equilibrium concentration. Because adsorption was low, the difference in concentration was minimal relative to the analytical error of concentration measurements. In order to minimize the effect of the analytical error, the solid-to-liquid ratio was increased to 1:10 (to increase the number of potential adsorption sites per volume of tracer) and the initial concentration range restricted to 1-150 fig mL
to enhance the difference in concentrations
compared with the analytical error of concentration measurement. The other set of experiments was performed over an initial concentration range of 1 to 150 fig ml" and at a solid-to-liquid ratio of 1:10. These experiments were performed to determine the extent of sorption and to select suitable isotherms that can be applied to transport modeling. Also, thermodynamiij parameters were calculated from the sorption data at the three temperatures to help in differentiating between physical and chemical sorption.
5.2.1
Sorption Calculations The amount of lithium sorbed to the Prow Pass solid from J-13 well water
spiked with concentrations of lithium was determined from the difference in 38
concentration of lithium in the solution before equilibration and that in the solution concentrations after equilibration. Preliminary evaluation of the sorption data shows large variability at the high solution concentrations after equilibration. The variability is attributed to experimental conditions and to the error associated with the analytical data. For example, the difference between the initial concentration of lithium and that after equilibration can be shown to be within the analytical error of the measured concentrations for the experimental conditions 1000 /igLi mL"
initial
concentration, 20 mL of solution, 1 g tuff, 1120 fig Li g" maximum sorption (CEC), and 37, analytical error. Thus the variability associated with that difference is very large. A different procedure, used to determine the amount of lithium iorbed, is based on the assumption that the amount of lithium adsorbed is equal to the amount of cations desorbed from the solid. The data obtained by the two procedures are given in Appendix B (Tables B-I through B-III). The values obtained by calculating differences in lithium concentration are higher at low concentrations of lithium than those obtained by calculating the differences in summed cations. Small differences existed between initial and equilibrated concentrations of some of the individual cations. Those differences were well within analytical error; thus large errors could occur. Some calculated differences gave negative values. In those cases a sum of differences in concentrations resulted in a lower summed concentration of desorbed cations. The difference in lithium concentrations was used in the low-concentration
39
range and the difference in summed cations was used at the high-concentration range for the best estimate of lithium sorbed.
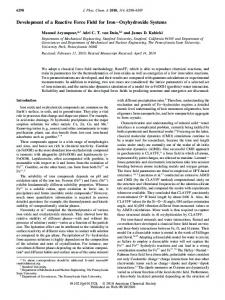
5.2.2 Isotherm Evaluation The four isotherms, Linear, Langmuir, Freundlich, and Modified Freundlich, were used to model the two sets of equilibrium experiments discussed above. Linear, langmuir, and Freundlich were used because of their widespread use in modeling sorption and in the coupling of the sorption isotherms to transport models. The fourth isotherm, the Modified Freundlich, was used because of its theoretical implications. Appendix C compiles all the data from the adsorption and desorption experiments used in the fitting of the four isotherms. The statistical data on the modeling of sorption by the four isotherms indicate that the sorption data based on best estimates give the better index of determination (R ) and coefficient of variation (CV). All four isotherms o gave R of >0.80. The CV were 55 percent or better. The Freundlich and o
Modified Freundlich isotherms gave the best R and CV values, with the Freundlich giving slightly better CV values. Detailed statistical and
isotherm parameter data are given in the Tables in Appendix D. Figures 1 through 6 show the results of modeling the data with the Modified Freundlich isotherm. The regression of the best estimate data shows the best variability. The modeling analyses indicate that the sorption of lithium can be effectively represented by all four isotherms. However, the analysis of the Modified Freundlich isotherm provides additional information on the prediction of the extent and heterogeneity of sorption. This extent and heterogeneity of sorption provides an insight into the transport of lithium in
40
n — 0- .
X
o —-
UObs. U Pred. Best Est. Obs. Best Est Pred.
-1-
a
a &
-2-
3
n -3-
-1
—i
1
1 Log Cone.
2 mL~"')
Figure 1. Observed and predicted adsorption of lithium on a Prow Pass suspension in J-13 well water at 25°C for an initial concentration range of 1 1 to 2000 figLi ml" and a solid-to-liquid ratio of 1:20. Adsorbed lithium is determined in two ways: (1) based on measured lithium in solution (li) and (2) based on a combination of measured lithium and other cations in solution (best estimate). Predicted lithium is based on the Modified Freundlich isotherm.
41
2 D —1 • O —
Li Obs. U Pred. Beat Eat. Oba. Beat Eat. Pred.
o
0X
a -1 ••
3
_2 - • -3
-1 Log Cone, (jiq m L 1 ) Figure 2. Observed and predicted adsorption of lithium on a Prow Pass suspension in J-13 well water at 38°C for an initial concentration range of 1 to 2000 figLi ml" and a solid-to-liquid ratio of 1:20. Adsorbed lithium is determined in two ways: (1) based on measured lithium in solution (Li) and (2) based on a combination of measured lithium and other cations in solution (best estimate). Predicted lithium is based on the Modified Freundlich isotherm.
42
2 O
1V) I
O —
U Obs. Li Pred. Best Est. Oba. Best Est. Pred,
0 ••
o - 1 Q
-2-
-3 -1 Log Cone, {jjq m L~~11 )
Figure 3. Observed and predicted adsorption of lithium on a Prow Pass suspension in J-13 well water at 45°C for an initial concentration range of 1 to 2000 ng Li mL and a solid-to-liquid ratio of 1:20. Adsorbed lithium is determined in two ways: (1) based on measured lithium in solution (Li) and (2) based on acombination ol measured lithium and other cations in solution (best estimate). Predicted lithium is based on the Modified Freundlich isotherm.
43
• I en I
1
o ——
Li Obs. Lf Pred. Best Est. Obs. Best Est. Pred.
2 2o -2+ o
1
-1
0
1
_
1 Log Cone, (pq mL"
Figure 4. Observed and predicted adsorption of lithium on a Prow Pass suspension in J-13 well water at 25°C for an initial concentration range of 1 to 150 /tg Li mL and a solid-to-liquid ratio of 1:10. Adsorbed lithium is determined in two ways: (1) based on measured lithium in solution (Li) and (2) based on a combination of measured lithium and other cations in solution (best estimate). Predicted lithium is based on the Modified Freundlich isotherm.
44
D
O —
Li Obs. U Pred.
Best Eat. Obs. Best Est. Pred.
I x a
XL
en o
Log Cone, (jiq m L ')
Figure 5. Observed and predicted adsorption of lithium on a Prow Pass suspension in J-13 well water at 38°C for an initial concentration range of 1 to 150 fig Li mL* 1 and a solid-to-liquid ratio of 1:10. Adsorbed lithium is determined in two ways: (1) based on measured lithium in solution (Li) and (2) based on a combination of measured lithium and other cations in solution (best estimate). Predicted lithium is based on the Modified Freundlich isotherm.
45
D
I V) \ X
-1 •
O —
U Obs. Li Pred. Best Est. Obs. Best Est. Pred
o w
en o
—2-
-3
-1
1 Log Cone, (/ig ml_~ ')
Figure 6. Observed and predicted adsorption of lithium on a Prow Pass suspension in J-13 well water at 45°C for an initial concentration range of 1 to 150 fig Li ml and a solid-to-liquid ratio of 1:10. Adsorbed lithium is determined in two ways: (1) based on measured lithium in solution (Li) and (2) based on a combination of measured lithium and other cations in solution (best estimate). Predicted lithium is based on the Modified Freundlich isotherm.
46
laboratory column and field tests. A higher degree of heterogeneity {fl-value in the Modified Freundlich isotherm approaches zero) implies that a wider spectrum of retardation factors will occur in transport. This spectrum will have an average extent of retardation as defined by the Kn-value of the same isotherm. Consequently, the following analysis uses the Modified Freundlich isotherm as a reference in predicting the behavior of lithium in transport. The extent of sorption is related to any of the K parameters of the four models, for example, K in the Freundlich isotherm and k in the Langmuir isotherm. For a better understanding of the relative retardation of lithium predicted by the four isotherms, the retardation parameters were normalized or transformed to those of the linear isotherm, K., and the Modified Freundlich isotherm, IL and /?. The isotherm parameters K,, Kg, and 0 are given in Table VIII, along with the transformations. The results indicate that all values of K. are 2 mL g" or less; the Langmuir isotherm gives the highest values and the Freundlich gives the lowest values. Retardation can be expressed by the following equation
Rf = 1 + - p ,
(5.1)
where R^ is the retardation factor and is defined as the mean velocity of the moving liquid relative to the mean velocity at which the tracer moves; />, is the dry bulk density of the medium; and 9 is the volumetric moisture content. In general, a K, of 2 or less indicates little sorption-caused retardation of the tracer. Thus lithium appears to be a suitable tracer for the C-wells field test because of low sorptivity. 47
TABIE VIII A COMPARISON OF ESTIMATED PARAMETERS OF FOUR ISOTHERM MODELS FOR THE ADSORPTION OF LITHIUM ON A PROW PASS SUSPENSION IN J-13 WELL WATER FOR AN INITIAL C^CENTRATION RANGE OF 1 TO 2000 jag Li inL"1 AND A SOLID-TO-LIQUID RATIO OF 1:20
25°C
Linear
0.43
3.9X10
-3
2.0
Iangnuir
2.8X10
-2
Freundlich
3.3x10
Modified Freundlich
0.98
38°C
3.0x10 8.9x10"
1.0 1.0
0.43 1.6
0.72 0.82
2. oxio" 0.73
2
45°C
3.9x10 ' 2. 3xlO~3
1.0 1.0
0.27 1.2
1.8xlO~5
0 .68
1.0x10⁻²
6.6xlO~
4
0 .77
Transformations: Linear:
K
d
= K
d
Freundlich: K 'd
K
1/N
S.
max K
max 1/N
max Langmuir:
K. • Ids
Modified Freundlich: Kd -
0.33
-4 -3
2.4X10
1.0
2.4X10
1.0
9.5x10
0.65
.-4
2.8x10
0.70
Based on theoretical considerations, the K« parameter is a measure of the mean energy sorption of lithium, and the /? p?rameter i6 a measure of the distribution or spread of individual energies about the mean. Thus under flow conditions, IL is a measure of the sorption-caused retardation of the tracer and 0 is a measure of the sorptive dispersion caused by the heterogeneity of sorption; this dispersion is in addition to any hydrodynamic dispersion that may occur. Thus the comparison of 1L and 0 parameter values in Table VIII for the linear, Langmuir, and Freundlich isotherms (1 to 2000 fig Li mL ) can be interpreted as follows. 1.
The Freundlich isotherm underestimates retardation and overestimates sorptive dispersion.
2.
The Langmuir isotherm overestimates retardation and underestimates sorptive dispersion.
3.
The Linear isotherm underestimates both retardation and sorptive dispersion.
The effects of overestimation and underestimation can only be inferred from these analyses. Proper statistical discrimination analysis in combination with column experiments is needed to identify the best isotherm under flow conditions. The statistical and modeling results for the concentration range 1 to 150 fig Li mL" and a solid-to-liquid ratio of 1:10 are given in Appendix D, Tables D-V through D-IX, for the Linear, Langmuir, Freundlich, and Modified Freundlich isotherms, respectively. The data are based on lithium analysis and best estimates, as was the case in the range 1 to 2000 fig Li mL
. The
results indicate that the statistics (R and CV) in general do not differ greatly from the results for the l-to-2000-/jg-Li mL
data set. Overall, the
best-estimate data, as determined from a combination of lithium data and the 49
summed cation data, can also be represented by the four isotherm expressions. Table IX summarizes the estimated parameters for the four isotherms within this concentration range. The parameters are also expressed in terms of K,, Kp, and /?, in order to compare the expected outcomes of using specific isotherms in transport modeling. As in the case of the l-to-2000-/zg-Li mL data set, the interpretation given to these data is as follows. 1.
The Freundlich isotherm underestimates retardation and overestimates sorptive dispersion.
2.
The langmuir isotherm overestimates retardation and underestimates sorptive dispersion.
3.
The Linear isotherm overestimates retardation and underestimates sorptive dispersion.
A comparison of these results with those of the l-to-2000-/rg-Li mL" range indicates that in both cases the Freundlich isotherm underestimates retardation and overestimates sorptive dispersion. The Langmuir isotherm model overestimates retardation and underestimates sorptive dispersion for both cases. However, the overestimation of retardation appears significantly greater for the 1- to-150- /ig- Li mL mL
experiment than for the l-to-2000-^g-Li
experiment. The Linear isotherm overestimates retardation in the former
but underestimates retardation for the latter, even though the amount of overestimation and underestimation appears to be small. Consequently, care should be exercised when selecting an isotherm among several possible alternatives, regardless of their relatively good correlation statistics.
5.2.3 Thermodynamic Parameter Estimation Thermodynamic parameters were estimated for the lithium sorption of the Prow Pass medium from J-13 well water for the concentration range of 1 to 50
TABLE IX A COMPARISON OF ESTIMATED PARAMETERS OF FOUR ISOTHERM MODELS FOR THE ADSORPTION OF LITHIUM ON A PROW PASS SUSPENSION IN J-13 WELL WATER FOR AN INITIAL OMIC3ENTRATION RANGE OF 1 TO 150 M g Li iriL*"1 AND A SOLID-TO-LIQUID RATIO OF 1:10
25°C
38°C
45°C
K,
Linear
0 .87 2 .17
Langmuir
7.9x10 2
1.3X1O"
-2
3.7X10
Freundlich
0.497
Modified Freundlich
1.0
0.96
1.0
2.06
8.7x10
r
2
3.6xlO~
0.759
7.3xlO~
1.2x10 -5 6.6x10
4
0.777
0.806
7.3x10"
5
4.5X10
2
-3
1.0
1.24
1.1X10
2.77
1.3x10"
1.0
0.831
3.7X10⁻²
3.3X10"
0.722
0.852
0.662
6.0X10"
0.748
1.0 1.0
Transformations:
1/N =
Linear:
K
d
Freundlich: K, d
S
1/N
Vs!,max
S
0= 1 Langmuir:
K
d
= kb
k 0
Ln
1
max
max
N = & Modified Freundlich:
max
2000 /ig li mL
and a solid-to-liquid ratio of 1:20. The assumption in these
calculations is that lithium sorption can be modeled as pseudo-binary ion-exchange sorption. During sorption, lithium replaced primarily calcium and sodium ions. Typically, lithium was exchanged with calcium and sodium in an equivalent ratio of 1.6:1 (Ca:Na) in the higher concentration region of lithium and nearly the reverse in the lower concentration region. Therefore, calcium and sodium are considered as a composite ion [ion B in Equation (4.12)] in these calculations. The valence of the composite ion B was estimated as follows.
At high concentrations, 1 f\ Z
D
=
i z
i—Ti~fi
D
+
n~
l.+i.o ua
T77~7t
%»
=
1.61.
l+i.o wa
At low concentrations,
1 R
Z
B
=
1
z
+
17+176 Na I+T78 z Ca = 1>38
C Bo Bo + z A In 7 B - Zg In 7 A + z g In M A + z g In K^ ,
52
(5.2)
where Zg = valence of the composite ion B; z. - valence of lithium; /? = isotherm parameter; Cn = the initial concentration of composite ion B adsorbed expressed as /jraoles B mL" solid; Cg - the initial concentration of composite ion B in the solution phase expressed as /anoles B mL" HgO; r = solution-to-solid ratio expressed as mL H^O g solid; p - solid density expressed as g solid mL" solid; 7
B
=
(?Ca ^Na^
=
activity coefficient of composite ion B;
7i = activity coefficient of lithium in solution phase; 1^ = molecular weight of lithium expressed as ftg Li /imole' Li; and Kp = isotherm parameter expressed as mL jig Li;
The parameter values used to calculate the thermodynamic equilibrium constants from Equations (4.19) through (4.22) are given in Table X. The estimated values for the equilibrium constants (K ) , Gibb's free energies of sorption (AG°), and enthalpy (AH0) are given in Table II. The results indicate that the thermodynamic equilibrium constant decreases with an increase in temperature, as does Gibb's free energy of sorption. The enthalpy of sorption between 25°C and 38°C was estimated to be -5 kcal mole
. However, the AH 0
between 38°C and 45°C was estimated to be about -36 kcal mole mole
. The -5 kcal
is more consistent with that expected with lithium, that is,
electrostatic or physical sorption. The 7°C difference between 38°C and 45°C is small. Therefore, differences in equilibrium constants will be smaller than when the temperature difference is great. In cases where small 53
PARAMETER CONSTANT J-13 VELL RANGE OF
TABLE X VALUES FOR THE ESTIMATION OF A THERMODYNAMIC EQUILIBRIUM FOR THE LITHIUM ADSORPTION ON A PROV PASS SUSPENSION IN WATER AT THREE TEMPERATURES FOR THE INITIAL CONCENTRATION 1 TO 2000 fig Li mL" 1 AND A SOLID-TO-LIQUID RATIO OF 1:20
0 25°C 38°C 45°C
K
0 .823 0 .775 0 .703
D
1Li
7Ca
9 .17x10"4 6 .90x10"4 2 .97x10"4
0. 978 0. 941 0. 940
0. 787 0. 783 0. 781
7
Na
0 .974 0 .939 0 .938
0 .876 0 .857 0 .856
zA = 1
~p = 2.54 g solid mL" 1 solid
Cfio = 270.93 /zraole B mL
zfl = 1.5
r = 20 mL H 2 0 g" * solid
Cfio = 1.798 fimoles B mL" 1 HgO
M A = 6.94 jig Li mole" 1 Mfi = 33 (tg B fimole'1
54
solid
TABLE XI THERMODYNAMIC CONSTANTS ESTIMATED FOR LITHIUM ADSORPTION ON A PROV PASS SUSPENSION IN J-13 VELL VATER AT THREE TEMPERATURES FOR AN INITIAL CONCENTRATION RANGE OF 1 TO 2000 pg Li ml" 1 AND A SOLID-TO-LIQUID RATIO OF 1:20
25°C
38 °C
45°C
K
0.001954
0. 0013
0.00037
AG°
3.7
4. 1
5.0
e
(kcal mole" )
AH0
-5.4
-35.5
(kcal mole" )
55
differences in equilibrium constants occur, the relative error is expected to increase. Thus, estimated enthalpies (equation 4.20) are subject to more error when temperature differences are small than when they are large. To evaluate the -36 kcal mole mlT
estimate, the enthalpy from the l-to-150-/jg-Li
experiment for 38°C and 45°C was calculated. The experimental design
differed in that the solid-to-liquid ratio was 1:10 instead of 1:20. The effective valence of the pseudo-solute B was about 1.2, compared with 1.5 for the first data set. The parameters used in calculating thermodynamic constants are given in Table XII for the 38°C and 45°C data sets. The thermodynamic constants are given in Table XIII. The equilibrium constant value for 38°C is slightly higher than for the first data set (0,0303 compared with 0.0239). This difference can be attributed to differences in the effective valence of the pseudo-ion B. However, the AH 0 estimated for the 38°C and 45°C data is -5 kcal mole" , which is the same as that for the 25°C to 38°C data of the l-to-2000-/jg-Li mL" 1 data set. It should be stated that the method of calculating the enthalpy of sorption is sensitive to the error associated with the estimate of the thermodynamic equilibrium constant. Small errors in the equilibrium constants may result in large differences in enthalpy estimates. For instance, in the case of equation 4.20, errors associated with the natural logarithm of the ratio of the equilibrium constants is multiplied by the large product of two absolute temperatures. Thus, the above conclusions should be kept within the context of the trends from a number of data sets; the average values of enthalpy should not be taken as absolute. A second approach in estimating the enthalpy of sorption was used to test the above conclusions. The best-estimate data of the l-to-2000-/*m-Li ml 56
TABLE XII PARAMETER VALUES FOR THE ESTIMATION OF THERMODYNAMIC EQUILIBRIUM CONSTANTS FOR LITHIUM ADSORPTION ON A PROV PASS SUSPENSION IN J-13 VEIL WATER AT 38°C AND 45°C FOR THE INITIAL CONCENTRATION RANGE OF 1 TO 150 fig Li mL" 1 AND A SOLID-TO-LIQUID RATIO OF 1:10
i
38°C 45°C
0.852 0. 748
Z
A = 1
Z
B
=
7.3x10"4 6. 0x10"
1.2
4
7Li
?Ca
0 .978 0 .940
0.783 0.781
Ya 0..939 0..938
7B
0 .857 0 .856
1 P = 2.54 g solid ml" solid
r = 10 mL ^ O g " 1
solid
M A = 6.94 fig Li fimole'1
Cfio = 270.93 fimoles B raL"1 solid
M g = 27 fig B fimole'1
C^Q = 1.798 pinoles B m L " 1 H 2 0
57
TABLE XIII THERMODYNAMIC CONSTANTS ESTIMATED FOR LITHIUM ADSORPTION ON A PROV PASS SUSPENSION IN J-13 VELL VATER AT 38°C AND 45°C FOR. AN INITIAL CONCENTRATION RANGE OF 1 TO 150 ng Li mL" 1 AND A SOLID-TO-LiqUID RATIO OF 1:10
Constant
38°C
45°C
K
e
0. 0093
0. 0077
AG°
2. 9
3. 1
(kcal mole"*)
AH 0
-5.2 1
(kcal mole" )
58
concentration range experiments were used in this approach. The Freundlich equation was used to show the relationship between the concentration of lithium sorbed and the concentration in solution at equilibrium. The parameter values for that equation are given in Appendix D, Table D-III. In this approach the concentration of lithium adsorbed (Co) is expressed as /jg Li s ml"
of solution in contact with the surface of the solid. This value can be
calculated from the equation (47, 48)
where p is the density of water (g mL ) , H is the molecular weight of water (g), A is the cross-sectional area of water (cm2 molecule"-1) , N is Avogadro's number, S o is the surface area of the solid (cm2 g"-1 ) , and S is the specific adsorption (ing kg" ) . The cross-sectional area of water was calculated from the following equation (46):
A = 1.091 x 10" i 6 [(I x lO 2 4 )^/?)" 1 ] 2 / 3 .
(5.4)
For the conditions of the lithium experiment, p = 1 g ml , M = 18 g, A = 105 x 10" 1 5 cm 2 molecule"1, S, = 34 600 cm 2 g"1, and N = 6.02 x 10 2 3 ; therefore C cl
S
= 1015 x S. Equation 5.3 was used to calculate C for a series of S values. Also, C s e was calculated for the same S values by inverting the Freundlich isotherm 59
data. Those results are given in Table XIV- From those data, In (C /C ) was plotted against C and the curve was extrapolated to C -• 0; as C -^3 0, S
fa
o
(C /C ) = a /a = K , where K is an equilibrium constant for the sorption process. The K values obtained from the sorption of lithium at the three temperatures (25°C, 38°C, and 45°C) are given in Table XV, as are average enthalpies calculated with Equation (4.19). The estimated average enthalpies (based on trends) indicate that the mechanism of lithium sorption is physical (electrostatic). The results are consistent with those yielded by the assumption of ion exchange method. 5.2.4
Desorption The objective of the desorption experiment was to evaluate the
reversibility of lithium sorption. Knowledge of the reversibility of lithium sorption will help in determining models for the transport of lithium in the field and in supporting a controlling sorption mechanism of lithium; the electrostatic sorption mechanism is expected to show reversibility. After the adsorption experiment, the solution was decanted and replaced with J-13 water without lithium. Some lithium remained in solution after decanting. The concentration of lithium in the remaining solution was determined from analysis of an aliquot of the decanted wash solution. J-13 water was equilibrated with the solid containing adsorbed lithium. The solution was then analyzed for lithium and other cations. Vith the concentration of ions in the adsorbed and solution phases known, the amount of lithium gained in solution was compared with the amount of cations (excluding lithium) lost from solution, and a best estimate was obtained for the amount of lithium sorbed after desorption equilibration. These results, given in 60
TABLE XIV DATA USED IN THE CALCULATION OF EQUILIBRIUM CONSTANTS FOR THE ADSORPTION OF LITHIUM ON A PROV PASS SUSPENSION IN J-13 VELL WATER AT THREE TEMPERATURES FOR THE INITIAL CONCENTRATION RANGE OF 1 TO 150 fig Li mL' 1 AND A SOLID- TO- LiqUID RATIO OF 1:20
s faglig"1)
4 25 100 250 375 500
C 1
(fig Li mL'1)
(fig Li mL" )
4.06xl03 2.54xlO4 1.02xl05 2.54xlO5 3.81xlO5 5.08xl05
25°C
38°C
45°C
0.96 12.2 83.6 298 522 780
0.81 12.1 92.7 356 647 986
1.00 17.0 145 598 1120 1750
C is calculated by using Equation (5.3). C is calculated using its relationship to S as modeled by the Freundlich isotherm (see Section 5.2.3 for the relationship).
61
TABLE XV EQUILIBRIUM CONSTANTS AND ENTHALPIES FOR THE ADSORPTION OF LITHIUM ON A PROV PASS SUSPENSION IN J-13 VELL VATER AT TEMPERATURES OF 25°C, 38°C, and 45°C FOR THE INITIAL CONCENTRATION RANGE OF 1 TO 2000 fig Li mL 1 AND A SOLID-TO-LIQUID RATIO OF 1:20
25°C
Constant
7.81
K
o
AH 0 (Kcal mole
62
)
0.09 (25°C-38°C)
38°C 7.85
-0.32 (25°C-45°C)
45°C 7.55
-1.12 (38°C-45°C)
Figure 7, indicate that desorption data follow the adsorption data in the low concentration range, but in the high concentration range the amount of sorbed lithium is higher for the desorption experiment than for the adsorption experiment. This difference is attributed to the probability that equilibrium was not reached in the desorption experiment because of the high concentration of lithium in solution; that concentration in solution may reduce the rate of outward diffusion. To further substantiate these conclusions, the desorption data for the l-to-150-/*g-Li ml
experiment at 38°C were evaluated similarly. The results,
given in Figure 8, indicate that lithium concentrations in the desorption experiment essentially follow those of the adsorption experiment over the range of desorption concentrations. A statistical comparison of the Modified Freundlich isotherms indicates a significant difference in the two regressions at the 957i confidence level, but that difference is attributed to the adsorption data at concentrations higher than those of the desorption data. The above results indicate that the sorption of lithium is reversible and hysteresis is not evident. The conclusion that lithium sorption is reversible also supports the conclusion drawn from the enthalpy data: physical sorption is the predominant mechanism for the sorption of lithium on the Prow Pass matrix.
5.3 Potentiometric Studies Potentiometric analysis of mineral surfaces can provide information to permit understanding the mechanisms of sorption exhibited by a solute ion. Data generated by titrating the solid material with potential-determining ions (e.g., H + and OH") may also be used with models to investigate further the nature of solute interactions with the media (30). 63
1 D
rw
I—I
i
s
Log
CO
0 '"
Adsorp. Obs. Adsorp. Pred.
O
Desorp. Obs.
n
Oesorp. Pred.
© / ^
-1 -2 -3
-4 -1
*y o —i——i
1—
1
1 Log Cone, (pjq
Figure 7. Observed and predicted adsorption and desorption of lithium on a Prow Pass suspension in J-13 well water at 38°C for an initial concentration range of 1 to 2000 fig li ml" 1 and a solid-to-liquid ratio of 1:20. Predicted lithium is based on the Modified Freundlich isotherm.
64
D 1. .
X
I
O
Adsorp. Obs. Adsorp. Pred. Desorp. Obs. Desorp. Pred.
2
3-
4-
-1
1
—i
1
1 Log Cone, (jig m L " 1 )
Figure 8. Observed and predicted adsorption and desorption of lithium on a Prow Pass suspension in J-13 well water at 38°C for an initial concentration range of 1 to 150 pg Li ml" 1 and a solid-to-liquid ratio of 1:10. Predicted lithium is based on the Modified Freundlich isotherm.
65
Results of the potentiometric titrations are summarized in Figure 9 for no lithium added and Figure 10 for lithium added. All four curves of s k plotted against resultant pH show the same pattern. No clear intersections are observed for the two electrolyte concentrations, and the low electrolyte curves are almost always below the high electrolyte curves. The pH at which the two electrolyte concentrations intersect is indicative of the ZPC. The graphs do exhibit a character similar to those reported by other investigators (51) in that the two electrolyte concentrations tend to converge and remain almost indistinguishable below pH 9. Results of the electrophoresis experiment are summarized in Figures 11 and 12 for the same samples generated in the titration experiment. Vhereas the titration measurements were made on the whole sample (q Li g" 1 solid
b = jig Li g
C - jug Li mL" 1 H 2 O
k = mL H 2 O pq~l Li-
solid
TABLE D-VII STATISTICAL AND MODEL PARAMETER ESTIMATES OF THE FREUNDLICH ISOTHERM FOR THE ADSORPTION OF LITHIUM ON A PROW PASS SUSPENSION I N J - 1 3 WELL WATER FOR AN INITIAL
to O
CONCENTRATION RANGE OF 1 t o 1 5 0 pq L i UlL"1 AND A SOLID-TO-LIQCJID RATIO OF 1 : 1 0
25°C
38°C
45°C
Li Data
Best Estimate
Li Data
Best Estimate
Li Data
Best Estimate
R2
0.924
0.987
0.981
0.958
0.986
0.981
CV
15
6.1
6.6
11
5.9
6.5
Slope (N)
0.638±0.061
0.759±0.039
0.90010.038
0.833+0.077
0.807+0.031
0.722±0.045
Intercept (K)
0.413±0.077
0.444+0.055
0.477±0.051
0.37±0.11
0.632±0.042
0.643±0.064
Equation: S = KCr Regression: log S vs log C
Units: S = /ig Li g~ solid C - fig Li mL"1 H20 N = dimensionless K - (mL /tg" 1 L i ) N Qig Li g" 1 s o l i d )
TABLE D-VIII STATISTICAL AND MODEL PARAMETER ESTIMATES OF THE MODIFIED FREUNDLICH ISOTHERM FOR THE ADSORPTION OF LITHIUM ON A PROW PASS SUSPENSION IN J-13 WELL WATER FOR AN INITIAL OONCENTRATTON RANGE OF 1 to 150 (iq Li JtiL"1 AND A SOLID-TO-LIQUID RATIO OF 1:10
Ii 25°C
38°C
45°C
Li Data
Best Estimate
Li Data
Best Estimate
Li Data
Best Estimate
R
0.921
0.988
0.982
0.961
0.985
0.979
CV
8.2
4.8
6.6
9.2
6.1
6.9
Slope
0.647±0.063
0.777+0.039
0.936±0.038
0.852*0.077
0.844*0.033
0.7481:0.049
Intercept
-2.63±0.079
2.60±0.06
-2.58±0.051
-2.67±0.11
-2.42±0.04
-2.41t0.07
.-5 8.6X10
4.5x10
1.75x10
7.3X10⁻⁴
1.35xlO~3
4 6.0X10"
Equation: Regression: log
Units: =) vs log C
~ solid S = nq Li g~ S
max
i g^solid
C = nq Li H2O 0= dimensionless Kp = mL F fig"1 Li
The following number is for Office of Civilian Radioactive Waste Management (OCRWM) records management purposes only and should not be used when ordering this publication. Accession Number NNA.890919.0077
Tlii* lapon hw been leanahcad directly from Die beet available copy. Available u DOE aad DOE c a m c u n fin* •he Office of Scientific and Technical Inftxmtim P.O. Bo. 62 CWilWfcTN 37131 pricce available boa (615) 574-MOI. FTS 626-M01 Available to Hie public AD* U.S. DiparaiiMl of CoaaMrec 5215 Port Royal Rd. Sprinffield.VA 22161 Microfiche A01
Paje Xante
NTIS Price Code
Pate Xante
NTIS •rice Code
Pate Knife
NTIS Price Code
001-025 026-050 051-075 076-100 101-125 126-150
A02 A03 A04 A05 A06 A07
151-175 176-200 201-225 226-250 251-275 276-300
AOt AN AIO All A12 All
301-325 326-350 351-375 376-400 401-425 426-450
AI4 A1S AI6 AI7 Alt AI9
•CcaMct NTIS for a price quote.
FajeRaftfe
NTIS Price Code
451-475 476-500 501-525 526-550 551-575 576-400 601-«p*
A20 A21 A22 A23 A24 A2S AW