Characterizing Disk Failures with Quantified Disk Degradation Signatures: An Early Experience Song Huang and Song Fu Department of Computer Science and Engineering University of North Texas
[email protected],
[email protected]
Abstract—With the advent of cloud computing and online services, large enterprises rely heavily on their data centers to serve end users. Among different server components, hard disk drives are known to contribute significantly to server failures. Disk failures as well as their impact on the performance of storage systems and operating costs are becoming an increasingly important concern for data center designers and operators. However, there is very little understanding on the characteristics of disk failures in data centers. Effective disk failure management and data recovery also requires a deep understanding of the nature of disk failures. In this paper, we present a systematic approach to provide a holistic and insightful view of disk failures. We study a large-scale storage system from a production data center. We categorize disk failures based on their distinctive manifestations and properties. Then we characterize the degradation of disk errors to failures by deriving the degradation signatures for each failure category. The influence of disk health attributes on failure degradation is also quantified. We discuss leveraging the derived degradation signatures to forecast disk failures even in their early stages. To the best of our knowledge, this is the first work that shows how to discover the categories of disk failures and characterize their degradation processes on a production data center. Keywords-Disk failure characterization; failure categorization; disk degradation; resilience modeling; data centers.
I. I NTRODUCTION Storage systems become increasingly larger with the booming of cloud computing and online services. Although hard drives are reliable in general, they are believed to be the most commonly replaced hardware components [25], [23]. It is reported that 78% of all hardware replacements were for hard drives in the data centers of Microsoft [25]. Moreover, with the increased capacity of single drives and an entire system, block and sector level failures, such as latent sector errors [4] and silent data corruption [3], cannot be ignored anymore. For instance, in RAID-5 systems, one drive failure with any other sector error will result in data loss, which leads to tremendous financial and economic costs to both service providers and end users. It is urgently required to develop new technologies for disk failure management and data protection, which requires a deep understanding of the characteristics of disk failures.
Quan Zhang and Weisong Shi Department of Computer Science Wayne State University
[email protected],
[email protected]
Disk drive is a complex system composed of a large number of magnetic, mechanical, and electronic components. Each of these components can fail and their failures show various manifestations with different extents of severeness. Disk failures can be physical (e.g., head crash and motor failure) or logical (e.g., corrupted file and human error); immediate and total (e.g., broken head and stiction) or progressive (e.g., bad sectors and wearing failure). For example, media defects and handling damage can cause a failure due to excessive bad sectors. Head crash or broken heads can lead to a large number of read/write errors. Motor or bearing failures are potentially caused by handling damages. Bad servo positioning can also lead to failures. In addition, corrupted files and human errors can cause damages to disk’s file structure or software leading to logical failures. As a result, data on disk drives may be totally destroyed, or partially or totally recoverable. Therefore, it is imperative to identify different categories of disk failures and their unique properties, which will allow IT operators to apply appropriate handling and protection mechanisms to effectively rescue data and even hard drive itself. Moreover, disk failures in a data center environment usually follow a gradual degradation as abrupt failures, which are caused by hard drive shocks or power outages, seldom occur. Modeling the degradation process of disk failures will enable us to track the evolvement of disk errors to failures and accurately estimate the available time for data rescue. Thus, understanding categories and characteristics of disk failures is essential for improving the reliability and availability of storage systems. In this paper, we aim to characterize the behavior of disk failures in today’s data centers and obtain a deeper understanding of the occurrences of disk failures. Specifically, we seek to answer three important questions: “What are the distinctions between disk failures and what are their types?”, “How do disk failures occur and what is the failure degradation process?”, and “What is the influence of disk health attributes on failure degradation?”. To address them, we analyze manifestations of disk failures in a production data center and explore data mining techniques combined with statistical analysis methods to discover different cate-
gories of disk failures and their distinctive properties. We use similarity measures to quantify the degradation process of each failure category and derive the degradation signatures. We further analyze the influence of disk health attributes on failure degradation and reveal that the environmental factors do not significantly intensify disk degradation. We then leverage the derived degradation signatures to forecast disk failures even in their early stages. Our systematic analysis provides a holistic and insightful view of the nature of disk failures. The main contributions of this paper are: • A systematic approach is proposed to allow data center operators to automate the analysis of disk health data and categorize disk failures based on their distinctive manifestations and further determine their types. • The proposed approach is also capable of finding disk degradation signatures for each failure type, which enables data center operators and disk drive manufacturers to understand and track the occurrence of disk failures. • The generated failure categories and degradation signatures are important for directing the failure handling and data rescue efforts and predicting disk failures of different types and at various deterioration stages. • Our analysis on a production storage system reveals that logical failures account for 59.6% of disk failures and they have a short degradation process. We also find that high temperature is the most important factor for the appearance of those logical failures. These suggest we explore thermal-aware technologies in order to improve the reliability of the storage system dramatically. Although the specific analysis is performed on the disk dataset from a production data center, our proposed approach is generic and applicable to other storage systems. The rest of this paper is organized as follows. We first provide background on disk failures and present the related research in Section II. The disk dataset collected from a production data center is described in Section III. Section IV presents our study on the characteristics of disk failures, including failure distributions in Section IV-A, failure categorization in Section IV-B, degradation signatures in Section IV-C and influences of health attributes in Section IV-D. We discuss the exploration of the degradation signatures for disk failure handling and prediction in Section V. Section VI concludes the paper. II. BACKGROUND AND R ELATED W ORK A. Disk Failures Disk drives do not fail in a simple fail-stop way. The production data center that we study defines a disk failure in three cases: the system loses connection to the disk, an operation exceeds the timeout threshold, or a write operation fails. Those drives that cannot function properly are replaced.
Operations to disks can be initiated by file system’s read() and write() calls as well as by an internal disk scan process, which checks sector reliability and accessibility in the background. There are several types of disk errors. Read or media error: this error occurs when a particular disk sector cannot be read, whether during a normal read or a background disk scan. Any data previously stored in the sector is lost. The disk interface reports the status code upon detecting a sector error, specifying the reason why the read fails. Reallocated sector: after a number of unsuccessful retries, a drive re-maps a failed write to a spare sector. Disk drives usually reserve several thousand spare sectors. Reallocation only occurs on detected write errors. Pending sector and uncorrectable error: unstable sectors detected in the disk scan process will be marked as pending sectors. Disk drives can try solving these errors through the build-in Error Correcting Codes. Any sectors that are not successfully recovered cause uncorrectable errors. Seek errors: this error occurs when a disk drive fails to properly track a sector and needs to wait for another revolution to read or write from or to a sector. B. Disk Failure Characterization A number of existing research seeks to characterize the distribution of disk failures and discover indicators of impending failures. Gray et al. [10] observed failure rates ranging from 3.3-6% in two large web properties at Microsoft. Schwartz et al. [24] reported failure rate of 2-6% in the drive population at the Internet Archive. Elerath and Shah [9] reported that end-user failure rates can be as much as ten times higher than what the drive manufacturer might expect in their study on server class disk drives. Schroeder and Gibson [23] found that in the field, annual disk replacement rate typically exceeded 1%, with 2-4% common and up to 13% observed on some systems. They presented the percomponent failure percentages for three different types of systems and reported a significant overestimation of mean time to failure (MTTF) by manufacturers. Bairavasundaram et al. [4] revealed the potential risk of latent sector errors during RAID reconstruction, which was not predicted in the early RAID reliability model. Xin et al. [27] analyzed the effect of infant mortality on long-term disk failure rates and used hidden Markov models to describe the effect. Pinheiro et al. [19] studied failures of consumer-grade disk drives used in Google’s services. They found that most SMART attributes strongly suggested an impending failure. Ma et al. [16] analyzed disk failures in EMC data backup systems and found that the count of reallocated sectors correlated strongly with failures. Their findings comply with our results from one of the three failure categories. However, little prior work analyzes the degradation process of disk failures. Moreover, as the information of failure categories is not available, all failure instances are considered together in the preceding works. In this paper, we
aim to discover insightful characteristics of disk failures in terms of their degradation and manifestations of different failure types. We find that some disk failures have a short degradation process and their health attributes have similar values as those of good drives. By taking a holistic view using multiple attributes, we can accurately derive their degradation signatures. C. Disk Failure Prediction Disk drive manufacturers estimate that the threshold-based algorithm implemented in drives can only obtain a failure detection rate (FDR) of 3-10% with a low false alarm rate (FAR) on the order of 0.1% [18]. The reason is that, to avoid the high cost for false alarms, the drive manufacturers set the thresholds conservatively to keep the FAR to a minimum at the expense of FDR. A number of techniques have been proposed to improve the failure detection rate based on SMART attributes. For example, Hamerly and Elkan [13] employed two Bayesian approaches to predict disk failures on a dataset from Quantum Inc. consisting of 1,927 good drives and 9 failed drives. They achieved a prediction accuracy of 35-55% with about 1% FAR. Hughes et al. [14] applied multivariate rank-sum test and OR-ed single variate test to 3,744 drives in which only 36 drives were failed. They achieved 60% FDR and 0.5% FAR. Murry et al. [17] compared the performance of SVM, unsupervised clustering, and two non-parametric statistical tests (rank-sum and reverse arrangements tests). The dataset was collected from 369 hard drives with about the equal number of good and failed drives. They found that the rank-sum method achieved the best performance, i.e., 33.2% FDR and 0.5% FAR. In addition, Markov Models [29], [8], classification and regression trees [15], and Mahalanobis distance [26] have been proposed to predict disk failures. These existing works treat all disk failures equally without considering the distinctive characteristics of failures from different categories. Our proposed approach can distinguish disk failures of different types based on the drives’ SMART health profiles, which will enable data center operators to predict the degradation and occurrences of different types of disk failures and apply appropriate actions to tackle them. III. D ISK DATASET Our dataset has been collected from a real-world data center. There are 23,395 enterprise-class disk drives profiled in our dataset and all of them are with the same drive model. During a period of eight weeks, each working drive was sampled every hour. For each drive, we can retrieve 23 meaningful attributes from a SMART (Self-Monitoring, Analysis and Reporting Technology [2]) record. For some attributes, their values are the same for all drives or do not change during operation. They are not helpful for characterizing disk failures. Thus,
Table I D ISK HEALTH ATTRIBUTES SELECTED FOR DISK FAILURE CHARACTERIZATION .
Symbol RRER RSC SER RU E HF W HER CP SC SU T R-RSC R-CP SC P OH TC
Attribute Name Raw Read Error Rate Reallocated Sectors Count Seek Error Rate Reported Uncorrectable Errors High Fly Writes Hardware ECC Recovered Current Pending Sector Count Spin Up Time Reallocated Sectors Count Current Pending Sector Count Power On Hours Temperature Celsius
Type R/W, Health value R/W, Health value R/W, Health value R/W, Health value R/W, Health value R/W, Health value R/W, Health value R/W, Health value R/W, Raw data R/W, Raw data Env., Health value Env., Health value
they are filtered out. Then 10 attributes are left and used in our analysis. Each SMART attribute contains a raw data (i.e., a six-byte measured value provided by a sensor or a counter) and a health value (i.e., a one-byte integer representing the current relative health of the attribute). Since the formats of the attribute values are vendor-dependent, we normalize them for ease of comparison. Because some normalized values lose accuracy and their corresponding raw values are more sensitive to the health condition of drives, we select two raw data besides the 10 normalized values for disk failure characterization. Table I lists these attributes and their symbols used in our discussion. The first 10 attributes are directly related to disk read and write operations and the last two are environmental attributes. Drives that have been replaced due to failures are labeled as failed drives, while the rest experiencing no failure are called good drives. In total, 433 failed drives and 22,962 good drives are recorded in the dataset. For each failed drive, samples in a period of 20 days prior to the actual failure were recorded. For each good drive, up to sevenday health records were provided. Some failed drives might lose a number of samples if they did not survive 20 days of operation since the data collection began. In total, there are 156,312 health records of failed drives and 3,850,141 health records of good drives. Data normalization facilitates a fair comparison between values of different attributes. The equation of data normalization that we use is given below: x − xmin xnorm = 2 − 1, (1) xmax − xmin where x is the original value of an attribute, xmax and xmin are the maximum and minimum values of the attribute in the dataset, respectively. IV. C HARACTERIZATION OF D ISK FAILURES AND D EGRADATION S IGNATURES We aim to achieve a better understanding of disk failures, in particular characterizing the degradation processes of
1.0 0.8
225
0.6
200
0.4
175
0.2
Values
125 100 75 50 25 0 0
Figure 1.
48
96
144
192
240 Hours
288
336
384
480
Histogram of the duration of health profiles for failed drives.
Figure 2. records.
RRER
RSC
SER
RUE
400
20 10
200
0 1
2
3
4
5
6
7
8
9
10
Number of clusters
Figure 3. Comparison of different numbers of failure groups. Three groups produce the best clustering results.
−12
−10
−8
−6
−4
−2
0
2
Principal component 1
Figure 4. Groups of disk failures with distinctive manifestations: 258 in Group 1 (blue circle), 33 in Group 2 (purple triangle) and 142 in Group 3 (black cross).
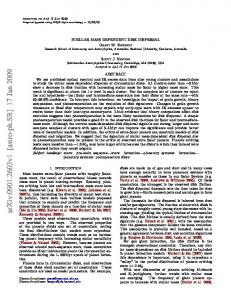
different categories of disk failures. Therefore, we focus on analyzing the failed drives. This section presents our analysis results based on the large-population disk dataset from the production data center. It is worth noting that our approaches are generic and applicable to other disk datasets and storage systems. A. Distributions of Disk Failures and Health Attributes In total, 433 failed drives out of 23,395 disk drives (i.e., 1.85%) were replaced during the period of our data collection. 156,312 health samples were recorded in our dataset for those failed drives. Thus each failed drive on average has 361 health samples, that is a 361-hour (about 15 days) health profile is available for a failed drive. Figure 1 shows a histogram of the period of time that the 433 failed drives are monitored and their health records are provided. 78.5% of the failed drives have their health profiles longer than 10 days and the percent of failed drives having a 20-day health profile reaches 51.3%. Therefore, the dataset provides disk health profiles long enough to characterize the failure dynamics. In Table I, 12 health attributes are selected for our analysis. These attributes may not be equally important for modeling disk failures. From the disk dataset, we observe that the values of some attributes do not change much among failure records, while others display large variations.
Normalized d values of a attributes
600
HER
CPSC
Attributes
SUT
RRSC RCPSC
POH
TC
1
15
Principal component 2
800
HFW
Distributions of disk health attributes from the 433 disk failure
25
1000
Average distance within groups
432
−1.0 −0.8 −0.6 −0.4 −0.2 0.0
Number of drive
150
0.8 0.6 0.4 0.2 0 -0.2
R-RSC RUE RRER HER
SUT
SER
POH
TC
-0.4 -0.6 -0.8
Centroid failure of Group 1 Centroid failure of Group 2 Centroid failure of Group 3
-1
Figure 5. Failure records of the centers of three groups: Drive #57 in Group 1, Drive #369 in Group 2, and Drive #136 in Group 3.
Figure 2 plots the box charts of the 12 attributes from the 433 failure records. Attributes, such as CP SC, R-CP SC, RU E, SER HF W and HER, show a small variation among most (i.e., 90%) of their values, indicating their values are very close in all failure records. We can consider these attributes with their values as a common property for all disk failures. From the figure, we also notice that the remaining 10% of the values of RU E and HF W span over a wide range. This implies that the corresponding disk failures may have different properties from the rest. In contrast, RRER, T C, SU T , P OH RSC and R-RSC display medium to large variations (Some of them have values covering the entire range, e.g., RSC, R-RSC and P OH). The large variations of these attributes imply that disk failures have very different manifestations, which raises the question “Are there multiple categories or types of disk failures, causing these various manifestations?”. If the answer is affirmative, then how can we distinguish them? We address these two questions in Section IV-B. B. Categorization of Disk Failures Accurate discovery of disk failure types in a large-scale storage system is challenging due to the lack of diagnosis information which is only available from disk manufactures when failed disks are returned in their warranty.
1.00
0.75
0.75
0.50
0.50
Group 1 failures Group 2 faiures Group 3 failures Good
0.00 −0.25
0.75 0.50 0.25
0.25
RRER
RUE
0.25
R−RSC
1.00
0.00 −0.25
−0.50
−0.50
−0.75
−0.75
−0.50
−1.00
−1.00 1
2
3
4
5
6
7
8
9
−0.75 1
2
3
4
Figure 6.
5
6
7
8
9
1
2
3
4
5
Deciles
Deciles
(b) R-RSC
(c) RRER
Deciles
(a) RU E
0.00 −0.25
6
7
8
9
Disk read/write attributes displaying the most distinctive manifestations between good and failure records.
To address this issue, we explore data mining techniques combined with statistical analysis methods to identify groups of disk failures and their distinctive properties, based on which the failure types can be derived. Specifically, for every failed drive, its failure record, i.e., the last recorded health state, is extracted. We use those attributes that are directly related to disk read and write actions (that is attributes with a type of “R/W” in Table I) in failure categorization. For each attribute, we add two statistics, i.e., standard deviation of the values in the last 24 hours and change rate of the values. Thus, we create a set of 433 failure records with 30 features each. We cluster these failure records into groups in order to find their distinctive manifestations. We employed both K-means and Support Vector Clustering (SVC), which generate the same results. We measure the average distance of failure records to their center points (called centroids) for different numbers of clusters (Figure 3) and choose three as the best number. The three clusters as shown in Figure 4 contain 258 (59.6%), 33 (7.6%) and 142 (32.8%) failure records, respectively. We denote them as Groups 1, 2 and 3. The followup question is “What is the difference between these failure groups and what are their types?”. To answer it, we compare failure records of the centroids in the three groups, i.e., Drives 57, 369 and 136 in Groups 1, 2 and 3 respectively. Figure 5 shows that the values of their attributes display noticeable variations. As RSC is a linear transformation of R-RSC, it is not included in the figure. It is easy to see from Figure 5 that Drive 369 (Group 2) detects a large number of uncorrectable errors which cannot be recovered by ECC in internal scans and Drive 136 (Group 3) has the largest number of reallocated sectors resulted from write errors, while Drive 57 (Group 1) looks normal without obvious problems. In order to obtain a holistic view of all disk failures in each group and their difference from the health records of good drives, we summarize each attribute in a category using deciles of the cumulative distribution, that is we divide the sorted data set into ten equal-sized subsets and display the first nine deciles to avoid the skew of outliers. Such quantiles are more robust than other statistical methods, e.g.,
Table II P ROPERTIES AND CATEGORIES OF DISK FAILURES .
Failure Group
Population
Distinctive Properties
Group 1
59.6%
Group 2
7.6%
Group 3
32.8%
Similar to good states: a small number of write errors and internal scan errors, medium read errors. Highest number of uncorrectable errors, more media errors and varying write errors. Highest number of write errors, larger high fly writes, longer power-on hours, low media errors and internal scan errors.
Failure Type Logical failures
Bad sector failures
Read/Write head failures
cumulative distribution function, to outliers and noise in depicting the value distribution [5]. Figure 6 compares the deciles of three most significant read/write-related attributes in good (i.e., good drives) records and each failure group. From the figures, we can distinguish the three failure groups by the following properties. Disk failures in Group 2 have the lowest RU E (sector errors, 90% failures having RU E less than -0.46), low RRER (media errors, 70% RRERs below zero) and diverse R-RSC (write errors). In contrast, Group 3 has the highest R-RSC (all above 0.94) and closeto-good RRER and RU E. However, most of the read/write attributes of Group 1 have values very close to those of good states. In addition to read/write attributes, we analyze the distributions of environmental factors, i.e., power-on hours (P OH) and temperature (T C), among failure groups. Due to space limit, the figures of their decile values are not included in this paper. Table II characterizes the three failure groups according to their manifestations. We derive the types of disk failures based on their properties, i.e., logical failures in Group 1, bad sector failures in Group 2 and read/write head failures in Group 3. Compared with dedicated backup storage systems where bad sector failures dominate [16], the storage system
2.5
0.45
2.25
Distancee (dissimilarity) to failure
0.2 0.15 0.1 0.05
Disk health record
2 1.75 1.5 1.25 1 0.75 0.5 0.25
0
Disk health record
0.4 0.35 0.3 0.25 0.2 0.15 0.1 0.05 0
362
343
324
305
286
267
248
229
210
191
172
153
96
134
77
115
58
39
1
20
0
1 20 39 58 77 96 115 134 153 172 191 210 229 248 267 286 305 324 343 362 381 400 419 438 457 476
0.25
Distance e (dissimilarity) to failure
Disk health record
0.3
1 19 37 55 73 91 109 127 145 163 181 199 217 235 253 271 289 307 325 343 361 379 397 415 433 451 469
Distance e (dissimilarity) to failure
0.35
Index of health records
Index of health records
Index of health records
(a) Group 1
(b) Group 2
(c) Group 3
Figure 7. Distance (Dissimilarity) of health records to disk failures for the centroid drives in the three failure groups. The last point in each figure corresponds to a disk failure. Number of health records prior to failure
s = 0.348t - 1.4631 R² = 0.9318
2
3
s = 0.093t2 - 0.1171t - 0.998 R² = 0.9851
s = -0.0734t3 + 0.6436t2 - 1.3432t - 0.2271 R² = 1
(a) Group 1. Degradation window di = 3. Figure 8.
0 -0.1 -0.2 -0.3 -0.4 -0.5 -00.66 -0.7 -0.8 -0.9 -1 -1.1
Number of health records prior to failure
s = 0.0021t - 0.8667 R² = 0.9501
s = 3E-07t 3E 07t2 + 0.002t 0 002t - 0.8585 0 8585 R² = 0.9503 s = 3E-08t3 - 2E-05t2 + 0.0044t - 0.9364 R² = 0.9651
(b) Group 2. Degradation window di = 377.
Degradation value
1 Failure degradation Linear (Failure degradation) 1st-order fit Poly. (Failure degradation) 2nd-order fit 3rd-order fit Poly. (Failure degradation)
0 15 30 45 60 75 90 105 120 135 150 165 180 195 210 225 240 255 270 285 300 315 330 345 360 375
0
Degrada ation value
Degrada ation value
Number of health records prior to failure 0 -0.1 -0.2 -0.3 -0.4 -0.5 -0 6 -0.6 -0.7 -0.8 -0.9 -1 -1.1
0 -0.1 -0.2 -0.3 -0.4 -0.5 06 -0.6 -0.7 -0.8 -0.9 -1 -1.1
0
1
2
3
4
5
6
7
8
9
10 11 12
s = 0.0497t - 1.1149 R² = 0.5068 s = 0.0096t2 - 0.084t - 0.7806 R² = 0.7127
s = 0.0031t3 - 0.0563t2 + 0.2985t - 1.3074 R² = 0.941
(c) Group 3. Degradation window di = 12.
Failure degradation of the centroid drives in the three failure groups.
that we study experiences diverse workloads and its disk failures display different manifestations, and thus is more general. Our proposed approach can categorize disk failures, which has great importance. It enables us to characterize and understand behaviors of different types of failures, i.e., the degradation signatures presented in Section IV-C, and also allows us to select suitable techniques to predict and handle disk failures. C. Disk Degradation Signatures The second question we address is “How do disk failures occur and what is the failure degradation process?”. To find the degradation of a disk failure, we compare the similarity of every health record with the failure record belonging to the same failed drive. We test Euclidean distance and Mahalanobis distance [26] to compute the similarity. Euclidean distance provides us a better characterization of the changes of lower distances, while the lower Mahalanobis distances are all the same. Figure 7 presents the Euclidean distances for the centroid drives of the three failure groups. For Groups 1 and 3, Figures 7(a) and 7(c) show that the dissimilarity fluctuates with repeated increase followed by decrease until reaching zero (i.e., the failure event). However, for Group 2, the dissimilarity keeps decreasing to zero as shown in Figure 7(b). In Figure 7(a), the last (rightmost) decreasing curve with four health records (i.e., a degradation window) is extracted
and the distance is normalized to the range of [-1, 0] with “1” denoting the distance of zero (i.e., the failure event itself) and “0” for the largest distance. The resulting degradation process is illustrated in Figure 8(a). We use polynomial regression models of order 1 to 3 to fit the degradation curve. The R-squared value, a measure of goodness-of-fit, is listed for each model in the figure. Although the third-order model provides the best fit, the modeling complexity is high as four coefficients with unclear patterns need to be determined. Between the first and second order models, the latter achieves a better fit with a moderate modeling complexity. As shown in Figure 8(a), the degradation window has a size of di = 3. Thus the failure degradation signature, s1,i , modeled by the second-order polynomial regression, can be presented as 1 1 t − 1, (2) s1,i (t) = 2 t2 − di 3di where i is the drive index and t is the time (in hours) away from the failure event. When t = 0, si (0) = −1, i.e., the worst degradation referring to the failure event. A problem with Equation (2) is that si (di ) = −1/3 instead of zero as shown in Figure 8(a). The preceding model characterizes the degradation process well when t is small. However, as t increases, its goodness-of-fit becomes worse. This is mainly caused by the existence of the second term (i.e., the firstorder term) in the equation. To address this problem, we compare the performance of three signature models, i.e., Equation (2), a first-order polynomial s1,i (t) = 1/di t − 1
Correlation with failure degradation
1 0.8
Environmental Attributes POH TC
0.6 0.4 0.2
Group 1 and Group 3 In Degradation Window In 24-Hour Window RRER HER RRER HER -0.94 -0.91 -0.19 -0.14 -0.10 -0.02 0.04 0.12
In 20-Day Window RRER HER 0.10 -0.25 0.02 0.01
0 -0.2 -0.4
-0.6 -0.8
Group 1
Group 2
Group 3
Environmental Attributes POH TC
RRER HER RUE R-RSC
-1
Figure 9. Correlation of disk read/write attributes with failure degradation.
Figure 10.
and a revised second-order polynomial s1,i (t) = 1/d2i t2 − 1. Their goodness-of-fit measured by the root mean squared error (RMSE) are 0.24, 0.14 and 0.06, respectively. We can see the revised second-order polynomial solves the problem of Equation (2) and achieves the lowest RMSE. We analyze failures of other drives in Group 1. Their degradation signatures are similar with the centroid and the sizes of the degradation windows di are relatively small, i.e., no greater than 12. Therefore, we can model the degradation signature of disk failures in Group 1 as s1,i (t) =
1 2 t − 1. d2i
(3)
For Group-2 failures (Figure 7(b)), Figure 8(b) shows the failure degradation of the centroid, Drive 369. Compared with Group 1, Group 2 has a monotonic degradation over a long period of time, e.g., di = 377 that is 15.7 days for the centroid. This complies with the observation in [16] that the continuous accumulation of sector errors contributes to whole-disk failures. Figure 8(b) also shows that the first-order polynomial regression model achieves a high goodness-of-fit. With a large degradation window, the degradation signature of disk failures in Group 2 is s2,i (t) =
1 t − 1. di
(4)
Following the same way, we model failure degradation of Group 3 (Figure 7(c)), as depicted in Figure 8(c). The second-order polynomial is s3,i (t) =
1 2 1 t − t − 1. 2 di ai di
RRER 0.43 0.08
(5)
For the centroid failure from Drive 136, di = 12 and ai = 1. Equation (5) suffers from the same problem as that of Group 1. We evaluate four models: Equation (5), a firstorder polynomial s3,i (t) = 1/di t−1, a revised second-order polynomial s3,i (t) = 1/d2i t2 − 1, and a simplified thirdorder polynomial s3,i (t) = 1/d3i t3 − 1 (because third-order polynomial shows the best fit in Figure 8(c)). Their RMSEs are 0.45, 0.35, 0.22 and 0.16, respectively. The simplified third-order polynomial achieves the lowest RMSE and solves
Group 2 In 16-Day Window HER RUE 0.10 0.95 0.03 -0.08
R-RSC -0.90 0.18
Correlation of environmental attributes with failure degradation.
the problem of Equation (5). For other failed drives in Group 3, their di ranges from 10 to 24. The failure degradation signature of Group 3 follows s3,i (t) =
1 3 t − 1. d3i
(6)
To automate the deriving of disk degradation signatures, we have developed a software tool that processes health records of each failed drive, starting from the failure record backward to extract the degradation record set where distance to the failure record changes monotonically. The value of di is determined by the size of the degradation record set. Then our tool tests a set of polynomial regression models up to order n which is configurable, compares their RMSEs and selects the one with the smallest RMSE as the failure degradation signature. D. Contributing Attributes to Disk Failure Degradation We are interested in finding attributes that have significant influence on disk failure degradation. It will enable us to not only identify the start of a degradation process, but also develop techniques to alleviate the degradation. We present our analysis results of the centroid in each failure group. The findings are also applicable to other drives in the same group. Figure 9 shows the correlation of non-constant, disk read/write related attributes with failure degradation. From the figure, we can see the contribution of attributes to the degradation process varies among failure groups. RRER strongly correlates with the failure degradation in both Groups 1 and 3, while R-RSC and RU E are the top two attributes for Group 2. Existing research indicates that temperature and total operating time affect disk health [22], [7]. Since they are environmental factors which do not cause disk failures directly, we analyze their influence on the read/write attributes that are highly correlated with failure degradation. The two tables in Figure 10 present the results. In the dataset, P OH of a drive decreases a little abruptly after a long period of time (The value is reduced by one for every 876 hours). To reflect the one-hour interval between two consecutive
0
−10
Group 2 failures
−10
Group 2 failures
−20
POH Z−Scores
TC Z−Scores
−30 −20 −30
Group 3 faiures −40 −50
−40 −50 −60
Group 1 faiures
−70 −80 −90
−60
Group 1 failures
−100
−70
Group 3 failures
−110 −80
0
40
80
120
160
200
240
280
320
360
400
440
480
Time
Figure 11. Comparison of temporal z-scores of the attribute T C among the three failure groups. Time 0 corresponds to the time points of disk failures and each value in the timeline represents the number of hours prior to failures. The failed drives in Group 1 display the most significant difference from good drives in terms of the drives’ temperature.
samples, P OH is updated by adding a very small constant to its values between consecutive samples. For Groups 1 and 3, P OH shows a strong correlation with both RRER and HER in the degradation windows which are relatively small. This is reasonable because disk health deteriorates in the degradation window and P OH decreases monotonically as well. However, when we extend the analysis to 24 hours and even to include all health records of the failed drives, the influence of P OH diminishes. For Group 2, the degradation window is relatively large, the influence of P OH on RU E and R-RSC is obvious following the same reason. In all cases, T C has little correlation with the read/write attributes. Therefore, P OH and T C are not critical factors that intensify the degradation of disk failures, but this does not exclude their contribution to starting or triggering the degradation process as shown in Section V. V. I MPLICATIONS AND D ISCUSSIONS The focus of this paper is on the characterization of degradation signatures for different categories of disk failures. Our proposed approach can discover disk failure types and model degradation processes based on disk SMART data. They are generic and can be applied to other storage systems. The degradation signatures produced by our approach for a storage system provide insights on the development of disk failures, which is useful for failure handling and prediction on that system. In this section, we discuss some applications of the findings revealed by our approach. A. Diagnosis and Possible Prevention of Disk Failures Disk drives in a large-scale storage system may fail for different reasons. Our proposed failure categorization approach can identify the types of disk failures, which allow us to find the breakdowns of different failure types and develop techniques to prevent or handle them.
0
40
80
120 160 200 240 280 320 360 400 440 480
Time
Figure 12. Comparison of temporal z-scores of the attribute P OH among the three failure groups. The failed drives in Group 3 display the most significant difference from good drives in terms of the total time that drives are powered on.
Take the data center that we study in this paper as an example. The majority (59.6%) of disk failures falls into one category, i.e., Group 1, as listed in Table II. Based on the properties of those disk failures, our approach identifies their type as logical failures. This finding enables us to focus on addressing logical failures so that the reliability of our storage system can be dramatically enhanced. Logical failures may be caused by corrupted files and human errors, which damage disk’s file structure or software. To effectively address them, we need to diagnose those failures and find the actual cause(s). However, disk drives are sealed devices and usually their diagnosis cannot be done until the failed drives are returned to the disk manufacturers and gone through a complicated process. Thus, the diagnosis results are not available at all or in a timely fashion. We, instead, explore the same disk SMART dataset as used in our previous analysis to pinpoint the cause of those logical failures. Specifically, for each disk health attribute a in the dataset, we analyze the difference between the values of a among the failed drives in Group 1 and those from the good drives. We quantify this difference by using z-score [18], which is calculated as ma,f − ma,g za = r , (7) 2 σa,f nf
+
2 σa,g ng
where ma,f and σa,f are the mean and variance of the attribute a for failed drives, ma,g and σa,g are the mean and variance for good drives, nf and ng are the total number of health samples of failed and good drives respectively. We extend the calculation of z-score to the 20-day period, that is starting from the failure records, at each number of hours before failures, a z-score is computed based on the health records of drives in a failure group at that time point and all records of good drives. We have calculated z-cores of all 12 attributes. Among them, we find that T C is the only attribute that can distinguish Group 1 from the other two groups.
Yes -0.68 5%
-0.65 1%
0.85 100% POH < 0
-0.35 1% SUT < 0.96
0.92 95% TC < -0.74
0.69 0%
-0.53 1%
Table III ROOT-M EAN -S QUARE E RRORS OF D ISK D EGRADATION P REDICTION FOR THE T HREE FAILURE G ROUPS .
No
-0.37 2% SUT < 0.96
0.94 94% -0.21 RUE < 0.99 0.95 1% 93% 0.88 POH < 0.53 32% SER < 0.48 0.96 30% 0.71 0.57 SER < 0.5 0% 3% -0.62 POH < 0.11 0.75 0%
0.99 61%
0.99 27%
3% 0.09 1%
SUT < 0.85
0.97 2%
Figure 13. The regression tree model for disk degradation prediction of Failure Group 1.
Figure 11 shows the temporal z-scores of T C for the three failure groups. From the figure, we can see that all of the groups have a negative difference from good drives in T C, which means the temperature of failed drives is higher than that of good drives. Moreover, the figure tells us that the temperature of drives in Group 1 is the highest compared with the other two groups and this persists throughout the 20-day period (The extend of the difference reduces as time goes to 480 hours prior to failures). This result implies that disk temperature is the most important factor causing logical failure in the data center under study. Therefore, technologies that can cool down disk drives, such as SuperCaddy [1] for hard drive cooling, temperature control knobs [22] for racks and thermal-aware scheduling [6], can be explored to reduce the number of logical failures, which will in turn improve the storage system’s reliability. The temporal z-scores of P OH, as shown in Figure 12, indicate that more backup operations should be performed for disk drives that are either new or old in order to reduce the possibility of data loss caused by disk failures in Group 2 and Group 3. B. Degradation Prediction of Disk Failures Another important application of the findings from our study is to predict disk failures. Existing failure prediction techniques, presented in Section II-C, can only predict possible occurrence of disk failures of all types. With the disk degradation signatures produced by our degradation characterization approach, we can predict not only disk failures of each type, but also their degradation at different stages. We use Regression Tree as an illustrating method for disk degradation prediction due to its cost-effectiveness and ease of interpretation. Other prediction methods can also be applied. Regression tree produces a nonlinear input/output mapping. In a regression tree model, each test has a quantitative target value describing the drive’s degradation status rather than a class label indicating good or failed. The
RMSE Error rate
Group 1 0.216 10.8%
Group 2 0.114 5.7%
Group 3 0.129 6.4%
training algorithm splits disk health samples based on one or multiple health attributes at each node in the tree. In order to find the best split, the algorithm checks all possible splitting attributes, as well as all possible values of the attributes used to split the node. The measure of the best split is the minimum of the squared error. For each possible split, the sum of the squared errors with regard to the mean value of child nodes for the target variable is calculated. We choose the best split that yields the smallest sum of squared errors within the child nodes. For a disk health attribute a, the sum of squared errors within a node is calculated as Ea =
n X (ya,i − ma )2 ,
(8)
i=1
where n is the number of disk health samples at the node, ya,i is the value of a in the ith sample, and ma is the mean. We set the target values of health samples from good drives to 1, representing the good health status of those drives. For each health sample from a failed drive, its target value a real value calculated by Equation (3), (4) or (6) depending on the type of that disk failure. The size of the degradation window di is set to 12, 380 and 24 for Groups 1-3 respectively. For each failure type, we mix the health samples from the failed drives with 10 times number of samples from good drives, and then randomly place a sample from the new dataset to either a training set (70% sample population) or a test set (30% population). Figure 13 shows the regression tree model created from the training set for the first failure type. Due to space limit, the models for the other two failure groups are presented here. Based on the regression tree models, we find that the degradation of Group-3 failures can be easily described by using only one health attribute, i.e., R-RSC, which complies with our findings in failure categorization that those drives suffer from read/write head failures and have a large number of reallocated sectors due to write errors. For Group-1 and Group-2 failures, P OH, T C and RU E are the critical attributes (with different extents of importance for the two groups) to characterize disk degradations. These regression tree models are then used for degradation prediction on the three test sets respectively. The root-mean-spare errors (RMSE) are calculated for these predictions. By considering the range of the target values, we calculate the error rates. Table III shows the prediction performance. From the table, we can see the accuracy of degradation prediction is high, as the error rate is no more than 6.4% for Groups 2 and 3
and a little above 10% for Group 1. Since the focus of this paper is not on failure prediction, we do not evaluate the performance of other prediction methods. VI. C ONCLUSIONS AND F UTURE W ORK Previous works on disk drive failures cannot differentiate prediction or handling of disk failures with different manifestations, due to the fact that the information of failure types is not available. In this paper, we address these issues and analyze disk health data collected from a production data center. We propose novel approaches to categorize disk failures based on their distinctive manifestations and properties, and characterize the degradation of disk errors to failures by deriving the degradation signatures for each failure category. While we expect that the techniques presented here apply to all storage systems, the specific analysis were performed on a disk dataset collected from a production data center. As a future work, we plan to extend the analysis and evaluate the proposed techniques on other storage systems and datasets and consumer-grade disk drives. We will test more prediction methods and evaluate their performance for disk degradation prediction. We also plan to leverage the models of data center workloads [21] and cloud file systems [20] and the techniques of proactive failure management [11], [28], [12] that we have developed to build a middleware software that will enhance storage reliability. We will open source the tool developed in this work. ACKNOWLEDGMENT The authors would like to thank the anonymous reviewers for their constructive comments and suggestions. R EFERENCES [1] Green revolution cooling introduces supercaddy for hard disk drives. http://www.grcooling.com/wpcontent/uploads/2015/03/2013-02-28-Green-RevolutionCooling-Introduces-SuperCaddy-for-Hard-Disk-Drives.pdf. [2] B. Allen. Monitoring hard disks with SMART. Linux Journal, (117), 2004. [3] L. N. Bairavasundaram, A. C. Arpaci-Dusseau, R. H. ArpaciDusseau, G. R. Goodson, and B. Schroeder. An analysis of data corruption in the storage stack. ACM Trans. on Storage (TOS), 4(3):8:1–8:28, 2008. [4] L. N. Bairavasundaram, G. R. Goodson, S. Pasupathy, and J. Schindler. An analysis of latent sector errors in disk drives. In Proc. of ACM SIGMETRICS, 2007. [5] P. Bodik, M. Goldszmidt, A. Fox, D. B. Woodard, and H. Andersen. Fingerprinting the datacenter: Automated classification of performance crises. In Proc. of EuroSys, 2010. [6] M. T. Chaudhry, T. C. Ling, A. Manzoor, S. A. Hussain, and J. Kim. Thermal-aware scheduling in green data centers. ACM Computing Surveys (CSUR), 47(3):39:1–39:48, 2015. [7] G. Cole. Estimating drive reliability in desktop computers and consumer electronics systems. Technical Report TP-338.1, Seagate Technology, 2000. [8] B. Eckart, X. Chen, X. He, and S. L. Scott. Failure prediction models for proactive fault tolerance within storage systems. In Proc. of IEEE MASCOTS, 2008.
[9] J. G. Elerath and S. Shah. Server class disk drives: How reliable are they? In Proc. of Annual Reliability and Maintainability Symposium, 2004. [10] J. Gray and C. V. Ingen. Empirical measurements of disk failure rates and error rates. Technical Report MSR-TR-2005166, Microsoft Research, 2005. [11] Q. Guan and S. Fu. Adaptive anomaly identification by exploring metric subspace in cloud computing infrastructures. In Proc. of IEEE SRDS, 2013. [12] Q. Guan, Z. Zhang, and S. Fu. Proactive failure management by integrated unsupervised and semi-supervised learning for dependable cloud systems. In Proc. of IEEE Intl. Conf. on Availability, Reliability and Security, 2011. [13] G. Hamerly and C. Elkan. Bayesian approaches to failure prediction for disk drives. In Proc. of ICML, 2001. [14] G. Hughes, J. Murray, K. Kruetz-Delgado, and C. Elkan. Improved disk-drive failure warnings. IEEE Trans. on Reliability, 51(3):350–357, 2002. [15] J. Li, X. Ji, Y. Jia, B. Zhu, G. Wang, Z. Li, and X. Liu. Hard drive failure prediction using classification and regression trees. In Proc. of IEEE DSN, 2014. [16] A. Ma, F. Douglis, G. Lu, D. Sawyer, S. Chandra, and W. Hsu. RAIDShield: Characterizing, monitoring, and proactively protecting against disk failures. In Proc. of USENIX FAST, 2015. [17] J. Murray, G. Hughes, and K. Kreutz-Delgado. Hard drive failure prediction using non-parametric statistical methods. In Proc. of Intl. Conf. on Artificial Neural Networks, 2003. [18] J. F. Murray, G. F. Hughes, and K. Kreutz-Delgado. Machine learning methods for predicting failures in hard drives: A multiple-instance application. Journal of Machine Learning Research, 6:783–816, 2005. [19] E. Pinheiro, W.-D. Weber, and L. A. Barroso. Failure trends in a large disk drive population. In Proc. of USENIX FAST, 2007. [20] Z. Ren, W. Shi, and J. Wan. Towards realistic benchmarking for cloud file systems: Early experiences. In Proc. of IEEE IISWC, 2014. [21] Z. Ren, X. Xu, J. Wan, W. Shi, and M. Zhou. Workload characterization on a production hadoop cluster: A case study on taobao. In Proc. of IEEE IISWC, 2012. [22] S. Sankar, M. Shaw, K. Vaid, and S. Gurumurthi. Datacenter scale evaluation of the impact of temperature on hard disk drive failures. ACM Trans. on Storage (TOS), 9(2):6:1–6:24, 2013. [23] B. Schroeder and G. A. Gibson. Disk failures in the real world: What does an mttf of 1,000,000 hours mean to you? In Proc. of USENIX FAST, 2007. [24] T. Schwarz, M. Baker, and et al. Disk failure investigations at the internet archive. In Proc. of IEEE MSST, 2006. [25] K. V. Vishwanath and N. Nagappan. Characterizing cloud computing hardware reliability. In Proc. of ACM SoCC, 2010. [26] Y. Wang, Q. Miao, E. W. Ma, K.-L. Tsui, and M. G. Pecht. Online anomaly detection for hard disk drives based on mahalanobis distance. IEEE Trans. on Reliability, 62(1):136– 145, 2013. [27] Q. Xin, J. E. Thomas, S. J. Schwarz, and E. L. Miller. Disk infant mortality in large storage systems. In Proc. of IEEE MASCOTS, 2005. [28] Z. Zhang and S. Fu. Failure prediction for autonomic management of networked computer systems with availability assurance. In Proc. of IEEE IPDPS, 2010. [29] Y. Zhao, X. Liu, S. Gan, and W. Zheng. Predicting disk failures with HMM- and HSMM-based approaches. In Proc. of ICDM, 2010.