Key words: Complex Networks, Structural Complexity, Random Graph. Generators .... logarithm of the number of networks belonging to the ensemble.
Characterizing the Structural Complexity of Real-world Complex Networks Jun Wang and Gregory Provan Department of Computer Science, University College Cork, Ireland {jw8,g.provan}@cs.ucc.ie Abstract. Although recent research has shown that the complexity of a network depends on its structural organization, which is linked to the functional constraints the network must satisfy, there is still no systematic study on how to distinguish topological structure and measure the corresponding structural complexity of complex networks. In this paper, we propose the first consistent framework for distinguishing and measuring the structural complexity of real-world complex networks. In terms of the smallest d of the dK model with high-order constraints necessary for fitting real networks, we can classify real-world networks into different structural complexity levels. We demonstrate the approach by measuring and classifying a variety of real-world networks, including biological and technological networks, small-world and non-small-world networks, and spatial and non-spatial networks. Key words: Complex Networks, Structural Complexity, Random Graph Generators
1 Introduction Heavy-tailed or scaling degree distributions, found in many real-world networks (including a variety of social networks, biological systems and technological systems) [1], have been posited as a “universal class” of such complex systems. However, recent research has challenged the arguments that such distributions are special and signify a common architecture, independent of the system’s functional properties or domain role [2, 3]. Although people realized that the complexity of a network depends on its structural organization, which is linked to the functional constraints the network has to satisfy [4], there is still no systematic study on how to distinguish topological structure and measure the corresponding structural complexity of various real-world networks. The structural complexity measures of complex networks have been discussed before [5, 6]. However, there is little consistency among the proposed measures, and most analyses are based on very small graphs with only a few nodes [5, 6]. More importantly, prior work [5, 6] only showed that real-world networks are “complex” in the sense that different topological features deviate from classic ER random graphs or simple structures like regular lattices [1]. In contrast, we try to finely distinguish structural complexity among real-world networks.
2
Jun Wang, Gregory Provan
One approach to characterize the structure of real-world networks is to compare them to “appropriate” null models. Appropriate null models include random network ensembles with some of the statistical features being present in the real-world network under investigation. The classic ER ensemble is the simplest example of the so-called “maximally random” graphs [1], and the only constraint is the average degree of the real network. The deviation of data collected on realworld networks from the predictions of the ER model triggered interest in more advanced random network models [1], because it implied that those graphs were not created just by joining vertices at random, but required the existence of additional constraints. The classic random graph model can be naturally extended to define network ensembles that have other high-order topological characteristics in common with a real network [7, 4]. Recently, a dK-random graph model was proposed to specify all degree correlations within d-sized subgraphs of a given network [7]. The 1K-distribution defines a family of 1K-graphs which reproduce the original graph’s node degree distribution, and is equal to generating the widely-used generalized random graph (GRG) model. 2K-graphs reproduce the joint degree distribution, the 2Kdistribution, of the original graph. 3K-graphs consider interconnectivity among triples of nodes, and so forth. Generally, the set of (d + 1)K-graphs is a subset of dK-graphs. In other words, larger values of d capture increasingly complex properties of the original graph and further constrain the number of possible graphs, so any specified topology metric we can define on a real network will eventually be captured by dK-graphs with a sufficiently large d. However, the computational complexity of generating dK-graphs increases exponentially in d. One main concern with dK-graphs is how fast the dK model converges toward the real network. So for creating realistic but “random” ensembles, it is important to find the smallest d which can match the real network with sufficient fidelity in terms of the specified topology metrics of specific applications. Since the smallest d in the dK-graphs determines the number of constraints, as well as the computational complexity necessary for fitting the real network, we use the smallest value of d as an indicator of the level of structural complexity of the real network. We also need a set of graph metrics to evaluate the fidelity of generated random graphs, and a wide range of topological metrics have been proposed recently [7]. Not all topology metrics are mutually independent: some either fully define others, or significantly narrow down the spectrum of their possible values [7]. Therefore, identifying the underlying principles of such definitive metrics reduces the number of topology characteristics that models must reproduce. The dK-distributions themselves present one possible approach to constructing a family of such simple metrics which define all others. Recent research showed that the 2K-distribution, the joint degree distribution, appears to play a central role in determining a wide range of other existing topological properties [7].
Characterizing the Structural Complexity of Real-world Complex Networks
3
The s-Metric1 is a scalar summary statistic of the joint degree distribution, and potentially unifies many aspects of complex networks, because it is closely related to betweenness, and linearly related to graph assortativity [3]. Obviously, the sMetric is a succinct but rich topology metric. In addition, shortest paths play an important role in transport and communication within a network. A measure of the typical separation in the network is given by the characteristic path length, defined as the mean of shortest lengths over all pairs of nodes [1]. The above two metrics help to characterize the topological structures of various real-world complex networks, and are effectively applied to experimental analyses in this paper. This paper makes two main contributions. First, based on the dK model analysis, we propose the first consistent framework for distinguishing and measuring structural complexity of real-world complex networks. The approach can be applied to complex networks with different topologies in any application domain. Second, we demonstrate our analyses on a variety of real-world complex networks, and classify them into different levels of structural complexity. This provides the first clear classification of real-world networks in terms of their structural complexity. In our analyses, we surprisingly found that a wide range of complex networks, including electronic circuits, transportation systems, brain and neuronal systems, and protein interaction networks (PINs), have the same level of structural complexity and can be matched well by the simple 1K (GRG) model. We argue that these networks have a common set of explicit or implicit geometric constraints. The router-level Internet and transcription regulatory networks (TRNs) show higher structural complexity, and at least the 2K model is necessary for fitting them. Recent research showed that highly complicated technological and economic constraints have big impacts on shaping the topological structure of the Internet. It will be very interesting to study why the topological structure of the TRN is much more complex than that of the PIN. We also surprisingly found that a pulp mill system has a very high level of structural complexity, which cannot even be captured by the 3K model. We think that different types of devices and complicated interfaces between them lead to the high level of structural complexity of the system. We organize the remainder of the document as follows. Section 2 introduces some related work. Section 3 applies the dK model analysis to a variety of realworld complex networks and classifies them into different levels of structural complexity. Finally, section 4 summarizes our work.
2 Related Work This level of structural complexity based on the dK model is consistent with the concept of entropy in statistical mechanics. In Bianconi’s definition [4], the P 1 The s-Metric of a graph G is defined as s(G) = d d , where (i, j) ranges edge(i,j) i j over the edges in the graph, and di and dj are the degrees of the node i and j respectively.
4
Jun Wang, Gregory Provan
entropy of a network ensemble under specific constraints is proportional to the logarithm of the number of networks belonging to the ensemble. The complexity of a given ensemble of networks increases as the number of networks in the ensemble decreases. As we add further constraints that a desired ensemble is to have in common with a given real network, we effectively consider ensembles with decreasing cardinality. Consequently a network ensemble of high complexity corresponds to a small variability of the networks in the ensemble. We expect that a very complex network belongs to an ensemble of functionally equivalent networks of small entropy. A larger value of d reflects higher complexity and smaller entropy. Real-world networks generally are classified based on specific topological properties, such as different (power-law or exponential) degree distributions [8], or power-law exponents of the betweenness centrality distributions [9]. In contrast, our approach classifies real-world networks from a new dimension using the corresponding random graph models necessary for fitting original networks.
3 Analyzing Structural Complexity of Real-world Complex Networks In this section we analyze a variety of real-world complex networks and classify them into the corresponding levels of structural complexity. Figure 1 shows a general view of our results, and the details are discussed in the following sections. 3.1 Networks with 1K Complexity We surprisingly found that the simple 1K (GRG) model, which is independent of any domain-specific growth process and only reproduces the degree distribution [1], can closely match the topologies of a variety of technological and biological networks, as listed in Table 1. In this paper, the Markov-chain Monte Carlo (MCMC) switching algorithm [10, 11, 7] has been used to implement the 1K, 2K and 3K models, and to generate experimental data in order to reduce statistical variance 2 . All networks listed in Table 1 have highly heterogeneous heavy-tailed degree distribution [17, 18, 13, 14, 15, 16]. Except the core S. Cerevisiae protein interaction network [16], all networks are spatial networks which occupy some physical space, such that their nodes occupy a position in two- or three-dimensional Euclidean space, and their edges are real physical connections [1]. It is not surprising that the topology of spatial networks is strongly constrained by their geographical embedding. All these man-made and biological spatial networks 2
The MCMC switching algorithm generates uniform sample of graphs having the dKdistribution, while remaining unbiased (random) with respect to all other properties. However, this results in non-uniform sampling of graphs with different values of properties that are not fully defined by the dK-distribution. In this sense, the graphs generated by the dK model are the maximally random graphs [11, 7].
Characterizing the Structural Complexity of Real-world Complex Networks
5
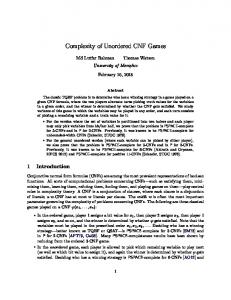
2 1K of the Internet and TRNs
Normalized s-Metric
1.5
1K, 2k and 3K of the pulp mill
1
1K of circuit, transportation, brain, neuronal and PIN networks. 2K, 3K of the Internet and TRNs.
0.5
0 0
0.5 1 1.5 Normalized Characteristic Path Length
2
Fig. 1. The plot of the normalized values of characteristic path length and s-Metric of 1K (squares), 2K (open circles) and 3K (solid circles) models of a variety of real-world networks discussed in this paper. The values are normalized by those of real networks, so the coordinate (1, 1) means perfect fitting of the real networks. Table 1. Comparing topology metrics for the real-world networks (the digital circuits in ISCAS-85 benchmark suite [12], the German highway network (Autobahn)[13], the Chinese airport network [14], the giant component of the anatomical network of the human cerebral cortex using cortical thickness measurements from magnetic resonance images [15], the Macaque cortical connectivity network within one hemisphere [13], the C. elegans neuronal networks [13], the giant component of the core S. Cerevisiae protein interaction network [16]) and the corresponding 1K model. All values of random graphs are averaged over 100 graphs respectively. Network Circuit C432 Circuit C499 German highway Chinese airport Human Brain Macaque Brain C. elegans(local) C. elegans(global) S. Cerevisiae PIN
Characteristic path length s-Metric real 1K real 1K 4.53 4.33 ± 0.05 6986 6875.99 ± 143.46 4.65 4.4 ± 0.06 9848 10491.57 ± 306.78 19.42 17.33 ± 0.63 8025 7904.1 ± 61.45 2.07 2.06 ± 0.01 1728592 1716900.08 ± 3647.17 3.05 2.65 ± 0.05 3957 3819.35 ± 65.61 1.78 1.70 ± 0.08 2368861 2375055.27 ± 4136.29 2.52 2.35 ± 0.08 127622 126103.72 ± 591.41 2.64 2.35 ± 0.06 916807 911946.68 ± 9739.35 5.26 4.48 ± 0.01 749149 846220.16 ± 11800.32
6
Jun Wang, Gregory Provan
share a common planning principle: wire cost optimization over the entire network [19, 13, 20] Wire cost optimization is obvious and natural in transportation planning. In circuit design, wire length has been treated as the prime parameter for performance evaluation since it has a direct impact on several important design parameters [20]. In the brain and neuronal systems, energy is consumed in establishing fibre tracts between neurons, and in propagating action potentials over these fibres. Thus, the total cost of all wires should be kept as low as possible [21]. Although the exact origin of the wiring cost is not completely known, the farther apart two neurons are, the more costly is the connection between them [21]. In addition, the graph distance (the number of hops between nodes) also has an important impact on functions of spatial networks. For instance, graph distance can capture another driving force underlying circuit design, timing, where it is important to reduce the delay of signal transmission among components. Similarly, minimizing the average number of processing steps–that is, reducing the number of intermediate transmission steps in neural integration pathways– has several functional advantages [21]. Too many transfer flights are bothering in an air journey, but most road travelers look for routes that are short in terms of miles, and the number of legs is often considered less important. The graph distance can be characterized by the characteristic path length. Recent research showed that an optimization model (OPT) trading-off the wire cost and the graph distance can capture the topologies of specific spatial networks, like the electronic circuits [18], and under appropriate parameters, a preferential attachment model with spatial constraints (SPA) can generate smallworld network structure close to that of networks generated by the OPT model [18, 22]. The SPA model and its extension can closely match the topologies of electronic circuits, the brain networks and airport networks [18]. Our experiments also showed that the OPT model with setting of strong preference for reducing wire cost can also capture the topology of the highway network. Naturally, the highway network is not a small-world network, as the characteristic path length is twice as large as for comparable ER models [13]. All other spatial networks listed in Table 1 are small-world graphs [17, 18, 13, 14, 15, 16]. So the 1K model can match both small-world networks and non-small-world networks well. The 1K model itself is independent of any system growth process, but the degree distributions of the above spatial networks are shaped and constrained under domain-specific spatial constraints. Actually, the parameters corresponding to spatial constraints in the SPA and OPT model can be tuned to generate diverse degree distributions. The degree distributions of the above networks implicitly reflect some spatial constraints with various strength shaping the network structures. Maybe that’s the reason why the 1K model can closely match these spatial networks. In addition to our results in Table 1, there is also a lot of other solid evidence that the 1K model closely captures the topologies of the PINs. Przulj
Characterizing the Structural Complexity of Real-world Complex Networks
7
et al. proposed a “Stickiness Index” model for the a series of PINs and showed that it outperforms other models in terms of a range of topology metrics including relative subgraph frequency [23]. Actually, the “Stickiness Index” model is a stochastic implementation of the 1K model proposed by Chung et al., in which the connection between nodes i and j is chosen independently with probability pij , with pij proportional to the product of the degree of i and j [24]. This approach is convenient for theoretical analysis, since rigorous proofs for a random graph with exact degree sequences is rather complicated and usually requires additional “smoothing” conditions because of the dependency among the edges [24]. This stochastic implementation and the MCMC switching implementation are “basically asymptotically equivalent, subject to bounding error estimates” [3]. Ivanic et al. recently also analyzed a series of PINs and found the so-called “degree-weighted behavior” that the probability of an interaction between two proteins is generally proportional to the numerical product of their individual interacting partners, or degrees [25]. The “degree-weighted behavior” is consistent with the definition of the stochastic 1K model. They found that the degree-weighted behavior is manifested throughout the PINs studied, except for the high-degree, or hub, interaction areas. Their finding is also consistent with our results of the s-Metric in Table 1, in which the s-Metric of the corresponding 1K model is about 12% higher than that of the S. Cerevisiae PIN. But the probabilities of interaction between the hubs are still high, and these hubs are separated by very few links, so the discrepancy of s-Metric data of the S. Cerevisiae PIN in Table 1 is only about 12%. Ivanic et al. further proposed a degree-conserving degree-weighted (DCDW) model [25], which actually is a matching implementation of the 1K model and has only very small deviations from the MCMC switching implementation [11], and showed that this model can closely capture the PINs in terms of a series of topological properties. Friedel et al. showed that PINs are in general most similar to uncorrelated networks, which are implemented by the MCMC switching 1K model, with regard to degree correlations and all other network properties considered [26]. The PINs are different from the above spatial networks because they are not explicitly embedded in any observable physical space. However, Przulj et al. showed that a random geometric model can accurately capture the PIN structures in terms of relative subgraph frequency [27]. Higham et al. [28] pushed the research further by exploiting the fact that the geometric property can be tested for directly. They applied a algorithm, which has been verified in the sense that it successfully rediscovers the geometric structure in artificially constructed geometric networks, to a series of publicly available PINs of various organisms, and indicated that geometric effects are present. Testing on a high-confidence yeast data set produced a very strong indication of geometric structure. Overall, the results add support to the hypothesis that PINs have a geometric structure. Serrano et al. discussed the hidden variables formalism, taking as hidden variables nodes’s coordinates in a metric space [29]. Each two nodes are located at a certain hidden metric distance, and connected with a probability, which relates the network topology to the underlying metric space. This probability depends
8
Jun Wang, Gregory Provan
on the metric distance [29]. It seems that hidden metric spaces do exist for the PINs, and implicit geometric constraints play an important role in shaping the observed PIN topologies. According to the above analyses, we think that the explicit or implicit geometric constraints are probable underlying driving forces shared by all the above networks with 1K complexity. For these networks, reproducing only the 1K constraints can also closely fit the 2K statistics represented by the s-Metrics. 3.2 Networks with 2K Complexity In this section, we show additional complex networks which also have power law degree distributions but need higher-order statistics to capture their structures. As shown in Table 2, the 1K model is not sufficient to match the topologies of the router-level Internet [3, 7] and the transcriptional regulatory networks of E. Coli [30]. Table 2. Comparing topology metrics for the real-world networks (the router-level topology of the Internet of a single ISP (HOT) [3, 7], the giant components of two E. coli transcriptional regulatory networks, collected by Shen-Orr. et al. and Ma et al. [30], respectively, and the pulp mill [31]), and the corresponding 1K, 2K, 3K models. All values of random graphs are averaged over 100 graphs respectively. Network
Characteristic path length real 1K 2K 3K Internet 6.81 5.91 6.33 6.55 ±0.17 ±0.13 ±0.13 TRN(Shen-Orr) 4.83 3.99 4.28 4.65 ±0.06 ±0.06 ±0.05 TRN(Ma) 3.99 3.25 3.51 3.96 ±0.02 ±0.01 ±0.01 Pulp Mill 11.62 6.71 6.87 7.43 ±0.13 ±0.14 ±0.16
s-Metric real 1K 28442 54023.71 ±4437.59 26621 42402.61 ±1782.63 1301244 2375893.92 ±43876.86 3629 3647.44 ±54.88
2K 28442
3K 28442
26621
26621
1301244 1301244 3629
3629
The router-level Internet shown in Table 2 has an s-Metric value much lower than that of the corresponding 1K model, so the organizing principles of the Internet are completely different from the networks with 1K complexity listed in Table 1. The s-Metric is linearly related to the network assortivity coefficient, and a relatively lower s-Metric value means a relatively disassortive connectivity pattern in which high-degree nodes are less likely to be connected with each other [3]. The router-level Internet is also a spatial network, but it is subject to more complicated technological and economic constraints [3], and has much more complex topology structure. In general, a router can have a few high bandwidth connections or many low bandwidth connections, because limits in technology fundamentally preclude the possibility of high-degree, high-bandwidth routers [3]. The high-end backbone routers in the network core have only a few high-
Characterizing the Structural Complexity of Real-world Complex Networks
9
speed and long-haul connections, and edge routers (in the “last mile”) are typically slower overall, but have many low-speed connections. So, for the router-level Internet, high-degree nodes can exist, but are found only within local networks at the far periphery of the network, and would not appear anywhere close to the backbone [3]. This pattern can result in high performance (traffic flow) and robustness to failures [3]. In contrast, in the networks shown in Table 1, the high-degree nodes are more likely to connect to each other and appear in the cores of the networks, because these networks have high s-Metric values close to those of the corresponding 1K models [3]. As we mentioned before, the joint degree distribution can determine a wide range of other important topological properties, except clustering [3, 7]. The 2K model reproduces the joint degree distribution, so the s-Metric, which is scalar summary statistics of the joint degree distribution, can be completely matched when d ≥ 2. As shown in Table 2, by increasing d the dK-random graphs constantly converge toward the real networks. Actually, in additional to the topology metrics listed in Table 2, clustering coefficients and 3-node motifs [1], which depend on interconnectivity among tripes of nodes, can be completely matched when d = 3, and 4-nodes motifs can be completely matched when d = 4. But model selection has to make trade-offs between fidelity and complexity according to domain requirements. The implementations of 1K and 2K models are relatively simple, but when d ≥ 3 the implementations become much more complex due to the increasing number of non-isomorphic simple connected graph of size d [7]. As shown in Table 2 and Figure 1, from 1K to 2K the fidelity improves dramatically, but there is only relatively mild improvement from 2K to 3K. Mahadevan et al. also found that the d = 2 case is sufficient for most practical purposes for the Internet topology [7]. Furthermore, we analyzed two widely-used TRNs listed in Table 2. The TRNs are directed networks where a transcription factor positively or negatively regulates the RNA transcription of the controlled protein. In this paper, we mainly focus on general organizational principles of networks, so we ignore the direction of links in the TRNs and treat them as undirected graphs. But all methods in our analyses can be easily applied to directed graphs as well. The structures of the TRNs have patterns similar to the Internet: links between high-degree nodes are systematically suppressed, whereas those between high-degree nodes and low-degree nodes are favored, so as shown in Table 2, they naturally have much lower s-Metric values than those of the 1K model. Maslov et al. also quantified correlations between connectivities of interacting nodes in the TRN of the yeast S. cerevisiae and compared them to the 1K model, and their empirical results showed the disassortive pattern similar to that in the TRNs of E. Coli we analyzed [10]. It is feasible that molecular networks in a living cell have organized themselves in an interaction pattern that is both robust and specific. Topologically, the specificity of different functional modules can be enhanced by limiting interactions between hubs and suppressing the average connectivity of their neighbors. This effect decreases the likelihood of cross talk between different functional modules of the cell, and increases the overall robustness of a
10
Jun Wang, Gregory Provan
network by localizing effects of deleterious perturbations [10]. Similarly, the 2K model captures the structures of the TRNs listed in Table 2 and Figure 1 much better than does the 1K model, and setting d = 3 only improves fitting mildly. Some researchers conjectured that it appears likely that the 3K model will be sufficient for self-organized small-world graphs in general [7]. Maslov et al. also claimed that they found a similar disassortative pattern in the yeast PIN [10], but as we discussed before, many recent studies showed no such disassortative correlation between node degrees in yeast for high-confidence interaction sets, and the opposite results discovered by Maslov et al. may be explained by a bias in the yeast–two hybrid system which might artificially increase negative degree correlations [26]. Molecular networks guide the biochemistry of a living cell on multiple levels: its metabolic and signaling pathways are shaped by the network of interacting proteins, whose production, in turn, is controlled by the genetic regulatory network, so it will be very interesting to study why these two tightly-related molecular networks have completely different topological structures. 3.3 Networks with Higher Complexity We studied a real pulp mill benchmark model developed by Castro and Doyle [31], which consists of modular representations of unit operations in a complete pulp mill. The benchmark can be used for studying several process-system tasks, including modeling, control, estimation and fault diagnosis [31]. In the pulp mill, the major units of operation are: a digester, pulp washers, oxygen tower, storage vessels, bleaching towers, evaporators, recovery boiler, smelt dissolving tank, clarifiers, slaker, causticizers and lime kiln [31]. There are also many valves, which are used to connect components in and between various key units. The system structure has big impacts on a series of test and control tasks in engineering systems. For example, the complexity of specific diagnosis algorithms only depends on the system topology [32, 17]. We analyzed physical connections between the fundamental components, and studied the corresponding topology of the whole pulp mill system. The degree distribution of the pulp mill follows a power law as well. However, as shown in Table 2 and Figure 1, the pulp mill is a non-small-world network, and even the 3K model highly deviates from the pulp mill and the corresponding characteristic path length can only reach about 64% of the real network. Although the router-level Internet and electronic circuits we analyzed are also highly-engineered complex systems under specific design principles, their elementary components and connection interfaces are relatively homogeneous. In digital circuits the components are only different types of basic logic gates, and in the router-level Internet the components are only routers with various speeds. Different types of logic gates in circuits and routers in the Internet can be easily connected with each other, respectively. But in the pulp mill, the components are diverse heterogeneous devices, and only specific types of devices, which are functionally related and have compatible interfaces, can be connected with each other. For an complex engineering system like the pulp mill, it is
Characterizing the Structural Complexity of Real-world Complex Networks
11
largely impossible to fit any nontrivial network structure while ignoring domainspecific constraints [3], and the random graph generators seems not suitable for capturing topologies of this kind of complex systems since the cost of the dKdistribution representation and resulting computational complexity will be too high for practical applications when d > 3.
4 Summary This article describes a consistent framework for distinguishing and measuring structural complexity of real-world complex networks. As shown in Figure 1, the experiments show that our approach can clearly distinguish the underlying structure of various real-world complex networks, and convincingly classify these networks from a new dimension. We can apply the approach to measure structural complexity of more realworld networks, and the measured results can provide useful guidance on synthetic benchmark model generation for various simulation tasks. As shown in this paper, for complex systems with relatively low structural complexity, we can generate realistic (high-fidelity) but “random” benchmark models [17] with computationally efficient and simple random graph generators. In contrast, random graph generators cannot feasibly synthesize complex systems classified into high-complexity levels, due to the corresponding high computational cost and small ensemble-size generated.
References 1. Boccaletti, S., Latora, V., Moreno, Y., Chavez, M., Hwang, D.U.: Complex networks : Structure and dynamics. Physics Reports 424(4-5) (2006) 175–308 2. Keller, E.F.: Revisiting ”scale-free” networks. Bioessays 27(10) (October 2005) 1060–1068 3. Li, L., Doyle, J.C., Willinger, W.: Towards a theory of scale-free graphs: Definition, properties, and implications. Internet Mathematics 2(4) (March 2006) 431–523 4. Bianconi, Ginestra : The entropy of randomized network ensembles. Europhysics Letters 81(2) (Jan 2008) 28005 5. Claussen, J.C.: Offdiagonal complexity: A computationally quick complexity measure for graphs and networks. Physica A: Statistical Mechanics and its Applications 375(1) (Feb 2007) 365–373 6. Kim, J., Wilhelm, T.: What is a complex graph? Physica A: Statistical Mechanics and its Applications 387(11) (Apr 2008) 2637–2652 7. Mahadevan, P., Krioukov, D.V., Fall, K.R., Vahdat, A.: Systematic topology analysis and generation using degree correlations. In: SIGCOMM. (2006) 135–146 8. Amaral, L.A., Scala, A., Barthelemy, M., Stanley, H.E.: Classes of small-world networks. Proc. Natl. Acad. Sci. USA 97(21) (October 2000) 11149–11152 9. Goh, K.I., Oh, E., Jeong, H., Kahng, B., Kim, D.: Classification of scale-free networks. Proc Natl Acad Sci U S A 99(20) (October 2002) 12583–12588 10. Maslov, S., Sneppen, K.: Specificity and stability in topology of protein networks. Science 296 (2002) 910–913
12
Jun Wang, Gregory Provan
11. Milo, R., Kashtan, N., Itzkovitz, S., Newman, M.E.J., Alon, U.: On the uniform generation of random graphs with prescribed degree sequences (May 2004) 12. Hansen, M.C., Yalcin, H., Hayes, J.P.: Unveiling the iscas-85 benchmarks: A case study in reverse engineering. IEEE Des. Test 16(3) (1999) 72–80 13. Kaiser, M., Hilgetag, C.C.: Spatial growth of real-world networks. Phys. Rev. E 69(3) (Mar 2004) 036103 14. Li, W., Cai, X.: Statistical analysis of airport network of china. Phys. Rev. E 69(4) (Apr 2004) 046106 15. He, Y., Chen, Z.J.J., Evans, A.C.C.: Small-world anatomical networks in the human brain revealed by cortical thickness from mri. Cereb Cortex (January 2007) 16. Hormozdiari, F., Berenbrink, P., Przulj, N., Sahinalp, S.C.C.: Not all scale-free networks are born equal: The role of the seed graph in ppi network evolution. PLoS Comput Biol 3(7) (July 2007) 17. Wang, J., Provan, G.M.: Generating application-specific benchmark models for complex systems. In: AAAI. (2008) 566–571 18. Wang, J., Provan, G.M.: Topological analysis of specific spatial complex networks. Advances in Complex Systems (in press) 19. Costa, L., Kaiser, M., Hilgetag, C.: Predicting the connectivity of primate cortical networks from topological and spatial node properties. BMC Systems Biology 1 (March 2007) 16 20. Dambre, J.: Prediction of interconnect properties for digital circuit design and technology exploration. Ph.D. dissertation: Ghent University, Faculty of Engineering (2003) 21. Kaiser, M.: Brain architecture: a design for natural computation. Philosophical Transactions of the Royal Society A 365 (2007) 3033–3045 22. Barthlemy, M.: Crossover from scale-free to spatial networks. Europhysics Letters 63 (2003) 915–921 23. Przulj, N., Higham, D.J.: Modelling protein-protein interaction networks via a stickiness index. J R Soc Interface 3(10) (October 2006) 711–716 24. Chung, F., Lu, L.: The average distances in a random graph with given expected degrees. Internet Math. 1 (2003) 91C113 25. Ivanic, J., Wallqvist, A., Reifman, J.: Probing the extent of randomness in protein interaction networks. PLoS Comput Biol 4(7) (July 2008) e1000114+ 26. Friedel, C.C., Zimmer, R.: Influence of degree correlations on network structure and stability in protein-protein interaction networks. BMC Bioinformatics 8 (August 2007) 297+ 27. Przulj, N., Corneil, D.G., Jurisica, I.: Modeling interactome: scale-free or geometric? Bioinformatics 20(18) (2004) 3508–3515 28. Higham, D.J.J., Rasajski, M., Przulj, N.: Fitting a geometric graph to a proteinprotein interaction network. Bioinformatics (March 2008) 29. Serrano, A.M., Krioukov, D., Boguna, M.: Self-similarity of complex networks and hidden metric spaces. Physical Review Letters 100 (2008) 078701 30. Ma, H., Kumar, B., Ditges, U., Gunzer, F., Buer, J., Zeng, A.P.: An extended transcriptional regulatory network of escherichia coli and analysis of its hierarchical structure and network motifs. Nucleic acids research 32 (2004) 6643 31. Castro, J.J., III, F.J.D.: A pulp mill benchmark problem for control: Problem description. J. Proc. Cont. 14 (2004) 17–29 32. Provan, G.M., Wang, J.: Automated benchmark model generators for model-based diagnostic inference. In: IJCAI. (2007) 513–518