IEEE COMMUNICATIONS LETTERS, VOL. 11, NO. 1, JANUARY 2007
37
Characterizing Wireless Networks by Spatial Correlations Janne Riihij¨arvi, Student Member, IEEE, Petri M¨ah¨onen, Senior Member, IEEE, and Michael R¨ubsamen
Abstract— We show that n-point correlation functions are powerful tools to characterize the structure of wireless networks. We argue that they convey the most interesting correlation structures in node locations, while being significantly easier and faster to compute than the classical correlation functions of stochastic geometry. As a case study we analyze the spatial structure of the WLAN access point locations in the east and west coasts of the USA. It is found that measured access point locations feature power-law or scale-free behavior in their correlation structures. Node location models commonly used in simulations and analytical calculations are also studied, and found to be unrealistic in this regard. Index Terms— Interference, correlation functions.
location
correlations,
pair-
I. I NTRODUCTION PATIAL structure of wireless networks is still rather poorly understood subject. During the last decade our understanding of the topological structure of the Internet has increased tremendously (see, for example, [1], [2] for recent reviews). However, this very interesting work has primarily targeted only fixed networks, while much less attention has been placed on the study of the structure of wireless networks. Naturally, similar graph-based or relational techniques are applicable to both, but whereas for fixed networks the relational topology is arguably a fundamental property, in the wireless case it is purely a derived quantity, dependent on the spatial structure of the network. The purpose of this letter is to present a foundation for “first-principles” characterization of spatial structure of wireless networks in the form of spatial n-point correlation functions. From the precedent set forth by the graph-based approach mentioned above, we can expect two types of benefits from establishing a basic theory of spatial network structure. First major application is development of more realistic simulation environments. For the networking research community at large, simulators are the most often used tool for performance evaluation. However, as has been pointed out by several authors (see, for example, [3], [4]) the node location and mobility models offered by present-day simulation environments are not realistic. For mobility models there has been some work done towards both basic theory of motion, and for characterizing real-world mobility [5], [6], [7]. Much more limited effort has been directed towards characterizing node locations themselves in quantitative manner. To the best of our knowledge, this letter reports first major step into this direction. In particular, the examples presented here are first
S
Manuscript received June 30, 2006. The associate editor coordinating the review of this letter and approving it for publication was S. Kim. The authors are with the Department of Wireless Networks, RWTH Aachen University, Aachen, Germany (email:
[email protected]). Digital Object Identifier 10.1109/LCOMM.2007.061015.
ever detailed characterizations of spatial structure of real largescale wireless networks. This work also has impact on theoretical analysis and modeling of communication networks. The usually chosen “null hypothesis” of node locations being sampled from binomial or (stationary) Poisson point process is convenient, but unfortunately rather unrealistic. The interesting research problem is to come up with improved models that are still usable for analytical calculations. The rest of this letter is organized as follows. In Section II we describe briefly how node locations can be interpreted as a realization of a point process. We also review the basic spatial statistics for characterizing point processes before discussing practically computable node location correlations in more detail in Section III. We present a case study in Section IV, characterizing the access point locations in the east and west coasts of the USA, before concluding the letter in section V. II. N ODE L OCATIONS AS P OINT P ROCESSES As is usual in wireless networking research, we shall adopt the probabilistic viewpoint on studying node locations. We assume that the observed locations are realization of some unknown point process, the properties of which we try to estimate by statistical means. We shall begin by giving a very brief overview of the theory of point processes, before discussing their statistical description in more detail. We shall mostly be following the excellent monograph of Karr [8]. A point process N on a region A is a random counting measure, that is, it assigns a random natural number N (Ai ) to any suitably regular subset Ai of A. Naturally, N can be thought of a random distribution of indistinguishable points in A, and N (Ai ) as thePnumber of points lying in Ai . We can always write N = i εXi , where εx is the point mass at x (the measure equivalent to Dirac delta distribution), and Xi is an A-valued random variable. In simulations binomial point processes are typically used, obtained by superimposing N (A) uniformly distributed random points in A, or Poisson point processes, which are obtained from binomial ones by letting N (A) be a random variable with Poisson distribution with mean (regular, diffuse) measure µ(A). The structure of N can be characterized in terms of other spatial measures derived from N . Most important examples are given by void probabilities zN (A) := P {N (A) = 0}, and mean measure µN (A) := E{N (A)}. Putting N k (dx1 , . . . , dxk ) := N (dx1 ) · · · N (dxk ), we can also define the moment measures µkN := E{N k } and covariance measure by ρN (A1 × A2 ) = µ2N (A1 × A2 ) − µN (A1 )µN (A2 ). These are the analogies of moments and covariances of random variables to point processes. For for Poisson point ¡ example, ¢ process we have zN (A) = exp −µ(A) , µN (A) = µ(A) and ρN (A1 × A2 ) = µ(A1 ∩ A2 ), as expected.
c 2007 IEEE 1089-7798/07$20.00 °
38
IEEE COMMUNICATIONS LETTERS, VOL. 11, NO. 1, JANUARY 2007
While we have found the above statistics practical tools for theoretical work, node location correlations appear to be more expressive, and not much more complicated to define. Fundamentally, correlations are characterized by the remainder of a point process, which would naively have in region Γ the form ¯ ½ ¾ X ¯ ¯ Q((x1 , . . . , xk ), Γ) = P N − εxi ∈ Γ ¯ N ({xi }) = 1
-113°
-80°
i
if the locations of xi are known. The problem with this formula is, of course, that the corresponding measures being diffuse, the probabilities used in conditioning are typically zero. Thus either a more refined approach is necessary, or we have to modify the problem statement slightly. The first choice leads to the theory of Palm distributions, which give rigorous meaning for Q. We, however, choose the second path, and instead of obtaining absolute location correlations seek to find correlations in relative distances, which leads into definition and use of n-point correlation functions. Reason for this is that in our context, there does not exist any fixed “background” spatial field relative to which we could even study absolute correlations.
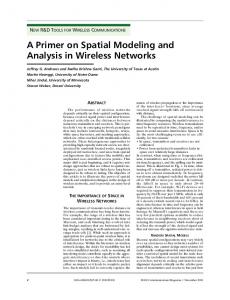
Fig. 1.
The data set of access point locations used in the case study.
as DD(r) =
Suppose the nodes in question have overall (area) density ρ0 . Then the pair-correlation function ξ(r) measures the excess probability of finding a neighboring node at distance r from a given node. We can capture this definition in terms of probability density ¡ ¢ dP = ρ20 1 + ξ(r) dA1 dA2 of finding one node in each of the area elements dAi . Similar definition can be given for cross-correlation function ξab (r), which measures the symmetric excess probability of finding a node of class a at a distance r from a node of class b, that is,
[x 6= y]Φr (x, y)/(n(n − 1)),
(1)
Φr (x, y)/(nm),
(2)
[x 6= y]Φr (x, y)/(m(m − 1)),
(3)
x∈D y∈D
DR(r) = III. n- POINT C ORRELATION F UNCTIONS
XX XX
x∈D y∈R
RR(r) =
XX
x∈R y∈R
where the Iverson bracket [P ] equals one if P is true, and is zero otherwise, and Φr (x, y) := [r ≤ d(x, y) ≤ r + ∆] is the pair-counting function [10]. Several estimators to ξ(r) can now be written down: ξˆ1 = DD/RR − 1, ξˆ2 = DD/DR − 1, ξˆ3 = DD RR/DR2 − 1,
(4)
ξˆ4 = (DD − 2DR + RR)/RR.
(7)
(5) (6)
¢ ¡ dP = ρn0 1 + ξ (n) (r1,2 , r1,3 , . . . , rn−1,n ) dA1 · · · dAn ,
These are typically called the Peebles and Hauser (or, simply, natural), Davis and Peebles, Hamilton, and Landy and Szalay (LS) estimators, respectively. By generalising the definitions of DD(r), DR(r) and RR(r) into triplets, quadruplets, and so on, we can write down similar estimators for higher-order correlation functions as well. For example, for reduced threepoint correlations (with contributions from ξ(r) removed) we have the Jing & B¨orner estimator
where ri,j denotes the distance from node i to node j. We shall now tackle the problem of estimating ξ (n) from a collection of observed node locations, following the long line of solutions developed by the astrophysics community [9]. Given a catalogue of n points, we proceed in Monte Carlo fashion and generate a random point distribution R of m À n locations by drawing them from a binomial point process (which does not exhibit correlations in the large m limit). In the pair-correlation case we then denote by DD the number of distinct pairs from the catalogue in a given range r, by DR the number of “cross pairs” in the same range multiplied by n/2m, and by RR the number of pairs from the random catalogue. These can be written formally in normalized form
27RRR2 · DDD 9RRR · DDR ξˆ(3) = − + 2. (8) DRR3 DRR2 In the large n, large area limit all of the estimators share the same asymptotic behavior of converging to the correct ξ(r). Nevertheless, they exhibit considerable performance differences in smaller samples, and care should accordingly be applied. In our case study below, we simply used all of the estimators, and checked carefully that all of those give equivalent results in the distance ranges of interest. In addition to these pairwise estimators, several geometric estimators have been proposed. As especially Hamilton and LS estimators have been found very robust in widely varying circumstances, we shall not present these additional estimators here.
¡
¢
dP = ρa ρb 1 + ξab (r) dA1 dA2 . These definitions can, of course, be extended in straightforward manner to the case of n-point correlations by
¨ RIIHIJARVI et al.: CHARACTERIZING WIRELESS NETWORKS BY SPATIAL CORRELATIONS
4
point processes) or exponentially decaying correlations (most common Neyman-Scott cluster processes, for example). We also conducted tests on other artificial location distributions, such as stationary distributions of various mobility models, but no power-law correlations were observed. There seems to be a fundamental difference in commonly used location models and measured data that certainly warrants further research. V. C ONCLUSIONS
10
10
ξ (r)
(2)
10
10 10 10
3
2
1
0
-1
10
1
10
2
3
10
10
4
5
10
6
10
r [m] Fig. 2. The pair correlation functions of the WLAN access point locations for the east (dashed line) and west coast (solid line) data sets.
10
39
From the above discussions it is obvious that binomial and Poisson point processes or the commonly used clustering processes do not have realistic spatial structure in terms of node location correlations. Accordingly, there is a clear need for devising more realistic point process models for simulation purposes as well as for analytical calculations. As an example, if one is interested in generating point distributions with given density and n-point correlation functions, model of Kerscher can be used [12]. Finally, study of the origins of the observed long-range correlations in Wireless LAN access point locations is an interesting topic for future work.
8
ACKNOWLEDGMENT 6
The authors would like to thank DFG and RWTH Aachen University for financial support.
(3)
ξ (r)
10 10
4
R EFERENCES
10 10 10
2
0
-2
10
1
10
2
3
10 10 r = r12 = r13 = r23 [m]
4
10
5
Fig. 3. The (reduced) three-point correlation functions of the WLAN access point locations for the east (dashed line) and west coast (solid line) data sets. The triplets considered in the estimator form equilateral triangles of length r.
IV. C ASE S TUDY Figure 1 shows the point distribution of approximately 106 measured Wireless LAN access point locations [11]. The estimators for pair and three-point correlation functions were applied into the data sets, and the corresponding estimates are shown in figures 2 and 3, respectively. As can be seen from the figures the correlation functions follow approximately a (broken) power law. Similar behavior was also observed in fourpoint correlations, more precise discussion of which is omitted for space reasons. These findings on correlation structures are highly interesting, as most commonly used synthetic location distributions have either vanishing (binomial and Poisson
[1] M. E. J. Newman, “The structure and function of complex networks,” SIAM Review, vol. 45, p. 167, 2003. [2] L. Li, D. Alderson, R. Tanaka, J. C. Doyle, and W. Willinger, “Towards a theory of scale-free graphs: definition, properties, and implications (extended version),” Oct 2005. [Online]. Available: http://arxiv.org/abs/cond-mat/0501169 [3] D. Kotz, C. Newport, R. S. Gray, J. Liu, Y. Yuan, and C. Elliott, “Experimental evaluation of wireless simulation assumptions,” in Proc. MSWiM ’04. New York: ACM Press, 2004, pp. 78–82. [4] M. Wellens, M. Petrova, J. Riihij¨arvi, and P. M¨ah¨onen, “Building a better wireless mousetrap: Need for more realism in simulations,” in Proc. WONS 2005, pp. 150–157. [5] T. Camp, J. Boleng, and V. Davies, “A survey of mobility models for ad hoc network research,” Wireless Commun. & Mobile Comp., vol. 2, no. 5, pp. 483–502, 2002. [6] F. Bai, N. Sadagopan, and A. Helmy, “The IMPORTANT framework for analyzing the impact of mobility on performance of routing for ad hoc networks,” AdHoc Networks J., vol. 1, no. 4, pp. 383–403, Nov. 2003. [7] F. Bai, N. Sadagopan, B. Krishnamachary, and A. Helmy, “Modeling path duration distributions in MANETs and their impact on routing performance,” IEEE J. Sel. Areas Commun., vol. 22, no. 7, pp. 1357– 1373, Sept. 2004. [8] A. F. Karr, Point Processes and Their Statistical Inference. Marcel Dekker, 1991. [9] J. A. Peacock, Cosmological Physics. Cambridge University Press, 1999. [10] M. Kerscher, I. I. Szapudi, and A. S. Szalay, “A comparison of estimators for the two-point correlation function,” Astrophysical J., vol. 535, no. 1, pp. L13–L16, May 2000. [11] WiGLE, http://www.wigle.net/ [12] M. Kerscher, “Constructing, characterizing, and simulating Gaussian and higher-order point distributions,” Physical Review E, vol. 64, no. 5, p. 56109, 2001.