Nov 17, 2018 - tify the in viva spectral absorption properties of 2 red tide dinoflagellates ... solution (dispersed thylakoid fragments = thylakoid micelles ... grating sphere with an internal and centrally located sample holder custom built for the DW-2000 by Lab- sphere, Inc. ...... istics of the pigment in question. For example ...
Vol. 114: 24%258,1994
MARINE ECOLOGY PROGRESS SERIES Mar. Ecol. Prog. Ser.
Published November 17
Chromoprotein- and pigment-dependent modeling of spectral light absorption in two dinoflagellates, P’orocenkzm mh&mzm and Heterocapsa pygmaea Geir Johnsen*, Norman B. Nelson, Raffael V. M. Jovine, Barbara B. Prezelin Department of Biological Sciences and The Marine Science Institute, University of California, Santa Barbara, California 93106, USA
ABSTRACT: Pigment- and chromoprotein-dependent spectral models, designed to accurately reconstruct whole cell absorption spectra for photosynthetic dinoflagellates, were assessed. Measured spectral absorption properties (400 to 700 nm) included signatures from whole cells, dispersed thylakoid fragments (unpacked absorption), isolated chromoproteins and individual pigments from high (500 limo1 mm2 s-l) and low (35 limo1 me2 s-l) light-adapted cells of the dinoflagellates Proroce&-um minimz~~2 and Heterocapsa pygmaea grown in continuous light at 15 ‘C. For model verification, we also developed a procedure to measure unpackaged cell absorption, free of solvent and light-scattering effects. Maximum measured chl a-specific absorption at 675 nm appears to be closer to 0.027 than a predicted value of 0.0203 m2 mg-’ chl a based on absorption from chl a in 90 % acetone. The percent fractional absorption of ‘jz2 vjvo’ weight-specific absorption coefficients of individual pigments relative to total weighted absorption (all pigments) was estimated to indicate the light-harvesting capabilities of the different pigments as a function of photoadaptive status and water color. Correspondingly, the weighted absorption of each pigment fraction has been estimated in theoretical white light and in ‘clearest’ green coastal and blue oceanic waters. Independent of water color, peridinin was by far the most important light-harvesting pigment, followed by chl c2 and chl a. The photoprotective diadinoxanthin absorbed most efficiently in the blue part of the visible spectrum. Results indicate that the chromoprotein model (1) overcame spectral distortions inherent in more general pigment-dependent models and, when combined with corrections for pigment packaging effects, (2) provided accurate spectral estimates of jn vjvo absorption coefficents and (3) worked equally well for dinoflagellate species with or without the major light-harvesting peridinin-chlorophyll-protein complex, PCP. Findings are discussed in the context of modeling of bio-optical characteristics in dinoflagellates, their photoecology and implications for the jn situ optical monitoring of red tides. KEY WORDS: Modeling of jn vjvo light absorption - Pigments Chromoproteins - Fractional absorption of pigments - Measured and modeled package effect - Photoadaptation Dinoflagellates l
l
INTRODUCTION Many dinoflagellate species form toxic and/or anoxic blooms (red tides) which have a negative impact on fisheries, water quality, tourism and human health (Smayda 1990). The global frequency of red tides *Present address: Trondhjem Biological Station, The Museum, University of Trondheim, Bynesveien 46, N-?018 Trondheim, Norway 0 Inter-Research 1994
Resale of full article not permitted
appears to be increasing and the rise may be related to increasing organic pollution of coastal waters, estuaries and wetlands (Bjergskov et al, 1990, Smayda 1990, Smayda 8~ White 1990). The characteristic brick-red color of most red tides is due to photosynthetic pigments, most notably the unique dinoflagellate carotenoid peridinin Information on the regional dynamics of red tides, including their distribution, abundance, photo-physiological state and possible rates of production, can be derived from knowledge of their in viva
246
Mar. Ecol. Prog. Ser. 114: 245-258, 1994
light absorption properties (Prezelin 1987). In the case of bio-optical in situ measurements (e.g. moorings) or remote sensing, one also needs to consider the optical properties of the water itself, dissolved colored matter, detritus and phytoplankton (Kirk 1992, Johnsen et al. 1994). The main goal of the present study was to quantify the in viva spectral absorption properties of 2 red tide dinoflagellates and to determine the relationship between their whole cell optical properties and their pigment and chromoprotein (pigment-protein complexes) composition. With such knowledge, predictive bio-optical algorithms for natural red tides might be developed successfully, Chlorophyll a (chl a)-specific in viva absorption is an important parameter for calculation of the total amount of light absorbed and utilized by phytoplankton. However, there are methodological problems regarding direct measurements of in viva absorption, caused by particle scattering and absorption by detritus, One way to avoid this problem, and thus making laboratory approaches workable in field situations, is to reconstruct in viva absorption on the basis of pigment and chromoprotein composition (Bidigare et al. 1987, 1990, Nelson & Prezelin 1990). There is more than one approach to reconstruct phytoplankton absorption, and the accuracy of results depends on the approach chosen. One approach to modeling in viva lightabsorption characteristics is to reconstruct ‘in viva’ weight-specific absorption coefficients (400 to ?OO nm) of the different major pigments on the basis of in vitro spectra in organic solvents (Bidigare et al. 198?, 1989, 1990). Such spectra are scaled by using their respective weight-specific absorption coefficients in a given organic solvent. The problem is that organic solvents cause spectral shifts relative to the corresponding in viva characteristics where the pigments are embedded in proteins (chromoproteins). To correct for this difference, the in vitro absorption spectra have been empirically spectrally shifted to mimic corresponding in viva absorption peaks (Bidigare et al. 198?). An alternate approach is based on ‘in viva’ weight-specific absorption coefficients (400 to 700 nm) of isolated chromoproteins (Nelson & Prezelin 1990). The spectral absorption coefficients of the chromoproteins differ from the pigment-based coefficients, because the protein attachments to the pigments alter both absorption peaks and shoulders as well as the absorption coefficients. We present here 2 models based on ‘in v.vo’ absorption coefficients of pigments and chromoproteins which can discriminate between photosynthetic and photoprotective pigments. This exercise is important for the evaluation of different approaches one might choose to estimate total light absorption and light utilization for photosynthesis (Bidigare et al. 1992), identification of phytoplankton-class specific optical characteristics
(Johnsen et al. 1994), and modeling the impact on underwater light fields by red tide dinoflagellates (Kirk 1992). Lastly, the predictive accuracy of the above approaches would be lost if no account of pigment packaging was considered. The package effect refers to the reduction of the light absorption of a suspension of pigmented particles (e.g. living phytoplankton cells) relative to that of the same amount of pigments in solution (dispersed thylakoid fragments = thylakoid micelles = ‘unpacked absorption’; Kirk 1983). To model this effect, possibly common in highly concentrated populations (bloom conditions), measurements of unpacked absorption are first necessary for quantitative comparison of the fractional absorption of the different light-harvesting components, Estimates of unpacked absorption have been made earlier by measuring absorption in suspensions of disrupted cells by the use of ultrasonication or passage of cells through an X-press pressure cell (Kirk 1983, Geider & Osborne 198?), by detergent solubilization (Berner et al. 1989, Sosik & Mitchell 1991), or by theoretical calculations based on in viva absorption and cell dimensions (Morel & Bricaud 1981, Sathyendranath et al. 1987). In the present study we introduce a new and apparently improved method for measuring unpacked absorption, free of particle-scattering and solvent-induced spectral shifts.
MATERIAL AND METHODS Culture conditions. The Provasoli-Guillard Center for Culture of Marine Phytoplankton (CCMP) provided a culture of Prorocentrum minim urn (Pavillard) , Schiller strain CCMP 1329 (‘EXUV’). Heterocapsa pygmaea (Loeblich et al. 1981) was originally obtained from a subculture in the collection at Scripps Institution of Oceanography (SIO code PY-33, a.k.a. Glenodinium sp., L. Provasoli, M. Bernard strain) and maintained in culture at the University of California, Santa Barbara (UCSB code 5M29). A subculture of UCSB code 5M29 has been relocated to the CCMP, where it is designated CCMP1322. Culture conditions were similar to those used by Johnsen & Sakshaug (1993). Cells were grown in Fernbath flasks containing 2.0 1 of seawater with F/2 enrichment (Guillard & Ryther 1962) and incubated at 15 OC, Continuous ‘white’ light was provided by a rack of 12 Philips F5 T8/Cool White fluorescent t u b e s (15 W). Once a day, cells were gently mixed. Scalar irradiances (&, 400 to 700 nm, PAR) were 35 umol mm2 s-l (low light, LL) and 500 umol rns2 s-l (high light, HL). Experimental measurements were made with exponentially growing cultures that had been adapted
Johnsen et al.: Two models for spectral light absorption in dinoflagellates
for several generations by serial dilution with fresh media. Pigments. Pigments were extracted in acetone (Johnsen & Sakshaug 1993), and chl a concentration was estimated using the chromophyte equation of Jeffrey & Humphrey (19?5) for quantification of chl a in 90% acetone, Optical density was recorded on a DW2000 (SLM-Aminco Inc., Urbana, IL, USA) spectrophotometer operated in the split-beam mode. The pigment composition (including chl a) of whole cells was quantified by high performance liquid chromatography (HPLC) according to Johnsen & Sakshaug (1993). Refiltered pigment extracts were injected into a Merck & Hitachi L-6200 HPLC pump equipped with a SPHERI RP-18 column (Brownlee Labs). Detection was performed in a Hitachi U-2000 spectrophotometer (all pigments) and a Hitachi F-3000 spectrofluorometer (chlorophylls only). In vitro absorption spectra (350 to 800 nm) of major pigments (chl a, chl c2, peridinin and diadinoxanthin) were measured by the HPLC stopflow technique (Johnsen et al. 1992) using a Hitachi U-2000 spectrophotometer. Published extinction coefficients of the individual pigments were used for calibration of the HPLC column. In viva absorption, corrected for scattering. Absolute absorption coefficients (see Table 1 for symbols) of whole cell suspensions were determined using the DW-2000 spectrophotometer equipped with an integrating sphere with an internal and centrally located sample holder custom built for the DW-2000 by Labsphere, Inc. The integrating sphere neutralizes wavelength-dependent scattering which causes errors with conventional methodology. Calibration and performance properties of the sphere have been detailed elsewhere (Nelson & Prezelin 1993). When using the sphere, the spectrophotometer was operated in the dual wavelength mode with a reference wavelength of 750 nm. Measured optical densities were corrected for absorption amplification and converted to chl aspecific absorption coefficients, a*r&, following procedures described in Nelson & Prezelin (1993). Measured unpacked absorption. We devised an approach which disrupted thylakoid membranes in a sucrose buffer into stable micelles. The micelles contained all cellular chromoproteins and were devoid of cell debris. To avoid chromoprotein degradation, all sample handling was done in dim light at 0 to 4 ‘C, Cells were harvested by 10 min centrifugation in a Sorvall Superspeed RC2-B refrigerated centrifuge at 13 500 x g. The pellet was quick frozen in liquid nitrogen for 3 min and stored at -?O ‘C. Frozen pellets were thawed in HEPES buffer (50 mM HEPES pH 8, 200 mM sucrose, 250 mM NaCl, 14 mM MgC12) and disrupted by 3 passes through a French press at 8.3 x 10⁷ Pa. Cell breakage of >99 % was confirmed micro-
247
scopically, The recovered slurry was loaded onto an 80 % sucrose cushion and centrifuged at 12 000 x g for 20 min. Cell debris was found as a pellet in the sucrose cushion, while the supernatant contained > 95 % of the sample chl a, Gel electrophoresis, HPLC of extracted pigments, and fluorescence excitation techniques were used to confirm that the supernatant contained intact chromoproteins, no free pigments and that pigment ratios were identical to those for pigment extracts from whole cells (data not shown). No light scattering in the micelle preparation was detectable in the visible spectrum. We define the light absorption properties of these dispersed micelles as ‘unpacked’ absorption [a*m&), m2 mg-’ chl a; Table 11. Absorption spectra of the clear supernatant were measured in a 1 cm quartz cuvette using the SLM Aminco DW-2000 spectrophotometer operating in the splitbeam mode. Determination of spectral shifts due to solvent effects and variations in absorption coefficients was done by taking absorption spectra of these micelles before and after extraction in 90% acetone (400 to 700 nm).
Individual chromoproteins and their unpacked absorption coefficients. The chl a-specific absorption coefficients of isolated chromoproteins [a*&), m2 mg-’ chl a] of Prorocentrum minimum and Heterocapsa pygmaea, i.e. chl a-chl c2-peridinin-protein ( A C P ) , photosystem (PS) I, PS II and peridinin-chl a-protein (PCP) were isolated and quantified by the use of dodecyl maltoside solubilization of thylakoid membranes and sucrose gradient centrifugation (modified from Hiller et al, 1993, Iglesias-Prieto et al. 1993). Absorption measurements of these chromoproteins in HEPES buffer [a*&)] were made in quartz cuvettes using the DW2060 spectrophotometer in split-beam mode. The mean chl a-specific absorption coefficients for ACP, PCP and PS I (a*c, 6?3 to 680 nm) were used for scaling of the corresponding mean in viva weight-specific absorption coefficients for these chromoproteins used in the model (Figs. 1 & 2B). Since we only had small amount of PS II, no determination of [chl a] was made. We therefore assumed the a*c for PS II at 676 nm to be 0.020 m2 mg- ’ chl a (same value as chl a in 90 % acetone).
Individual pigments and their unpacked absorption coefficients. Absorption spectra of alcohol-extracted and purified chl c2, peridinin and diadinoxanthin were spectrally shifted to match the absorption peaks and shoulders observed in viva using the approach described by Bidigare et al, (1990). Then, the resulting pigment spectra were scaled to their respective weight-specific absorption coefficients to give in viva weight-specific absorption coefficient spectra of the individual pigments [a*&), m2 mg-‘; Table 2, Figs. 1 & 2A]. The in viva weight-specific absorption coefficients
248
Mar. Ecol. Prog. Ser. 114: 245-258, 1994
Table 1. Definitions of bio-optical nomenclature and references to their use in equations in the text Measured specific absorption coefficient of individual pigment (m2 mg-‘, 400 to 700 nm, PAR). Eq. (1) Measured specific absorption coefficient of individual chromoproteins (m2 mg-’ chl a, PAR). Eq. (1) Measured chl a-specific absorption coefficient of phytoplankton (= ~II viva, packed absorption; m2 mg-’ chl a, PAR). cf. Eq. (3) Absorption coefficient of phytoplankton (m-l, PAR). Eq. (1) Reconstructed absorption coefficient of phytoplankton (m-l, PAR). Eq. (1) Measured unpacked absorption coefficient (micelles of dispersed thylakoid fragments; m2 rng-l chl a, PAR). Eq. (5) Modeled unpacked [a*&)] and packed [a*&)] absorption based on the pigment model (p). (m2 rng-l chl a, PAR). Eqs. (1 to 6)
-* aX
s*AF
AFj(L) o’(V
Q&J Q*&~
Modeled unpacked [a*&)] and packed [a*&)] absorption based on the chromoprotein model (c). (m2 mg-’ chl a, PAR). Eqs. (1 to 6) Spectrally weighted (400 to ?OO nm) chl a-specific absorption of phytoplankton (m2 mg-’ chl a): x denotes measured unpacked (ZI*mU) and packed (= jn vjvo, a>h) absorption. Modeled packed (p) and unpacked (u) absorption; pigment-model (a>U, ?I>~) and chromoprotein model (ZjcU, a*& Eq. (?) Spectrally weighted fractional absorption of individual pigments (m2 mg-’ pigment, PAR). Eqs. (2 & 7) Fractional absorption of individual pigment j (m2 mg-‘, PAR). Eq. (2) Absorption index (dimensionless). Eqs. (4 & 5)
cj
Cell absorption efficiency factor (dimensionless). Eqs. (3 to 6) Specific absorption efficiency (= package effect), dimensionless. Eq. (6) Concentration of pigment j (mg mm3). Eq. (1)
cchla
Concentration of cellular chl a (mg mV3). Eq. (5)
d
Cell diameter (spherical equivalent, urn). Eq. (5)
G
Geometrical cross-section of spherical cells (m2). Eq. (3)
for chl a (Bidigare et al. 1990) were originally based on measurement in 100 % acetone (blue:red ratio of 1.30, absorption at 675 nm = 0 . 0 2 0 m2 rng-l chl a). T h e absorption coefficients of chl EI (400 to ?OO nm) were therefore multiplied by 1.33 in order to simulate the
maximum value for measured unpacked absorption at 6?5 nm, i.e. 0.027 m2 mg-’ chl a, based on the values from measured unpacked absorption coefficients of dispersed thylakoid micelles and isolated chromoproteins (Figs. 2 8~ 3).
c&mg mm3), d (pm), pigments (HPLC, pg l-j) Pigment model
Chromoproteinmodel
y Eqs. 1-6
Fractionalabsorption
Input models
7
I
Eqs. I-6
Fractionalabsorption
I
Absorption coefficients Reconstruction algorithms for unpacked and packed absorption
Absorption models
Output models Measured absorption
Measured absorption characteristics for verification of models and methods
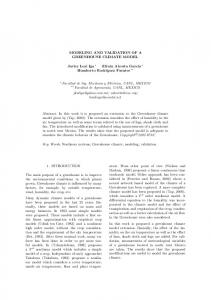
Fig. 1. Flow chart of the different methods and models for examination of unpacked and packed absorption characteristics in high and low light-adapted cells of Proroce&rum mjnjmum and Heterocapsa pygmaea. Round- and square-cornered boxes are measured and modeled absorption, respectively (see ‘Material and methods’)
249
Johnsen et al.: Two models for spectral light absorption in dinoflagellates
To model unpacked light absorption of whole cells of Roroce&-urn minimum, the unpacked in vivo weight-specific absorption coefficients of individual pigments were used to reconstruct unpacked absorpt i o n s p e c t r a [a’&), m-l; Figs. 1 & 2A]. This is based on a*j(k) and their volumebased concentrations (c~, mg rnm3; cf. Bidigare et al. 198?, Nelson & Prezelin 1990 and Table 1):
Pigments 0.08.. - 0.06 b E
0
400
Chromoproteins A
Diadinoxanthin
500
600
700
400
500
600
700
WAVELENGTH (nm)
n
a n d a*r&) = $&)/chl a (m2 mg-’ chl a). Fractional absorption of pigments. Fractional unpacked absorption [AF”(L)] of the different in vivo weight-specific pigment absorption coefficients [a*@)] was scaled by multiplying the different pigment-specific absorption coefficients by the corresponding pigment i to chl a ratio (w:w) (Figs. 2A & 4): A,?“(k) = a*i (I,)
[pigment i] [chl a]
Fig. 2. (A) 1n vko weight-specific absorption coefficients of the main pigments (chl a, chl c2, peridinin and diadinoxanthin) in dinoflagellates. (B) Mean in vko weight-specific absorption coefficients of chromoproteins isolated from low light-adapted cells of Prorocek-um minimum (PS I, PS II, ACP) and Heterocapsa pygmaea (PCP). The coefficents for diadinoxanthin are also included in the chromoprotein model for biooptical modeling of high light-adapted cells (see ‘Material and methods’)
(21
The sum of fractional absorption spectra of individual pigments yields the absorption spectrum of reconstructed unpacked absorption spectra (Figs. 3 & 4; Eqs. 1 to 5). Chromoprotein modeling. The computation scheme for reconstruction of unpacked absorption spectra based on in vivo weight-specific absorption coefficients of different chromoproteins [ t~*~,Jk)] is similar as for the reconstruction of unpacked in vivo absorption spectra (Eq. 1) from individual pigments a*j(X), except that the component spectra are different [a*&); Table 11. In addition, a*Jk) for diadinoxanthin
is included to model the impact of this photoprotective carotenoid in HL-adapted cells. The chl a concentration of each chromoprotein (mg mm3) was used for scaling of the different coefficients. Diadinoxanthin in the ACP chromoprotein used in the model comprised 5 % of the total cellular pigment concentration per weight, When the cellular concentration of diadinoxanthin was higher than 5 % of total pigments, absorption by the excess diadinoxanthin was approximated by the a*@) diadinoxanthin from the pigment model. Modeling the package effect. To model the package effect in LL- and HL-adapted cells we used an algorithm developed for homogeneous spherical cells (Morel & Bricaud 1981, Geider & Osborne 198?, Nelson & Prezelin 1990) (Fig. 1). This algorithm is derived from the concept that the absorption coefficient [a&),
Table 2. Pigments and their respective wavelength shifts to mimic in vivo absorption spectra. The solvent for all pigments, except chl a (100 Oh acetone), was from the HPLC eluent (60:40 methanol: ethyl acetate, v:v). The pigment-specific extinction coefficients (E, at their respective absorption maxima) were used to estimate in vivo weight-specific absorption coefficients of chl a, chl c2, peridinin and diadinoxanthin (m2 mg- ‘) Pigments
Wavelength shifts (nm) hmax in vitro h shift in vivo
E (1 g-l cm-l)
Source for E
Chl aa
662 (acetone) 432
>550: + 14 550: +4 375: +28
134.0
Jeffrey & Haxo (1968)
Diadinoxanthin
4?5 (HPLC)
>375: + 15
250.0
Davies (1976)
‘Modified in vivo absorption spectrum of chl a from Bidigare et al. (1990), absorption is assumed 1.33 times higher from 400 to ?OO nm than originally reported (see ‘Material & methods’)
250
Mar. Ecol. Prog. Ser. 114: 245-258, 1994
0.07
m-l] of an algal suspension of identical cells is given by the product of the number of cells (N) in a given volume (V, mm3), the absorption efficiency factor [C&(X), dimensionless] and the geometric cross-section (G, m2; Table 1):
LL B Measured
0.06 0.05 0.04 0.03 0.02 0.01
A model of Q&) has been described by van der Hulst (195?) and Morel 8~ Bricaud (1981): 2eVp’(kI ewP’tkl - 1 c&(k) = l+- + 2 - - - - - (4) o’ (V V2 (A)
0 0.08 0.06
where Q&) is a function of the absorption index o’(L) (dimensionless; Morel & Bricaud 1981). The absorption index is the product of the cell diameter (cI, spherical equivalent, III) and aC&) which, in turn, is the product of the intracellular chl d concentration (c+Ch1a, mg me3 cell volume) and unpacked absorption a*mU(X) (m2 rng-$ Table 1):
cv E
0.08
I
F
E
HL
LL ChromoproteinModel
0.06
500
400
600
700 400
500
600
700
WAVELENGTH (nm) Fig. 3. I%orocentzwm zninj.zzwm Measured and modeled unpacked and packed absorption spectra of high light (HL)- and low light (LL)-adapted cells. (A) Measured packed absorption absorption [a*r&)] and unpacked absorption [ a*mu(A)] in HL-adapted cells. (B) Same as (A), but in LLadapted cells. (C) and (D) are modeled unpacked and packed absorption using the pigment model [a*r&), a*r&)] in HL- and LL-adapted cells, respectively. (E) and (F) are modeled unpacked and packed absorption using the chromoprotein model approach 1 and 2 [a*&), a*&)] in HL- and LL-adapted cells, respectively
0.08
The fractional reduction of absorption due to the package effect [Q*&) = s p e c i f i c absorption efficiency, dimensionless] is computed as (Morel 8~ Bricaud 1981):
Q*a (k) = ;
z
Packed (in vjvo) absorption spectra were computed as the product of modeled unpacked absorption and Q*&) (Eqs. 4 to 6). Spectrally weighted absorption. Spectrally weighted absorption (&, 400 to ?OO nm, m2 mg-I) of the different types of absorption spectra, &, ZI*r [termed a(X) in Eq. (?); Table 1] were calculated according to Morel et al. (198?):
0.06 0.04 0.02 0
3 400
500
600
700 400
500
600
700
WAVELENGTH (nm) Fig. 4. I+orocen&wn minimum, Fractional unpacked absorption (pigment model) of individual pigments and the effect of the photoprotective carotenoid diadinoxanthin in (A) high light- and (B) low light-adapted cells (cf. Eq. 2). 1: total pigments; 2: photosynthetic pigments (total pigments - diadinoxanthin); 3: chl a; 4: chl c2; 5: peridinin; 6: diadinoxanthin
For this computation, spectral irradiance for blue oceanic waters and green coastal waters at 20 m depth were taken from Johnsen et al. (1992). Theoretical white light (similar response from 400 to ?OO nm) was used for comparison of ‘weighted’ absorption between measured unpacked and packed (= in viva) and modeled unpacked and packed absorption using the pigmentand chromoprotein models.
251
Johnsen et al.: Two models for spectral light absorption in dinoflagellates
Table 3. I+oroce&-um III~WKNUZI and IYeterocapsa pygmaea. Comparison of pigment composition in low light (LL)- and high light (HL)-adapted cells. p-carotene was not included since it contributed ~0.3 % (CV & 60 %, n = 12) of total pigments in both species. Pigment concentration is scaled to chl a (mg pigment mg -’ chl a) and per cell (pg pigment cell-‘) Pigment
Prorocen trum minimum High light Low light Chl a Cell Chl a Cell
Heterocapsa pygmaea High light Low light Chl a Cell Chl a Cell
Chl a Chl c2 Peridinina Diadinoxanthinb Total
1.00 0.38 0.96 0.44 2.78
1.00 0.53 1.44 0.32 3.29
C h l c2:t o t a l Peridinin : total Diadinoxanthin : total
0.14 0.34 0.16
0.94 0.36 0.90 0.41 2.61
1.00 0.58 I.17 0.16 2.91
1.46 0.85 I.71 0.23 4.25
0.21 0.40 0.05
1.00 0.53 1.44 0.32 3.29
1.00 1.04 2.49 0.29 4.82
0.16 0.44 0.10
2.83 2.94 ?.05 0.82 13.6
0.22 0.55 0.06
‘Peridinin + cis peridinin; ‘diadinoxanthin + diatoxanthin (see text)
RESULTS Pigments The pigment composition of HL- and LL-adapted Heterocapsa pygmaea and Prorocen trum minimum were roughly similar, but with notable differences (Table 3) (Johnsen & Sakshaug 1993). The amount of chl a per cell was similar in HL-adapted cells of both species (0.9 to 1.0 pg chl a celll). Correspondingly, LL-adapted cells of P, minimum and H. pygmaea contained 1.5 and 2.8 pg chl a cell-‘, respectively. The most dramatic difference between the species was the amount of peridinin per cell. The difference was most dramatic in LL-adapted cells of P, minimum and H. pygmaea, i.e. l.? and 7.1 pg peridinin cell-‘, respectively (Table 3). While both species contained typical dinoflagellate pigmentation, it was evident that LL-adapted cells of Heterocapsa pygmaea were more highly pigmented
Fig. 5. Prorocen trum minimum. High light (HL)- and low light (LL)-adapted cells. Measured unpacked absorption (A) of dispersed thylakoid fragments in HEPES buffer and its absorption characteristics in 90 % acetone (B). The difference spectra (A-B) show spectral shifts (numbers given in nm) and differences in absorption coefficients
400
450
500
550
and invested a greater fraction of their total pigmentation in light-harvesting chl c2 and peridinin-containing components than did Pro.roceMz-um ~~&z~rn cells. For instance, in LL-adapted cells, the chl a content, as well as chl c2:chl a and peridinin:chl a ratios, were twice as high in H, pygmaea compared to P minimum. In contrast, HL-adapted cells of P minimum contained 60 % more diadinoxanthin relative to total pigments than HL-grown H, pygmaea. Diadinoxanthin made up only 5 to 6 % of total pigments in LL-adapted cells of both species, a value typical for other LL-grown dinoflagellates (Johnsen & Sakshaug 1993 and references therein).
In vho absorption The peaks and shoulders of the in vivo chl aspecific absorption [ a*&k)] spectra of Prorocen trum minimum and Heterocapsa pygmaea were located at
600
650
700
400
450
WAVELENGTH (nm)
500
550
600
650
700
252
Mar. Ecol. Prog. Ser. 114: 245-258, 1994
100
90 g
a
;i
60
?a 3
40 50
0
30
8
20 10 0
W
B
G
W
B
G
CHL a CHL CQ
0.08 0.06
I
W
B
G
W
PERIDININ
B
G
W
G
W
B
G
DIA TOTAL-DIA T O T A L
A
HL
B
LL Measured
Measured
B
0.04 0.02 0
m
0.08
HL Modeled approach 3
0 0.06 v
Ti
C
LL Modeled approach 3
D
a*cu
0J 0.04 E
Measured unpacked absorption
: HL Modeled approach 2
0.08
0.04 0.02
415 to 420 nm (chl a), 440 nm (chl a, peridinin, diadinoxanthin), 460 nm (chl c2, peridinin, diadinoxanthin), 490 nm (diadinoxanthin, peridinin), 540 nm (peridinin), 590 nm (chl c2, chl a), 625 nm (chl a, chl c2), 635 nm (chl c2, chl a) and 6?5 nm (chl a) (Figs. 2 to ?). In P. m i n i m u m a n d H, p y g m a e a a*ph ( 6 7 5 n m ) w a s 0 . 0 2 8 a n d 0.02? in HLadapted cells, compared to 0.021 and 0.023 m2 mg-’ chl a in LL-adapted cells, respectively (Figs. 3 & ?).
a*cp
0.02
0.06
Fig. 6. Prorocentrum minimum. High light- (light colored bars) and low light- (dark colored bars) adapted cells. (A) % fractional unpacked absorption of individual pigments of total absorption in theoretical white light (W), clearest blue oceanic (B) and green coastal waters (G) at 20 m depth (spectral irradiances given in Johnsen et al. 1992). (B) Weighted absorption of unpacked individual pigments in white, blue and green waters. For further explanation see Eq. (2). DIA: diadinoxanthin; TOTAL-DIA: total pigments minus diadinoxanthin
E
I1
0 400
a*cu
a*cu
a*cp
a*cp
500
600
700
400
500
600
700
WAVELENGTH (nm)
Fig. 7. Heterocapsa pygmaea. Measured and modeled unpacked and packed absorption spectra of high light (HL)- and low light (LL)-adapted cells. (A) Measured packed absorption [a*&k)] and unpacked absorption [ a*mU(k)] in HL-adapted cells. (B) Same as (A), but in LL-adapted cells. (C) and (D) is modeled absorption using the chromoprotein model [a*&)1 a*crl (X)] approach 3 in HL- and LL-adapted cells. (E) and (F) is modeled absorption using the chromoprotein model approach 2 in HLand LL-adapted cells, respectively
The locations of peaks and shoulders given in a*mU (X) (measured unpacked absorption) in Prorocen trum minim urn and He terocapsa pygmaea were identical to the measured a*ph(k) (whole cells), it appears that our approach generated no artificial spectral shifts in a*mu. Correspondingly, comparison of a*mu(k) with a*ph(k) indicates that the package effect was less pronounced in HLadapted cells (10 % in P minimum and 3 % in H, pygmaea) than in LL-adapted cells of both species (24 % in P minimum and ? % in H. pygmaea) (Tables 4 & 5, Figs. 3 & 7). The biggest difference between a*mU(X) and a*ph (X) was found in spectral regions where all pigments absorb in both P minimum and H. pygmaea, i.e. 440 to 460 nm, indicating high pigment packaging.
Johnsen et al.: Two models for spectral light absorption in dinoflagellates
253
Table 4. I+orocen&um III~I&CN_IIII, Weighted absorption in theoretical white light (a*x, m2 mg A chl a, 400 to 700 nm) in low light (LL)- and high light (HL)-adapted cells from measured and modeled absorption spectra with and without package effect. Percent change (%) reduction of weighted absorption coefficient due to the package effect. Measured packed absorption from whole cells (Z*& is compared to the measured unpacked absorption spectra (dispersed thylakoid fragments, Z*mU). Modeled absorption coefficients from the pigment model are compared before (ZjpU ) and after application of the package effect algorithm (a*&. Weighted absorption coefficients from the chromoprotein model (?I*CU, Z*Cr,) are compared for 2 approaches representing varying amounts of chl a in the different chromoproteins (see ‘Results’) Low light
High light
Without packaging
With packaging
%
Without packaging
With packaging
%
-
0.0237
9.9
Measured a-* mu
-
0.0145
24
0.0190
-
-
Modeled a*pu, a*pp
0.0310
0.0204
34
0.0300
0.0250
17
0.0193 0.0215
0.0143 0.0157
26 27
0.0236 0.0258
0.0201 0.0218
15 16
a*ph
a cp; approach 1 a-* GUI -* a -* cut Zl*Cp; approach 2
0.0263
-
-
Pigment model
Fractional absorption of pigments
Unpacked absorption
The fractional absorption spectra of individual pigments (Eq. 2; Fig. 4) in HL- and LL-adapted cells of Roroce&-um minimum indicate how the pigment composition (photosynthetic and photoprotective) changes as a function of growth irradiance, Absorption at 400 to 500 nm in HL-adapted cells is due to almost equivalent absorption by chl a, chl c2, peridinin and diadinoxanthin in different wavelength bands. Peridinin is the main absorbing pigment from 500 to 600 nm, with some contribution from diadinoxanthin (500 to 520 nm), whereas chl c2 and chl a determine the absorption at 560 to 600 nm. In LL-adapted cells, chl c2 and peridinin are the major light-harvesting pigments at 450 to 560 nm. Chl a contributes significantly from
The reconstructed unpacked absorption spectra in HL- and LL-adapted cells of Prorocentrum minimum, i.e. i~2 viva weight-specific absorption coefficients (m2 mg-‘) for chl a, chl c2, peridinin and diadinoxanthin, yielded peaks and shoulders similar to those observed in a*mu(X) spectra (Figs. 1 to 3). In HLadapted cells of both species, a shoulder at a*&490 nm) was caused by absorption of the photoprotective carotenoid diadinoxanthin (Fig. 3). Correspondingly, the a*&) spectra for LL-adapted cells exhibited a shoulder at 500 to 560 nm caused by peridinin, which was not clearly seen in HL.
a*pu (X)
Table 5. Heterocapsa pygmaea. Weighted absorption in theoretical white light (a>, m2 mg --’ chl a, 400 to ?OO nm) in low light (LL)- and high light (HL)-adapted cells from measured and modeled absorption spectra with and without package effect. Percent change (%) reduction of weighted absorption coefficient due to the package effect. Measured packed absorption from whole cells (a>h) is compared to the measured unpacked absorption spectra (dispersed thylakoid fragments, a*mu)e Weighted absorption coefficients from the chromoprotein model (S*Cu, a*Cp) are compared for 2 approaches representing varying amounts of chl a in the different chromoproteins (see ‘Results’) Low light
High light
Without packaging
With packaging
%
Without packaging
With packaging
%
Measured z*ph
a-*mu
Modeled
a -*GUI iT*Cp; approach 2 a -*GUI i3jcp; approach 3
-
0.01?5
-
-
-
0.0227
0.0221
0.0189
7
-
-
0.0215 0.0211
0.0161 0.0160
25 24
0.0236 0.0232
0.0196 0.0212
17 9
3
254
Mar. Ecol. Prog. Ser. 114: 245-258, 1994
400 to 450 and 590 to 700 nm relative to the other pigments. Because the diadinoxanthin content in LLadapted cells was low, the effect on absorption of this pigment is minimal, The percent fractional absorption of individual pigments to total weighted absorption [AF”(k), Eqs. (2) & (?), Figs. 4 & 61 illustrates the light-harvesting capabilities of the different pigments. The AFi(k) values varied as a function of photoadaptive status and water color, Independent of water color, peridinin was by far the most important light-harvesting pigment (35 to ?O % of total absorbed light), followed by chl c2 (15 to 30 %) and chl a (5 to 25 %), Chl a itself is most efficient in absorbing the white light regime. In contrast, chl c2 and peridinin absorb most efficiently in blue and green light regimes, respectively (Fig. 6). AF&) of diadinoxanthin is similar to chl a in theoretical white light, but absorbs more efficiently than chl a in blue and green light. In fact, for HL-adapted cells diadinoxanthin absorbs up to ~30% of the total light absorbed (blue light), in contrast to only ~8 % in LL-adapted cells. Weighted absorption of each pigment fraction or total pigments under different spectral irradiances (s*r, Eq. ?; Fig. 4) yields information on the amount of light absorbed (m2 mg-‘) by each pigment and reveals which ones are the most effective under different spectral conditions and photoadaptional status (Fig. 6). Chl a has a low light-harvesting capacity in green coastal waters in contrast to peridinin, which is the major absorbing pigment both in white, green and blue light regimes.
Chromoprotein model Unpacked absorption The pigment composition of the main light-harvesting complex, ACP, is dominated by chl a, chl c2, peridinin and diadinoxanthin. Photosystems I and II (PS I, PS II) are both dominated by chl a, and PCP contains chl a and peridinin (Hiller et al. 1993, Iglesias-Prieto et al. 1993). Three different approaches were used to quantify the possible distribution of total cellular chl a among the different photosynthetic chromoproteins [a*&)]. Approach 1 is based on measured averages of different chromoproteins in Prorocentrum minimum, i.e. ?2 % of the total chl a in ACP and 14 % in both photosystems (unpubl. data). Approach 2 employs a ‘mean value’ for chromoproteins isolated from R minimum and Heterocapsa pygmaea, i.e. 52 % of the total chl a in ACP, 20% in PCP and 14 % in each photosystem (unpubl, data), Approach 3 is based on the estimation of chl a in each chromoprotein complex according to Nelson & Prezelin (1990), i.e. ACP and PCP were
scaled using a molar ratio of 5:l for chl c2:a (Boczar et al. 1980) and 4:1 for peridinin:chl a (Koka & Song 19?7). The chl a content in PS I and II, assumed to be equally distributed in the 2 systems, was estimated by subtracting the chl a content in PCP and ACP from total chl a, For modeling approaches 1 to 3, the diadinoxanthin content in ACP is -5 % of total pigmentation by weight. This was the mean % of diadinoxanthin content to total pigments in this survey and in 3 species of LL-adapted dinoflagellates reported by Johnsen & Sakshaug (1993). The findings of 10 % diadinoxanthin to total pigments in H. pygmaea are in agreement with reported values of up to 16 % diadinoxanthin of total pigments in HL-adapted dinoflagellates (Johnsen & Sakshaug 1993). This implies that a*j(L) for diadinoxanthin is included in the chromoprctein model only if the diadinoxanthin content is higher than 5 % of total pigments (by weight). There is a good agreement between measured unpacked absorption [ a*mU (IL)] and modeled unpacked absorption using a*&). However, the use of different chl a contents in the different chromoproteins [a*&)] scaled to total chl a (approaches 1, 2 or 3) alters the reconstructed absorption characteristics and thus the spectrally dependent values for weighted absorption (Figs. 3 & ?). By looking at weighted absorption ??*cu of Prorocenh-urn minimum in theoretical white light, approaches 1 and 2 overestimated absorption by 2 and 13 %, respectively, compared to a*mu in LL-adapted cells and gave an 11 and 2 %, respectively, underestimation in HLadapted cells (Table 4). The pigment model overestimated a>u relative to Z?*mu with 63 % in LL- and 14 % in HL-adapted cells. Similar results were also observed for Heterocapsa pygmaea. In this species, the difference between a*mu in LL- and HL-adapted cells was 20% compared to 38 % in R minimum. Comparison between a*cu approach 2 and 3 to a*mu in H. pygmaea in white light yielded results similar to those for R minimum (Tables 2 to 4, Figs. 3 & ?).
Modeling of in vivo (packed) absorption For Prorocentrum minimum, the modeling of in vivo (packed) absorption by the pigment- [a*pp(X)] and chromoprotein [a*&)] models was compared with measured in viva absorption [ a*ph(k); Table 41. a>i, overestimated d >h by 40% in LL- and 5% in HL-adapted cells. Correspondingly, a*ci, approach 1 yielded results similar to a\h in LL- and 15 % underestimation in HLadapted cells. In contrast, modeled white light weighted in viva absorption by Heterocapsa pygmaea, using the chromoprotein model approaches 2 and 3, underestimated Zr,h by 8 to 11% (Table 5).
Johnsen et al.: Two models for spectral light absorption in dinoflagellates
DISCUSSION Pigments The 30 to 40% higher amount of peridinin to total pigments in Heterocapsa pygmaea compared to promocentrum minimum at both growth irradiances reflects the presence of PCP in H. pygmaea and its absence in p, minimum (Table 3) Our study indicates that diadinoxanthin is the second most abundant carotenoid in dinoflagellates (Johansen et al. 19?4, Johnsen & Sakshaug 1993) as it is in most chromophytes (Rowan 1989). In low light, both species increased the cellular content of light-harvesting pigments relative to high-light adapted cells (Prezelin 1976, 1981, Demers et al. 1991, Sakshaug et al, 1991, Johnsen & Sakshaug 1993). These observations suggest that the abundance of photosynthetic chromoproteins, as well as the average optical cross-section for light absorption, was significantly greater in LL-adapted cells of Heterocqxa pygmaea than similarly cultured cells of Prorocentrum minimum. Interestingly, and perhaps photophysiologitally related, was the observation that HL induction of the photoprotective carotenoid diadinoxanthin was especially pronounced in p minimum cells, Thus similar changes in growth irradiance induced different responses in the 2 species. In white light, H. pygmaea cells appeared more sensitive to photoregulation of photosynthetic pigments, while p minimum cells were more sensitive to photoregulation of photoprotective carotenoids. These clear differences in photophysiological regulation of pigmentation made these 2 experimental organisms ideal for testing and developing models of red tide bio-optical properties. The high specific-absorption coefficients of chl c2 and diadinoxanthin relative to chl a and peridinin imply that the 2 former pigments will have a significant effect on the in viva absorption characteristics, even when they make up < 10 % of total pigments by weight (Figs. 2A & 6). Considering that the 2 dinoflagellates examined have up to 21 to 22 % of chl c2 and 10 to 16 % diadinoxanthin to total pigments (w:w) , we may conclude that these pigment are important in light harvesting and photoprotection, respectively (Table 3, Fig. 6).
255
teins or distortion of in viva spectral properties. We therefore avoided the use of denaturing detergents or organic solvents which may be suitable for some characterization studies of chromoproteins but which commonly lead to the release of free pigments and significant denaturation (Prezelin & Boczar 1986). The thylakoid fraction reported here represents a mixture of functional light-harvesting complexes and PS I and II (unpubl.) . The in viva weight-specific absorption coefficient of chl a at -675 nm is an important scaling factor for modeling of absorption characteristics in phytoplankton because only protein-bound chl a absorbs at this wavelength. Our data indicate that previous unpacked absorption values for chl d dissolved in 90% acetone have been underestimated at 675 nm. Maximum measured unpacked absorption at 6?5 nm [a*mU(6?5 nm)] is closer to 0.027 than a predicted value of 0.020 m2 mg-’ chl a based on chl a in 90% acetone used in previous models (Geider & Osborne 198?, Nelson & Prezelin 1990) (Figs. 2 & 3). A value of a*&X) of ~0,027 m2 mg-’ c h l a h a s b e e n r e p o r t e d i n Synechococcus spp. (cyanobacteria; Bidigare et al, 1989, G. Johnsen unpubl,), diatoms, prymnesiophytes and dinoflagellates (Morel & Bricaud 1981, Nelson & Prezelin 1990) indicating cells with low package effect [small o’ and high Q*&) values], When we scaled the in viva weight-specific absorption coefficient of chl a [ a*i(675 nm)] to 0.027 m2 mg-’ chl a, we found a closer agreement between reconstructed and measured absorption than when using an a*i(675 nm) of 0.020 m2 mg-’ chl d (Figs, 2 & 3). Values of a*mU(6?5 nm) seem to be little affected by growth-irradiance, but are different between the 2 species examined, indicating speciesspecific differences in the proteins attached to chl a. HL- and LL-adapted cells of Prorocentrum minimum had a*mU(6?5 nm) of 0.02? and 0.025 m2 mg-’ chl a, respectively, Correspondingly, HL- and LL-adapted cells of Heterocqxa pygmaea had a*mU(6?5 nm) of 0,021 m2 mg-’ chl a for both irradiances, In contrast, values of a*mU(400 to 550 nm) indicate a significant difference beween LL- and HL-adapted cells for both species (Figs. 2, 3 & ?).
Comparison of models Measured unpacked absorption Our method appears to provide good direct measurements of absolute unpacked absorption coefficients [a*mU(k)] for both Prorocentrum minimum and Heterocapsa pygmaea, The key was the release of intact chromoproteins [a*&)] from the cells while avoiding dissociation of pigments from the chromopro-
By extracting dispersed thylakoid fragments or chromoproteins in 90% acetone, spectral shifts and changes in spectral absorption coefficients occur, caused by breakage of the bonds between pigments and proteins, In addition, different types of organic solvents result in different spectral absorption characteristics of the pigment in question. For example the blue to red ratio of chl d is 1.15 and 1.30 in 90 and 100 %
256
Mar. Ecol. Prog. Ser. 114: 245-258, 1994
acetone, respectively (Rowan 1989, Johnsen & Sakshaug 1993). The reconstructed a*#) in the pigment model overestimated absorption in the blue and underestimated it in the red (Fig. 5). This is most probably caused by solvent effects and overlapping of absorption from all major pigments, especially in the blue part of the spectrum. Whole-cell pigment extracts in 90 % acetone in particular will cause a big overlap in absorption between chl a and c2 at the blue end of the spectrum. This is less pronounced in the reconstructed absorption spectrum of phytoplankton [a&-&)] because the different pigments have been spectrally shifted to mimic in vivo absorption spectra (Table 2). The advantage of the pigment model for reconstruction of in vivo absorption characteristics is that it can quite accurately determine the amount of photoprotective and photosynthetic pigments absorbing under different light regimes (Fig. 6), and requires only HPLC and cell dimension data as input. The modeled (unpacked) fractional absorption of individual pigments [AF(X)] illustrates the importance and plasticity of absorption characteristics and light utilization relative to changes in growth-light irradiance and color. AF@) is a useful tool to study how the absorption characteristics in a phytoplankton cell vary as a function of pigmentation and to see which pigments are important in light-harvesting and photoprotection under different spectral light regimes (cf. Prezelin 1987, Johnsen et al. 1992). This information can be used for a more precise prediction of primary productivity since we take into account the effect of photoprotective carotenoids, i.e. diadinoxanthin, by subtracting the contribution of the photoprotective carotenoid(s) from the rest of the light-harvesting pigments. Fractional absorption is also a useful tool to understand the dynamics between species-specific spectral characteristics for use in bio-optical taxonomy since the spectral signatures from the different pigments are known and can be modeled (Bidigare et al. 1990, Johnsen et al. 1994). The modeled unpacked absorption coefficients based on a*&) (absorption coefficients of individual chromoproteins) yield a closer agreement with measured unpacked absorption [CITY,&)] than spectra derived from the pigment model (Figs. 2, 3 & 7). The weighted absorption coefficients for reconstructed packed and unpacked absorption in Prorocentrwn minimum using the pigment model (Table 4) indicate -30 % (mean value for HL + LL) overestimation caused by the in vitro absorption coefficients. In contrast, the chromoprotein model approach 2 overestimated the measured unpacked and packed absorption coefficients by only -3 % (mean value for HL + LL; Table 4, Fig. 3). Approaches 2 and 3 yield similar results and are in accordance with measured values (Tables 4 & 5).
However, the contributions from diadinoxanthin at 490 nm and peridinin at 530 to 540 nm are slightly different in approaches 1 and 2 (Fig. 3). Chromoprotein model approach 3, which is based on constant molar ratios of ACP and PCP, also yielded reasonable values for weighted absorption compared to measured values (Table 5), whereas the spectral characteristics, due to a high amount of PCP relative to ACP, yield different spectral absorption characteristics compared to approaches 1 and 2 (Fig. 7). Thus the chromoprotein model approach 2 [(a*&), a*&)] yielded the absorption characteristics closest to measured absorption for both species [a*m&), a*&)lg The spectral characteristics of the PCP-lacking Prorocentrum minimum are mainly due to the ACP complex, in contrast to Heterocapsa pygmaea, which contains both ACP and PCP (Figs. 3 & 7) (Jovine et al. 1992, Iglesias-Prieto et al. 1993). Still, by using approach 2 for both species, good agreement between measured and modeled absorption characteristics was obtained. Since the main light-harvesting complexes (PCP and/or ACP) correspond to approximately ?O% of cellular chl a, only minor absorption contributions from PS I and II are evident in both species. By using these models, especially the chromoprotein model, we can model quite accurately in vivo absorption characteristics in dinoflagellates on the basis of weight-specific absorption coefficients of peridinincontaining dinoflagellates. The same approach can be used for other phytoplankton classes.
Package effect Variations in the package effect are mainly caused by differences in cell and chloroplast size/shape/morphology and in intracellular pigment concentration (van der Hulst 1957, Morel & Bricaud 1981, Kirk 1983, Geider & Osborne 1987, Nelson & Prezelin 1990, Sosik & Mitchell 1991, Johnsen & Sakshaug 1993). The models presented by us take into account most of these variables and can therefore discriminate between light absorption by photosynthetic and photoprotective pigments, thus making estimation of photosynthetically usable light possible. The values from measured unpacked a*mu (6?5 nm) and packed absorption (in vivo) ~1*~~(675 nm) are in agreement with 2 similarly grown HL-adapted strains of Prorocentrum minimum (strain EXUV and ?9A; Johnsen & Sakshaug 1993). They reported a Q*a(675 nm) value of 0.92 to 0.98 in HL-grown cells, based on the van der Hulst approximation (Eq. 4), which is close to the theoretical value for no packaging [Q*&) = 1.0; cf. Morel & Bricaud 19811. Measured chl a-specific absorption coefficients from HL-adapted cells of p minimum (cells with no
Johnsen et al.: Two models for spectral light absorption in dinoflagellates
significant package effect at 6?5 nm) were as follows: 0.028 m2 mg-’ chl a for a*i,h(6?5 nm) and 0.027 m2 mg-’ chl a for a*mU(6?5 nm), indicating close agreement. For HL-adapted Heferocqsa pygmaea, a*&6?5 nm) was 20% higher than a*mU (6?5 nm) and, correspondingly, 20 % lower at 440 nm. The reason for the high a*r,h(675 nm) is unknown since replicate measurements were in close agreement, indicating no methodological problems [a*p&): n = 3, CV = &l.O%; a*&X): n = 2, CV = &0.2%]. No degradation of chl a (or other pigments) was detected as checked by HPLC connected to absorption and fluorescence monitors (Johnsen & Sakshaug 1993). There is a significant rise from 400 to 480 nm in a*mU(A) relative to a*p&) in HL- and, in particular, LLadapted cells. In this spectral band the peaks at 440 nm (chl a, peridinin, diadinoxanthin) and 460 nm (chl c2, peridinin, diadinoxanthin) are regions where these pigments absorb at their respective maxima (Figs. 2 & 3). These spectral regions are in principle the regions with highest packaging effect, which is confirmed by comparing the maximum difference between a*i&) and a*mU(X) found at 440 and 460 nm. This is also in agreement with the calculations of Q*a(440 nm) reported by Johnsen & Sakshaug (1993).
Conclusions Our survey indicates that the unpacked and packed absorption characteristics in the 2 dinoflagellate species studied can be used as a useful approach to increase the understanding of bio-optical taxonomic characteristics and photoadaptional effects in phytoplankton. Our data can also be used as basic information for the interpretation of in situ sensed bio-optical data from multi-wavelength transmissometers and from remote sensing of ocean color (cf. Kirk 1983, Prezelin & Boczar 1986, Mitchell & Kiefer 1988, Schofield et al. 1991, Johnsen et al. 1994). The pigment model can be used as a tool to visualize the spectral characteristics and light harvesting contributions from the individual pigments in cells grown under different light-regimes and to model in vivo absorption characteristics. Both models can in addition be used as a tool to understand and to model/ reconstruct photosynthetic efficiency (oB) with and without the impact of photoprotective pigments (oB = 0 max a*ph; Bidigare et al. 1989, Sakshaug et al. 1991, Schofield et al. 1991). l
AchowIedgemenk Research was supported by the Norwegian Council for Scientific and Industrial Research (G.J.) and NSF funding to B.B.P. (OCE 8922935 and OCE 9301322). We thank Bernd Kroon, Allen Matlick, Egil Sakshaug and Oscar
257
Schofield for valuable comments and discussions during this work. This article is contribution number 259 from Trondhjem Biological Station.
LITERATURE CITED Berner, T., Dubinsky, Z., Wyman, K., Falkowski, P. G. (1989). Photoadaptation and the ‘package’ effect in Duna1je11a tertjo1ecta (Chlorophyceae). J. Phycol. 25: ?O-?8 Bidigare, R. R., Ondrusek, M. E., Morrow, J. H., Kiefer, D. A. (1990). 1n vjvo absorption properties of algal pigments. Ocean Optics X. SPIE Vol. 1302: 290-302 Bidigare, R. R., Prezelin, B. B, Smith, R. C. (1992). Bio-optical models and the problem of scaling. In: Falkowski, P. G., Woodhead, A. D. (eds.) Primary productivity and biogeochemical cycles in the sea. Plenum Press, New York, p. 175-212 Bidigare, R. R., Schofield, O., Prezelin, B. B. (1989). Influence of zeaxanthin on quantum yield of photosynthesis of Syncc~ococc~s clone WH?803 (DC2). Mar. Ecol. Prog. Ser. 56: 177-188 Bidigare, R. R., Smith, R. C., Baker, K. S., Marra, J. (1987). Oceanic primary production estimates from measurements of spectral irradiance and pigment concentrations. Global biogeochem. Cycles 1: 171-186 Bjergskov, T., Larsen, J., Moestrup, 0., Munk Sorensen, H., Krogh, P. (1990). Toksiske og potensielt toksiske alger i danske f arvande. Fiskeriministeriets Industritilsyn, Copenhagen Boczar, B. A., Prezelin, B. B., Markwell, J., Thornber, J. P. (1980). A chl c-containing pigment-protein complex from the marine dinoflagellate, G1enocfjnjum sp. FEBS Lett. 120: 243-247 Davies, B. H. (19?6). Carotenoids. In: Goodwin, T. W. (ed.) Chemistry and biochemistry of plant pigments. Academic Press, New York, p. 38-155 Demers, S., Roy, S., Gagnon, R., Vignault, C. (1991). Rapid light-induced changes in cell fluorescence and in xanthophyll-cycle pigments in Alexanckhn excavatzm (Dinophyceae) and T’_&ssjosjra pseudonana (Bacillariophyceae): a photoprotection mechanism. Mar. Ecol. Prog. Ser. 76: 185-193 Geider, R. J., Osborne, B. A. (1987). Light absorption by a marine diatom: experimental observations and theoretical calculations of the package effect in a small T’_&ssjosjra species. Mar. Biol. 96: 299-308 Guillard, R. R. L., Ryther, J. H. (1962). Studies of marine plankton diatoms. I. Cyclotella nana Hustedt and Detonula confervacea (Cleve) Gran. Can. J. Microbial. 8: 229-239 Hiller, R. G., Wrench, P. M., Gooley, A. P., Shoebridge, G., Breton, J. (1993). The major intrinsic light-harvesting protein of AmpldchUn: characterization and relation to other light-harvesting proteins. Photochem. Photobiol. 5?: 125-131 Iglesias-Prieto, R., Govind, N. S., Trench, R. K. (1993). Isolation and characterization of three membrane-bound chlorophyll-protein complexes from four dinoflagellate species. Phil. Trans. R. Sot. Land. B 340: 381-392 Jeffrey, S. W. (1972). Preparation and some properties of crystalline chlorophyll cl and c2 from marine algae. Biochim. Biophys. Acta 279: 15-33 Jeffrey, S. W., Haxo, F. T. (1968). Photosynthetic pigments of dinoflagellates (Zooxanthellae) from corals and clams. Biol. Bull. 135: 149-165
258
Mar. Ecol. Prog. Ser. 114: 245-258, 1994
Jeffrey, S. W., Humphrey, G. G. (1975). New spectrophotometric equations for determining chlorophylls a, b, cl and c2 in algae, phytoplankton and higher plants. Biochem. Physiol. Pflanz. 16?: 191-194 Johansen, J. F., Svec, W. A., Liaaen-Jensen, S, Haxo, F. T. (19?4). Carotenoids of the Dinophyceae. Phytochem. 13: 2261-2271 Johnsen, G., Sakshaug, E. (1993). Bio-optical characteristics and photoadaptive responses in the toxic and bloomforming dinoflagellates Gyrodinium aureolum, Gymnodinium galatheanum, and two strains of Prorocentrum minimum. J. Phycol. 29: 62?-642 Johnsen, G., Sakshaug, E., Vernet, M. (1992). Pigment composition, spectral characterization and photosynthetic parameters in Chrysochromuhna polylepis. Mar. Ecol Prog. Ser. 83: 241-249 Johnsen, G., Samset, O., Granskog, L., Sakshaug, E. (1994). In vivo absorption characteristics in 10 classes of bloomforming phytoplankton: taxonomic characteristics and responses to photoadaptation by means of discriminant and HPLC analysis. Mar. Ecol. Prog. Ser. 105: 149-15? Jovine, R. V. M., Triplett, E. L., Nelson, N. B., Prezelin, B. B. (1992). Quantification of chromophore pigments, apoprotein abundance and isoelectric variants of peridininchlorophyll a-protein complexes (PCPs) in the dinoflagellate Heterocapsa pygmaea grown under variable light conditions. Plant Cell Physiol. 33: 733-?41 Kirk, J. T. 0. (1983). Light and photosynthesis in aquatic ecosystems. Cambridge University Press, Cambridge Kirk, J. T. 0. (1992). The nature and measurement of the light environment in the ocean. In: Falkowski, P. G., Woodhead, A. D. (eds.) Primary productivity and biogeochemical cycles in the sea. Plenum Press, New York, p. 9-30 Koka, P., Song, P. (1977). The chromophore topography and the binding environment of peridinin-chlorophyll a-protein complexes from marine dinoflagellate algae. Biochim. Biophys. Acta 495: 220-231 Loeblich, A. R. III, Schmidt, R. J., Sherley, J. L. (1981). Scanning electron micrography of Heterocapsa pygmaea sp. nav., and evidence for polyploidy as a speciation mechanism in dinoflagellates J. Plankton Res. 3: 67-?9 Mitchell, B. G., Kiefer, D. A. (1988). Chlorophyll a specific absorption and fluorescence excitation spectra for lightlimited phytoplankton Deep Sea Res. 35: 639-663 Morel, A., Bricaud, A. (1981). Theoretical results concerning light absorption in a discrete medium, and application to specific absorption of phytoplankton. Deep Sea Res. 28A: 13?5-1393 Morel, A., Lazzara, L., Gostan, J. (198?). Growth rate and quantum yield time response for a diatom to changing irradiance (energy and color). Limnol. Oceanogr. 32: 1066-1084
Nelson, N. B., Prezelin, B. B. (1990). Chromatic light effects and physiological modeling of absorption properties of Heterocapsa pygmaea (= Glenodinium sp.). Mar. Ecol. Prog. Ser. 63: 37-46 Nelson, N. B., Prezelin, B. B. (1993). Calibration of an integrating sphere for determining the absorption coefficient of scattering suspensions. Appl. Optics 32: 6?10-6?17 Prezelin, B. B. (19?6). The role of peridinin-chl a-proteins in the photosynthetic light adaptation of the marine dinoflagellate, Glenodinium sp. Planta 130: 225-233 Prezelin, B. B. (1981). Light reaction in photosynthesis. In: Platt, T. (ed.) Physiological bases of phytoplankton ecology. Can. Bull. Fish. Aquat. Sci. 210: 1-43 Prezelin, B. B. (1987). Photosynthetic physiology of dinoflagellates. In: Taylor, F. J. R. (ed.) The biology of dinoflagellates. I. Dinoflagellata. Botanical Monographs, Vol. 21. Blackwell Scientific Publ., Oxford, p. 174-223 Prezelin, B. B., Boczar, B. A. (1986). Molecular bases of cell absorption and fluorescence in phytoplankton: potential applications to studies in optical oceanography. In: Round, F. E., Chapman, D. J. (eds.) Progress in phycological research, Vol. 4. Biopress Ltd, Bristol, p. 350-465 Rowan, K. S (1989). Photosynthetic pigments of algae. Cambridge University Press, Cambridge Sakshaug, E., Johnsen, G., Andresen, K., Vernet, M. (1991). Modeling of light-dependent algal photosynthesis and growth: experiments with the Barents Sea diatoms Thalassiosira nordenskioeldii and Chaetoceros furcella tus. Deep Sea Res. 38: 415-30 Sathyendranath, S, Lazzara, L., Prieur, L. (198?). Variations in the spectal value of specific absorption of phytoplankton Limnol. Oceanogr. 32: 403-415 Schofield, O., Prezelin, B. B., Smith, R. C., Stegmann, P., Nelson, N. B., Lewis, M. R., Baker, K. S (1991). Variability in spectral and non-spectral measurements of photosynthetic light utilization efficiencies. Mar. Ecol. Prog. Ser. 78: 253-271 Smayda, T. J, (1990). Novel and nuisance phytoplankton blooms in the sea: evidence for a global epidemic. In: Graneli, E., Sundstrom, B., Edler, L., Anderson, D. M. (eds.) Toxic marine phytoplankton Elsevier, Amsterdam, p. 29-40 Smayda, T. J., White, A. W. (1990). Has there been a global expansion of algal blooms? If so, is there a connection with human activities? In: Graneli, E., Sundstrom, B., Edler, L., Anderson, D. M. (eds.) Toxic marine phytoplankton. Elsevier, Amsterdam, p. 516-51? Sosik, H. M,, Mitchell, B. G. (1991). Absorption, fluorescence, and quantum yield for growth in nitrogen-limited Dunaheha tertiolecta. Limnol. Oceanogr. 36: 910-921 van der Hulst, H. C (1957). Light scattering by small particles. John Wiley, New York
This article was submitted to the editor
Manuscript first received: January 13, 1994 Revised version accepted: August 10, 1994