Pie Charts and Circle Segments [2]. The main goal is to compare continuous data changing their characteristics over time in order to identify patterns, exceptions ...
CircleView - A New Approach for Visualizing Time-related Multidimensional Data Sets Daniel A. Keim, Jorn ¨ Schneidewind, Mike Sips University of Konstanz, Germany {keim,schneide,sips}@dbvis.inf.uni-konstanz.de
ABSTRACT This paper introduces a new approach for visualizing multidimensional time-referenced data sets, called Circle View. The Circle View technique is a combination of hierarchical visualization techniques, such as treemaps [6], and circular layout techniques such as Pie Charts and Circle Segments [2]. The main goal is to compare continuous data changing their characteristics over time in order to identify patterns, exceptions and similarities in the data. To achieve this goal Circle View is a intuitive and easy to understand visualization interface to enable the user very fast to acquire the information needed. This is an important feature for fast changing visualization caused by time related data streams. Circle View supports the visualization of the changing characteristics over time, to allow the user the observation of changes in the data. Additionally it provides user interaction and drill down mechanism depending on user demands for a effective exploratory data analysis. There is also the capability of exploring correlations and exceptions in the data by using similarity and ordering algorithms.
Keywords Advanced Visual Interface, Visual data mining, Continuos Data Streams, Information Visualization
Categories and Subject Descriptors H.5 [INFORMATION INTERFACES AND PRESENTATION]: User Interfaces
1.
INTRODUCTION
Dynamic processes, arising in business, network or telecommunication, often generate tremendous streams of time related or real time data. Examples are sensor data, web click streams, network traffic logs, credit card transactions or Service Level Management (SLM) analysis. The analysis of this kind of data is an important and challenging task, since analysts are interested in patterns, correlations or exceptions in the data, in order to identify bottlenecks, critical process states or any other interesting information hided in the data. This may help to optimize and improve these processes.
In real time data streams it is important to analyze the data very fast, usually on the fly, and present the results in a meaningful and intuitive way to enable the user to quickly identify the important information, and to react on critical process states or alarming incidents. Human-computer interfaces based on visual representation and analysis of large data sets has evolved rapidly in recent years. Presenting data in an interactive, graphical form often fosters new insights, encouraging the formation and validation of new hypotheses to the end of better problem solving and gaining deeper domain knowledge. However, the time dependency of these data sets makes it more difficult to visualize and interact with them. In this paper, we present a new approach to the problem of analyzing multidimensional time-referenced data sets called Circle View. Our approach combines the popular visualization technique pie chart with a novel arrangement of the time events on circle segments. The independent variable is plotted around a circle in either a clockwise direction or alternatively in a counterclockwise direction. The dependent variable (usually a statistical value) is visualized as a circle segment whose area is proportional to the magnitude of the statistical value. The basic idea is to display the data dimensions as segments of a circle, and each segment is then divided into a number of subsegments in order to visualize the distribution and changes over the time. If the data consists of k dimensions, the circle is partitioned into k segments, each representing one data dimension. Circle View displays enables both local detail and global context in a single continuous view. Circle View displays support detailed inspection tasks and, at the same time, help users to find interesting time event patterns. We show, that Circle View provide a unique possibility for exploring large time referenced data sets in a meaningful, intuitive way, not offered by other approaches, and therefore takes advantage of both the computational and graphics display power of today’s computers, and the flexibility, creativity, and general knowledge of human data analysts.
2.
MOTIVATION AND RELATED WORK
Before describing our approach in detail, we first discuss three background topics. Each motivates a different aspect of our Circle View displays, and each draws on a different discipline in designing effective visualization interfaces.
2.1
On Design Challenges of Time-related Data
Time-related data describes observation in the real world and have a 1D time semantic. The observations are often called time events. Time events can be ordered belonging there time semantic. Hence, the major problem is to find meaningful arrangements of these time
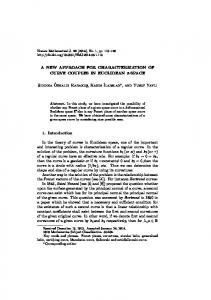
events on the screen, which preserves their ordering. Based on their natural time ordering, many arrangement possibilities arise. One straightforward possibility is to arrange the data items from left to right in a line-by-line fashion. On the one hand, such an approach would be very simple, but on the other hand, such an approach occurs overplotting of time events if more than one attribute is visualized. A spiral visualization technique for visualizing serial periodic data is presented in [3], which avoids overplotting. This approach falls to short, because in real world data analysis applications time related data sets are not necessarily periodic, and it is difficult to identify non-periodic correlations in such visualizations. A more sophisticated approach are Pixel Bar Charts [5] shown in figure 1. Pixel Bar Charts visualize each data item without aggregation and allows the ordering of the data items belonging more than one attribute.
Figure 1: Pixel Bar Charts: Basic Idea (left), Partitioning using the time attribute and ordering using the additional attribute dollar amount (right) All these approaches do not address the highly dynamic properties of time-related data sets. It is very difficult for the human to see multidimensional patterns and time correlations in these visualizations. In highly dynamic data sets, it would be very useful to show the actual time pattern in more detail and, at the same time, to keep the history over all time events. Techniques supporting clustering properties such as space-filling curves and recursive pattern [1] are only useful for data sets with 2D or 3D non-temporal semantics. It is not clear, how to visualize multi-dimensional time-related data sets. The problem here is the simple mapping to colored pixels. In high dimensional data sets, it would be very useful to see all dimensions in a single visualization. Taking all observations into account, we can extract the following design challenges: 1. top level view 2. highlighting of important information 3. interactivity 4. details on demand and drill down 5. continuous data stream displays 6. intuitiveness of the visualization method 7. comparison of data stream attributes
2.2
Focus and History
The Circle View interface enables the possibility to present real time data as well as historical data in a single intuitive visualization. To enhance the data exploration, the Circle View interface involves the human in the exploration process, following a three-step process [7]. Since Circle View is a approach for analyzing fast changing time dependent data streams, it is important to keep the visualization simple to avoid confusing the data analyst with too much information. We suggest visualizing only aggregated or summarized information in a first overview, e.g. critical process states. The data analysts can than select some interesting pattern or subsets for further investigation of the details or internal structure of the aggregated or summarized data.
2.3
Relevant Concepts from Exploratory Data Analysis
Exploratory Data Analysis often follows a three step process: Overview first, zoom and filter, and then details-on-demand which has been called the Information Seeking Mantra [7]. In other words, in the exploratory data analysis (EDA) of a data set, an analyst first obtains an overview. This may reveal potentially interesting patterns or certain subsets of the data that deserve further investigation. The analyst then focuses on one or more of these, inspecting the details of the data. Our Circle View provides an overview of the time related data set using a familiar and intuitive visualization. In this overview, the data analyst can identify interesting patterns or groups in the data.To focus on one or more of them, the data analyst can choose different time scaling functions to view the time events or phenomena in more detail. To get detailed access to the data, the data analyst can influence the layout on the circle segment. The goal is to get a reasonable clustering of the data dimensions.
3.
CIRCLE VIEW INTERFACE
In this section, we describe the Circle View interface in more detail.
3.1
Basic Idea of Circle Views
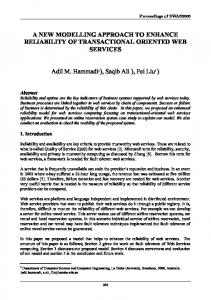
The basic idea of Circle View displays is to divide a circle in a number of segments, depending on the number of dimensions of the data set. Each segment is then divided in subsegments in order to visualize the distribution and changes of the time dependent data. Figure 2 shows the basic idea of Circle View displays. The circle in figure 2 is divided in 6 circle segments belonging to their priority. Each of the segments is then subdivided in time slots, to visualize and to compare the distribution and changes of the attribute values over the time. The color of each subarea shows the aggregated value of an attribute at a certain point in time. The example shows very clearly, that a data analyst can easy compare each time slot of a circle segment with the corresponding time slots of the neighbor segments. This is very useful to visualize correlations in the data and compare different attributes at a certain point in time. Figure 3 shows an example structure of a single Circle View segment. Each segment represents the magnitudes for an attribute over a certain number of time periods t0 , . . . ,tn . The number of time slots n and the time slot interval (e.g. second, minute, hour, · · · ) depends on the application scenario and sometimes on the user demands, and can therefore choose by the user. Circle View supports user drill down to help the user by choosing a time slot presenting a new segment with the next smaller time interval (if the corresponding information is available). For example, a segment is divided into
attribute1 a
t0
t3
e
ttri t (a en
m Ti
gm
attri
se
t e2 ibu
bu te6
t tr
t1 t2 t4 t5
but
t6
ame e) n
t7 t8
ute 3
ute trib t a
attri b
5
t9
low
high
above threshold
attribute4
low
high
(a) Evolution of the time events from the edge to the center
above threshold
t9
se
e
t7
ttri t (a en
t8
but
m Ti
gm
Figure 2: Circle View showing the evolution of multiple attributes over time
t6
ame e) n
t5 t4 t3
24 time slots, and each time slot represents one hour, and suppose the data analyst choose a certain hour, a new segment with a time slot for each minute of this hour is shown by the Circle View interface. Different orderings of the circle segments are possible. The goal of Circle View displays is on the one hand to show past and actual time events at the same time, but on the other hand, actual time events are more important. Circle View displays provides more space for the time slots of actual time events. See figure 3 for an illustration of this idea. One can easily see, that the actual time event is t9 the oldest time event is t0 . The length of the corresponding time slot, defined by the start radius and the end radius, depends on the priority of the events belonging their point in time. Note, figure 3 shows also different layouts for actual and past time events. In the left figure the actual time event is located at the edge of the circle and the past few data items are located in the center of the circle; the right figure shows the reverse situation.
3.2
Interface Functionality
Our Circle View Interface supports the following interaction possibilities: 1. Relate and Combine the data analyst can relate and combine with Circle Views that display the data with identical coordinates 2. Navigation data analyst can modify the visualization of the data onto the screen, Circle View interface supports manual and automated navigation methods 3. Selection provides data analysts with the ability to isolate a subset of the displayed data for operations such as highlighting, filtering, and quantitative analysis
3.3
Detection of Correlations and Patterns
The ordering of the segments plays an important role in finding correlations in time-related data sets. From a perceptual point of view,
t1
t2
t0
low
high
above threshold
(b) Evolution of the time events from the center to the edge Figure 3: Illustration of a single Circle View segment
it is easier to compare segments, which are located very close to each other. The eye of the data analyst can directly compare neighboring time slots, since all segments contained in the same circle have the same number and length of subsegments. Therefore the goal is to find a circular layout that places similar segments close to each other. To obtain such a useful ordering, the similarity between pairs of segments must be determined. Today, there are a lot of techniques for similarity search in data streams, which can very easily apply to our approach. In [8] a technique based on discrete Fourier transformation is described, an approach based on wavelets can be found in [4]. Note that it is very likely, that the ordering of segments can change since new data items come in or the focused attributes changes. Besides the computation of a segment ordering based on similarity, the user has the possibility to switch the position of any circle segment manually, in order to compare any segments of a Circle View display.
3.4
Visualization of continuous data streams
In order to analyze time series data, Circle View visualizes the changes of attribute values over the time. The visualization works for real time data as well as for historical data by moving or shifting the segments of the circle from the center to the edge of the circle (or reverse). Figure 4 shows an example with three different points in time. In the example the time slots are shifted to the center of the circle and new elements are inserted at the edge of the circle. The
attribute1
attribute1
attribute1
attribute1
te 6
te6
attrib u
attr i bu ute5 trib at
bu te
te5
attribute4
at t r ib u te
attri ute5 trib
u trib at
attribute4
at
attri bu te 3
ute5 trib
2
ute 3
attri bu te 3
at
ute
attri b
ute5
trib
ut e 2
attri bu te 3
attribute4
rib att
at
trib
u te 2
attribu te3
high
at
trib
2
2
attribute4 low
at
6
u te trib at
6
u te trib at
at t r ib u te
6
attribute1
above threshold
attribute4 ib u te
attr
attr ib u te
6
u te attr ib
ute5
t e5 ribu
att
attribute4
rib att
te5 ribu att
attribute4
attribute4
at t r ib u te
attri bu te 3
ute5 trib
2
at
ute
attribute4
Future work will include the development of a prototype and the application of Circle View to real world data sets.
trib
This paper presents a new interactive visualization technique called Circle View. The Circle View technique is a combination of hierarchical visualization techniques, such as treemaps, and circular layout techniques such as Pie Charts and Circle Segments. The main goal is to compare continuous data changing their characteristics over time in order to identify patterns, exceptions and similarities in the data. Circle View provides user interaction and drill down depending on users demands for a effective exploratory data analysis. There is also the capability of exploring correlations and exceptions in the data by using similarity and ordering algorithms.
6
at
4. CONCLUSION AND FUTURE WORK
attrib ute 3
An extension of single Circle Views is Multi-Circle Views where it is possible to categorize the data in multiple Circle Views. This makes it possible to observe groups of similar attributes or to visualize different levels of aggregation for one group of attributes. Such a technique is useful for data analysts looking for local patterns in different subclasses of attributes. The idea of Multi-Circle Views is shown in figure 5. As a feature, the diameter of each circle represents the weight (e.g. the importance) of the group of attributes. Circles with higher weights have a greater diameter and get therefore more space on the screen while circles with lower weights are shrinking. The weight of a group of attributes depends on the application scenario.
2
Combining Multiple Circle Views
ute 3
attri bu te 3
visualization must be updated each time new data comes in case of real time data, or a static visualization over time in case of historical data. In this case, the user has to choose a start and end time for the historical data set and an update time, which defines the speed of the animation.
ute
attrib
2
Figure 4: Circle View visualize a continuous data stream over time
attribute1
a
6
ib ttr
t e2
u te trib at
(c) Evolution of the time events at time step 3
3.5
a ibu
attribute1
6
attribute1
attribute1
(b) Evolution of the time events at time step 2
ttr
(a) Evolution of the time events at time step 1
Figure 5: Combining Multi-level Circle View Displays showing the evolution of multiple attributes over time
5.
ACKNOWLEDGEMENT
This work was partially funded by the Information Society Technologies programme of the European Commission, Future and Emerging Technologies under the IST-2001-33058 PANDA project (20012004).
6.
REFERENCES
[1] A NKERST, M., K EIM , D. A., AND K RIEGEL , H.-P. Recursive pattern: A technique for visualizing very large amounts of data. In Proc. Visualization ’95, Atlanta, GA (1995), pp. 279–286. [2] A NKERST, M., K EIM , D. A., AND K RIEGEL , H.-P. Circle segments: A technique for visually exploring large multidimensional data sets. In Visualization ’96, Hot Topic Session, San Francisco, CA (1996). [3] C ARLIS , J. V., AND KONSTAN , J. A. Interactive visualization of serial periodic data. In ACM Symposium on User Interface Software and Technology, San Francisco, CA (1998), pp. 29–38. [4] I. P OPIVANOV, R. M. Similarity search over time series data using wavelets. In ICDE 2002 (2002). [5] K EIM , D. A., H AO , M. C., DAYAL , U., AND H SU , M. Pixel bar charts: A visualization technique for very large multi-attribute data sets. Visualization, San Diego 2001, extended version in: IEEE Transactions on Visualization and Computer Graphics 7, 2002 (2002). [6] S HNEIDERMAN , B. Tree visualization with tree-maps: 2-d space-filling approach. ACM Transactions on Graphics (TOG) 11, 1 (1992), 92–99. [7] S HNEIDERMAN , B. The eyes have it: A task by data type taxonomy for information visualizations. In Proc. IEEE Visual Languages (1996), pp. 336–343. [8] Y. Z HU , D. S. Statstream: Statistical monitoring of thousands of data streams in real time. In VLDB 2002 (2002), pp. 358–369.