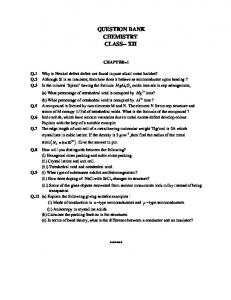
Difference between Top and Bottom. Districts Pass Percentage. CBSE CLASS-XII
RESULT. 2012. 2012 2011. 2010 2009 2008 2007. 14.23 12.92. 8.70.
ANALYSIS OF CBSE RESULT 2012
Class – XII PERFORMANCE 1
CBSE Class-XII (All Delhi) 2012 and 2011 A Quick look Year
Govt. Public
Aided
Delhi KVs
2012
87.72
90.00
79.87
95.53
2011
87.54
89.06
80.34
95.66
Diff.
+0.18
+0.94
-0.47
-0.13
2
CBSE Class-XII (All Delhi) Year 2012
Govt. 87.72
Public 90.00
Aided Delhi KVs 79.87 95.53
2011
87.54
89.06
80.34
95.66
2010
88.87
86.38
75.90
92.09
2009
87.15
86.42
75.70
89.94
2008
85.70
87.81
78.61
89.33 3
CBSE CLASS – XII RESULT FOR THE LAST TEN YEARS
Year 2002-03 2003-04 2004-05 2005-06 2006-07 2007-08 2008-09 2009-10 2010-11 2011-12
No. of Students appeared 47849 54341 57616 60570 68915 72205 87176 97402 112189 121345
Pass % 76.96 77.80 76.44 78.07 82.73 85.70 87.15 88.87 87.54 87.72
4
Graphical View of CBSE Class XII Result for the last 10 years 90 85.70
Pass %
85 80 75
87.15
88.87
87.72
87.54
82.73 77.80
78.07
76.96 76.44
70 2002-03 2003-04 2004-05 2005-06 2006-07 2007-08 2008-09 2009-10 2010-11 2011-12
Year Pass %
5
Category wise number of schools appeared Class-XII CBSE 2012 Government
719
Govt. Aided
154
KVs Private JNV Foreign Schools NDMC
36 454 2 98 9 6
Number of Schools Appeared for CBSE 2012 CLASS-XII 9, 1%
36, 3%
454, 33% 719, 52%
154, 11%
Government
Govt. Aided
Private
NDMC
KVS
7
56% Students Appeared from Delhi Govt. Schools
681, 0.3%
6778, 3.1%
72690, 33.5% 121345, 56.0%
15345, 7.1%
Government
Govt. Aided
Private
NDMC
KVS
8
55.7% Students Passed from Delhi Govt. Schools 569, 0.3%
6475, 3.4%
65421, 34.2% 106441, 55.7% 12256, 6.4%
Government
Govt. Aided
Private
NDMC
KVS
9
CBSE 2012 Class –XII Performance Indicator (Government and Private ) 95 89.47
Pass Percentage
90
88.69
87.84
85
85.7
86.42
86.38
90
87.15
88.87
87.54
87.72
2009
2010
2011
2012
82.73
80 75
87.29
89.06
76.44
78.07
70 65 2005
2006
2007
2008
Year Government
Private
10
CBSE CLASS – XII RESULT
2012
Pass Percentage 87.72 Appeared candidates increased by 9156 11
Difference between Govt. & Public Schools Class XII 2012 Year
Government
Private
Difference
2006
78.07
88.69
-10.62
2007
82.73
87.84
-5.11
2008
85.70
87.29
-1.59
2009
87.15
86.42
+0.73
2010
88.87
86.38
+2.49
2011
87.54
89.06
-1.51
2012
87.72
90.00
-2.28 12
CLASS – XII 2012 Number of Schools with Pass Percentage Year
100%
>=90%
2012
78
430
2011
70
398
2010
63
400
2009
50
355
2008
70
343
2007
46
277 13
CBSE CLASS – XII RESULT
2012
59.8% (430) schools have attained 90% or above Pass Percentage.
81.91% (590) schools have attained more than 80% Pass Percentage. 14
School Gender wise Pass Percentage Class XII 2012 Gender
APP
Pass
PP
QI
Boys
47491
38651
81.39
245.37
Girls
57791
53065
91.82
277.12
Co.Ed.
16063
14725
91.67
277.58
Total
121345
106441
87.72
264.75 15
Shift wise Pass Percentage Class XII 2012 Shift
APP
Pass
PP
QI
Morning
85545
77816
90.96
274.69
Evening
35800
28625
79.96
241.02
121345 106441 87.72
264.75
Total
16
School Category wise Pass Percentage Class XII 2012 Gender
APP
Pass
PP
QI
RPVV
1822
1805
99.07
366.69
Sarvodaya
62436
55777
89.33
270.00
Non-Sarvodaya
57087
48859
85.59
255.77
Total
121345
106441
87.72
264.75
17
Stream Wise Pass Percentage Class XII 2012 Stream
APP
Pass
PP
QI
Arts
82293
72240
87.78
256.00
Commerce
24180
20914
86.49
265.00
Science
8188
7338
89.62
308.97
Vocational
6684
5949
89.00
251.01
121345
106441
87.72
264.75
Total
18
Stream wise Pass Percentage Comparison Class XII 2012 PP12
PP11
PP10
PP09
PP 08 PP 07
Science
89.62
86.52
83.84
85.08
82.12
75.12
Arts
87.78
88.17
90.30
87.78
86.23
84.18
Commerce
86.49
85.00
86.78
86.33
85.54
81.35
Vocational
89.00
91.47
89.86
87.14
86.53
87.97
Stream
19
District wise Pass Percentage Class XII CBSE 2012 District App Pass PP QI South West B 7751 7322 94.46 285.11 West B 10734 9627 89.68 272.04 South West A 4153 3919 94.36 276.00 North 5638 5065 89.83 274.47 North West A 13055 12167 93.19 271.38 New Delhi 548 460 83.94 265.14 South 19151 16850 87.98 257.00 West A 6264 5524 88.18 277.31 North West B 15380 13146 85.47 258.46 East 13983 12194 87.20 265.40 Central 1923 1543 80.24 250.68 North East 22765 18624 81.80 254.21 Total 121345 106441 87.72 264.75 20
Graphical view of District wise PP CBSE 2012 Class-XII P a s s P e r c e n ta g e
100 95
94.46 94.36 93.19 89.83 89.68
90
88.18 87.98
87.2
85
85.47
83.94
81.8
80.24
80 75 70 South South North North West B West A South West B West A West A
East
North New North Central West B Delhi East
District 21
District Wise CBSE 2012 - Comparison with 2011 Class XII 2012 District
App
Pass
2011 PP
QI
App
Pass
PP
Difference QI
PP
QI
East
13983 12194 87.20 265.40 12938 11184 86.44 268.27 +0.76
North East
22765 18624 81.80 254.21 20827 16699 80.18 252.01 +0.62 +2.20
North
5638
5065 89.83 274.47
5340
4847 90.77 280.38 -0.94
-2.87 -5.91
North West A
13055 12167 93.19 271.38 11538 10348 89.69 271.23 +3.50 +0.15
North West B
15380 13146 85.47 258.46 13415 11718 87.35 266.97 -1.88
West A
6264
6470
5738 88.69 279.50 -0.51
-1.19
9627 89.68 272.04 10391 3919 94.36 276.00 4239
9649 92.86 281.77 -3.18 3855 90.94 278.88 +3.42
-9.73 -2.88
7322 94.46 285.11
7033 93.10 292.73 +1.36
-7.56
19151 16850 87.98 257.00 16918 15010 88.72 265.62 -0.74
-8.62
West B South West A
10734 4153
South West B
7751
South New Delhi Central
Total
5524 88.18 277.31
-8.51
7554
548
460 83.94 265.14
606
543 89.60 270.09 -5.66
-4.95
1923
1543 80.24 250.68
1953
1586 81.21 258.02 -0.97
-7.34
121345 106441 87.72 264.75 112189 98210 87.54 269.35+0.18 -4.60 22
District wise Ranking on the basis of PP Class XII 2012
District South West-B South West-A North West-A North West-B West-A South East North West-B New Delhi North East Central
2012 1 2 3 4 5 6 7 8 9 10 11 12
2011 1 3 5 4 2 8 7 10 9 6 12 11
2010 2 11 5 4 1 9 10 6 7 3 12 8
2009 4 11 2 3 1 6 7 10 5 8 12 9
2008 5 10 3 9 2 6 8 11 1 7 12 4 23
CBSE CLASS-XII RESULT 2012 Difference between Top and Bottom Districts Pass Percentage 2012 2011 2010 2009 2008 2007 14.23 12.92
8.70
8.67 18.75
18.6
24
Zone wise CBSE Class XII 2012 Zone No. 22 10 14 21 20 1 8 16 18 7 3 15 19 13
App 3507 5597 2390 4244 1840 2677 1004 1785 5881 4634 2993 2089 2313 4179
Pass 3307 5323 2062 4015 1750 2409 949 1647 5407 4116 2601 1815 2169 3630
PP 94.29 95.10 86.27 94.60 95.10 89.98 94.52 92.26 91.94 88.82 86.90 86.88 93.77 86.86
QI 290.57 283.53 281.64 280.70 280.62 279.87 277.25 276.53 274.39 273.86 273.73 273.02 272.33 269.35 25
Zone wise CBSE Class XII 2012 Zone No.
App
Pass
PP
QI
17 27 11 26 24 9 23 5 2 4 25 6 12 28
4853 1005 3754 548 2539 7458 6766 4439 8313 1039 9846 7887 7447 918 121345
4220 876 3170 460 2151 6844 6189 3727 7184 8785 8510 6112 6346 667 106441
86.95 87.16 84.44 83.94 84.71 91.76 91.47 83.96 86.41 84.15 86.43 77.49 85.21 72.65 87.72
269.18 268.21 265.43 265.14 263.21 262.25 259.73 259.70 257.74 255.87 253.53 248.90 248.82 231.47 264.75
Total
26
Pass Percentage
86.88
86.43 86.41 86.27
84.44 84.15 83.96 83.94
10 20 21 8 22 19 16 18 9 23 1 7 27 17 3 15 13 25 2 14 12 24 11 4 5 26 6
72.65
77.49
84.71
85.21
86.86
92.26
93.77
95.1
86.9
0
86.95
10
87.16
20
88.82
30
89.98
40
91.47
50
91.76
60
91.94
70
94.29
80
94.52
90
94.6
100
95.1
Zone wise Pass Percentage Class-XII 2012
28
Zone
27
RPVVs Performance - 2012 CBSE Class XII at a glance S. No. Sch ID School Name 1 1821137Dwarka Sector-10, RPVV 2 1001104Surajmal vihar RPVV 3 1309124Shalimar baghRPVV 4 1106252Nand nagari RPVV 5 1514023Hari nagarRPVV 6 1003261Gandhi nagar RPVV 7 1617009Paschim Vihar RPVV 8 1413076Rohini Sec-11RPVV 9 1208092Kishan GanjRPVV 10 11 12 13 14 15 16 17
2128031Krol BaghRPVV 1104149Yamuna Vihar RPVV 1925334Lajpat Nagar RPVV 1207108Raj Niwas Marg RPVV 1207113Civil LINES RPVV 1924038Lodhi Road RPVV 1720031Vasant Kunj RPVV 1310409Narela A- 10 RPVV TOTAL
APP Pass 97 97 119 119 94 94 99 99 65 65 126 126 98 98 127 126 94 93
PP 100 100 100 100 100 100 100 99.21 98.93
QI RANK 419.25 1 394.36 2 388.59 3 384.52 4 386.56 5 383.03 6 380.83 7 379.31 8 365.02 9
53 53 141 137 66 63 146 140 194 192 84 84 99 99 120 120 1822 1805
100 97.16 95.45 95.89 98.96 100 100 100 99.06
358.18 357.16 356.51 347.30 346.69 340.11 337.26 329.51 366.69
10 11 12 13 14 15 16 17 28
RPVVs - A comparison with last year Class XII 2012 2012
School ID
School Name
A
P
1
1001104
Surajmal Vihar
119
2
1003261
Gandhi Nagar
3
1104149
Yamuna Vihar
4
1106252
Nand Nagri
5
1207108
6
S. No.
2011
PP
QI
A
P
119
100.00
394.36
128
126
126
100.00
383.03
141
137
97.16
65
65
Raj Niwas Marg
146
1207113
Civil Lines
7
1208092
8
Diff.
PP
QI
PP
QI
128
100.00
375.5
0.0
18.86
131
131
100.00
374.3
0.0
8.73
357.16
150
141
94.00
349.7
+ 3.16
+7.46
100.00
388.40
99
99
100.00
369.6
0.0
+18.8
140
95.89
347.30
167
153
99.62
320.8
-3.73
+26.5
194
192
98.97
346.69
174
169
97.13
336.9
+1.84
+9.79
Kishan Ganj
94
93
98.94
365.02
92
92
100.00
369.8
-1.06
-4.78
1309124
Shalimar Bagh
94
94
100.00
388.59
80
75
93.75
357.4
+6.25
+31.19
9
1310409
Narela
120
120
100.00
329.51
115
115
100.00
324.1
0.0
5.41
10
1413076
Rohini
127
126
99.21
379.31
127
125
98.43
368
+ 0.78
+11.31
11
1514023
Hari Nagar
65
65
100.00
386.56
67
67
100.00
375.2
0.0
+11.36
12
1617009
Paschim Vihar
98
98
100.00
380.83
117
116
99.15
378.6
+ 0.85
+2.23
13
1720031
Vasant Kunj
99
99
100.00
337.26
113
113
100.00
322.7
0.0
+14.56
14
1821137
Dwarka
97
97
100.00
419.25
97
97
100.00
379.4
0.0
+39.85
15
1924038
Lodhi Road
84
84
100.00
340.12
80
79
98.75
328.8
+1.25
+11.32
16
1925334
Lajpat Nagar
66
63
95.45
356.51
68
68
100.00
373.2
-4.55
-16.69
17
2128031
Karol Bagh
53
53
100.00
358.19
65
65
100.00
358.9
0.0
-0.71
29
Top 15 Non-Pratibha Schools on basis of QI, Class XII 2012 Sl. No.
School ID
1
1822048
Ujwa GGSSS
53
53
100
343.79
1
2
1822058
Pandwala Khurd GGSSS
46
46
100
337.44
2
3
1413027
Sarvodaya Coed. Vidyalaya Sec-8 Rohini
129
128
99.22
336.49
3
4
1822066
Najafgarh, Jharoda Kalan GGSSS
72
72
100
334.81
4
5
1310036
Narela SKV No.1
396
393
99.24
334.06
5
6
1821033
Shahbad Mohammadpur GGSSS
55
49
89.09
331.86
6
7
1001006
Surajmal Vihar SBV
85
85
100
331.79
7
8
1720029
Mahipal Pur GBSSS
23
23
100
331.65
8
9
1516022
Shadi Khampur SKV
60
60
100
329.00
9
10
1207037
Shakti Nagar SKV No.1
226
222
98.23
328.30
10
11
1516027
Ramesh Nagar SKV
173
172
99.42
327.02
11
12
1822055
Jaffarpur Kalan S Coed. V
103
103
100
326.91
12
13
1822056
Khaira GGSSS
107
105
98.13
326.52
13
14
1516018
Moti Nagar SKV
95
94
98.95
324.97
14
15
2127179
Lal Kuan Zeenat Mehal SKV No.2
58
58
100
324.88
15
School Name
App
Pass
PP
QI
Rank
30
PP & QI of Urdu Medium schools Class XII 2012 Sl. No. School ID
School Name
App
Pass
PP
QI
1
2127179Lal Kuan, Zeenat Mahal, No.2-SKV
58
58
2
2127017Jama Masjid, No.2 SKV
60
57
3
2127025Chashma Building GGSSS
48
46 95.83 282.14
4
2127021Bulbuli Khana-SKV
96
83 86.46 281.01
5
1925049Joga Bai GGSSS
124
96 77.42 277.97
6
1105018Jafrabad, Zeenat Mahal SKV
474
395 83.33 277.23
7
1105008Jafrabad-GBSSS
98
94 95.92 268.27
8
1925035Noor Nagar-SKV
256
209 81.64 267.28
9
2127002Jama Masjid, No.1 SBV
56
41 73.21 262.25
10
2127003Darya Ganj, Pataudi House-SBV
102
78 76.47 231.81
11
1925052Joga Bai-GBSSS
63
56 57.14 219.97
12
1925002Noor Nagar-GBSSS
349
149 42.69 191.84
1784
1342 75.22 256.82
Total
100 324.88 95
318
31
Comparison of Urdu Medium Schools on the basis of PP & QI of - 2012 & 2011 2012 SCHID
SCHNAME
1105008
Jafrabad-GBSSS
1105018
APP
PASS
2011
PP
QI
APP
PASS
PP
QI
PP DIFF.
QI DIFF.
98
94
95.92
268.27
109
72
66.1
233.28
+29.82
+34.99
Jafrabad, Zeenat Mahal(Urdu Medium)-SKV
474
395
77.42
277.97
329
293
89.1
283.68
-11.68
-5.71
1925002
Noor Nagar-GBSSS
349
149
42.69
191.84
300
170
56.7
213.43
-14.01
-21.59
1925035
Noor Nagar-SKV
256
209
81.64
267.28
202
177
87.6
292.88
-5.96
-25.6
1925049
Joga Bai-GGSSS
124
96
77.42
277.97
88
85
96.6
295.47
-19.18
-17.5
1925052
Joga Bai-GBSSS
63
36
57.14
219.97
54
47
87
254.39
-29.86
-34.42
2127002
Jama Masjid, No.1(Urdu Medium)-SBV
56
41
73.21
262.25
39
29
74.4
251.33
-1.19
+10.92
2127003
Darya Ganj, Pataudi HouseSBV
102
78
76.47
231.81
77
66
85.7
251.26
-9.23
-19.45
2127017
Jama Masjid, No.2-SKV
60
57
95
318
97
95
97.9
308.93
-2.9
+9.07
2127021
Bulbuli Khana-SKV
96
83
86.46
281.01
128
107
83.6
291.94
+2.86
-10.93
2127025
Chashma Building(Urdu Medium)-GGSSS
48
46
95.83
282.14
55
53
96.4
306.96
-0.57
-24.82
2127179
Lal Kuan, Zeenat Mahal, No.2-SKV
58
58
100
324.88
65
63
96.9
299.25
+3.1
+25.63
1784
1342
75.22
256.82
1543
1257
81.46
268.64
TOTAL
-6.24
-11.82
32
CBSE CLASS – XII RESULT
2012
Top Govt. School in Overall (QI) In overall Delhi Region RPVV Dwarka with QI 419.25 has 13th Rank Among Delhi Govt. Schools this school stands on Top
Last year, the same school was at 84th Rank with QI 379.35 33
CBSE CLASS – XII RESULT
2012
Govt. Schools in Top 100 Over All Delhi region • • • • • • • •
2004-05 2005-06 2006-07 2007-08 2008-09 2009-10 2010-11 2011-12
One Four Nine Nine Ten Seven Four Eight 34
Government Schools among top 100 schools of Delhi Class XII 2012 Sl. No.
School ID
1
1821137
Dwarka Sector-10, RPVV
Dr. T.P. Singh
13
2
1001104
Surajmal Vihar RPVV
Ms. Renu Sabharwal
57
3
1309124
Shalimar Bagh, RPVV
Mr. Ramesh Chandra
70
4
1106252
Nand Nagari,RPVV
Mr. Pramod Kumar
72
5
1514023
Hari Nagar,RPVV
Ms. Usha Rani
76
6
1003261
Gandhi Nagar, RPVV
Mr. Garib Das
90
7
1617009
Paschim Vihar, RPVV
Ms. Archana Vishwadeep
96
8
1413076
Rphini Sector XI, RPVV
Mr. Rajpal Sehrawat
97
School Name
Head of School
Rank in Delhi Region
35
No. of Schools with Pass Percentage a comparison between 2012 & 2011 Class XII YEAR 100% >=90