Available online at www.sciencedirect.com
ScienceDirect Procedia Computer Science 47 (2015) 214 – 221
Classification and Prediction of Stock Market Index Based on Fuzzy Metagraph Thirunavukarasu Anbalagan a, S. Uma Maheswari b a
Teaching Fellow, Department of Computer science and Engineering, Anna University, University College of Engineering, Ramanathapuram623513, Tamilnadu, India. b Associate Professor, Department of Electronics and Communication Engineering, Coimbatore Institute of Technology, Coimbatore,641014, Tamilnadu, India.
Abstract Stock market price forecasting is one of the challenging tasks due to the difficulty in predicting the non-linear and non-stationary time series data. In this paper a Fuzzy Metagraph (FM) based stock market decision making, classification and prediction are proposed for short term investors of Indian stock market. Simple Moving Average (SMA), Exponential Moving Average (EMA), Moving Average Convergence Divergence (MACD) and Relative Strength Index (RSI) are some of the Technical Indicators which are used as input to train the system which is integrated with Fuzzy Metagraph. This approach of incorporating FM with SMA, MACD and RSI would be a new attempt in classification and prediction on share market investment. Stocks listed in Bombay Stock Exchange (BSE) in India are used to evaluate the performance of the system. The results obtained from the proposed FM based model are found to be satisfactory with very low risk error. © 2015 2015 The The Authors. Authors. Published Publishedby byElsevier ElsevierB.V. B.V.This is an open access article under the CC BY-NC-ND license © (http://creativecommons.org/licenses/by-nc-nd/4.0/). Peer-review under responsibility of organizing committee of the Graph Algorithms, High Performance Implementations and Peer-review responsibility of organizing committee of the Graph Algorithms, High Performance Implementations Applicationsunder (ICGHIA2014). and Applications (ICGHIA2014) Keywords: FIS; Fuzzy Metagraph; Stock Market Classification; Stock Market Prediction; RSI; MACD; SVM;
*Corresponding author. Tel.: +0-000-000-0000; fax: +0-000-000-0000 .E-mail address:
[email protected],
[email protected].
1877-0509 © 2015 The Authors. Published by Elsevier B.V. This is an open access article under the CC BY-NC-ND license (http://creativecommons.org/licenses/by-nc-nd/4.0/). Peer-review under responsibility of organizing committee of the Graph Algorithms, High Performance Implementations and Applications (ICGHIA2014) doi:10.1016/j.procs.2015.03.200
Thirunavukarasu Anbalagan and S. Uma Maheswari / Procedia Computer Science 47 (2015) 214 – 221
215
Introduction Over the past decades, a number of fuzzy graphs have been used to represent uncertain relationships between fuzzy elements or sets of fuzzy elements. However, existing fuzzy graphs are not capable of effectively modelling the directed relationships between sets of fuzzy elements. Fuzzy Metagraph (FM) is an emerging technique used in the design of many information processing systems like transaction processing systems, decision support systems, and workflow Systems [13]. When a FM said to be dynamic a constantly changing stream of data. Financial markets are highly volatile and generate huge amount of data on a day to day basis. Stock market prediction has always been one of the hottest topics in research, as well as a great challenge due to its complex and volatile nature. The Timing Problem to buy low and then sell high is a non-trivial problem and it is considered a dream of each investor. To solve this problem, the prediction of stock prices trend is important to be considered. A trader decides about what share to trade, when to trade, using either fundamental or technical analysis. Fundamental analysis use information about economic condition of the nation and world, financial state and management of the company’s involved, current political and weather information. Technical analysis is a method of analyzing stock price movement by using historical price information to predict future price of a stock. There are many way of analyzing stock movement. Technicians also look for relationships between price/volume indices and market indicators. Technical analysis involves predicting stock price using technical indicators like SMA, EMA, RSI and MACD [4, 11]. Soft computing techniques are widely applied to stock market problems. They offer useful tools in forecasting noisy environments like stock markets, capturing their non-linear behaviour. Utilizing intelligent systems such as neural networks, fuzzy systems and genetic algorithms for the purpose of prediction in the field of finance has extensive applications. Lately, artificial neural networks (ANNs) and support vector machines (SVMs) have been successfully applied to solve the problems of predicting financial time series, including financial stock market prediction. Although Adaptive Neuro-Fuzzy Inference System (ANFIS) has been applied in several studies, few of these have contributed to research in the financial area. The method of Support Vector Classification can be extended to solve regression problems. This method is called Support Vector Regression (SVR). SVR has been applied to stock market forecasting problems. 1.
Technical Indicators of Stock market and Fuzzy Metagraph
Technical indicators of stock market Technical indicators are used to develop the quality of the data, improve the efficiency and simplicity the stock prediction process. The two most popular types of moving averages are the Simple Moving Average (SMA) and the Exponential Moving Average (EMA). A SMA is calculated by adding the security's prices for the most recent "n" time periods and then dividing by "n" .This calculation is done for each period in the chart. EMA=Price (t) * k+ EMA (y) * (1-k) Where t represents today, y denotes yesterday, N is the number of days in EMA and k=2 / (N+1). MACD indicator tries to forecast market trends by comparing short and long-term tendencies. It is the difference between a security's 26-day and 12-day EMAs. MACD =26days EMA - 12days EMA A 9-day exponential moving average, called the "signal" (or "trigger") line is plotted on top of the MACD to show buy/sell opportunities. If MACD is above the signal line then buy. If MACD is below the signal then sell. The Relative Strength Index (RSI) considers whether an asset is over bought or oversold. RSI is describes in following equation RSI= 100-(100/1+RS) Where, RS=Average gain/Average loss Simple 14 period averages are used as initial value for average gain and average loss. For subsequent values the following formula is used Average Gain = [(previous Average Gain) x 13 +current Gain] / 14. Average Loss = [(previous Average Loss) x 13 + current Loss] / 14.
216
Thirunavukarasu Anbalagan and S. Uma Maheswari / Procedia Computer Science 47 (2015) 214 – 221
If RSI increases to above 70 (implies overbought) then sell. If RSI is between 30 and 70 (implies normal) then hold. If RSI decreases to below 30 (implies oversold) then buy. 1.1. Fuzzy Inference System (FIS) and Fuzzy Metagraph (FM) The main components of Fuzzy Inference System are a fuzzification interface, a fuzzy rule base (knowledge base), an inference engine (decision-making logic), and a defuzzification interface. Fuzzy if-then rules and fuzzy reasoning are the backbone of fuzzy inference systems, which are the most important modeling tools based on fuzzy set theory. The basic FIS can take either fuzzy inputs or crisp inputs, but the outputs it produces are always fuzzy sets. In fuzzification stage crisp values of input variables are converted into linguistic fuzzy variables. In defuzzification stage fuzzy variables are converted to crisp variables. These crisp values are used in decision making process [2, 10].
~
( e 1, CF1)
~ X1
~ X3
~
( e 3, CF3)
~ X5 ~ X2
~ X4
~
( e 2, CF2)
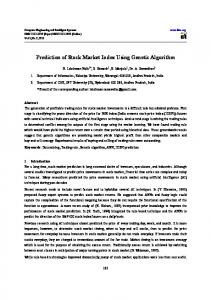
Figure 1: Fuzzy Metagraph with simple path
~
~ ~
~
A Fuzzy Metagraph S can be defined as a triple {X, X , E }, here X is its generating set where X is a
~
fuzzy set on X and E is a fuzzy relation on X X. A fuzzy set X on X is completely characterized by its membership function μ:X→ [0, 1] for each x X, μ(x) is the truth value of the statement of “x belongs to X ”. E is a
~ ~ ~ ~ ~ 5 ~ ~ ~ ~ ~ ~ } is known as fuzzy Meta Node and whose edge set consists of: e 1 = , e 1 = and e 3 = . The knowledge of problem will be stored in the computer memory
fuzzy edge set { e m ,m=1, 2, 3,.. m}. Figure 1 shows the FM whose element set is X = { X 1, X 2 , X 3, X 4 , X
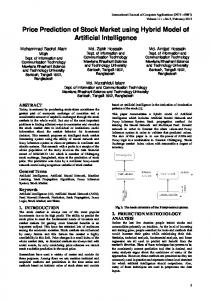
or knowledge database of Expert system. The Expert System will use inference rule-based techniques that are known as goal driven and data driven reasoning methods. FM is an effective modelling and analysis tool for rule based systems. Data management and model management are major functions of a DSS. Fuzzy metagraphs provide a better foundation for decision analysis, and also facilitate more effective design of DSS [13]. 2. FM Based Classification and Prediction of Stock Market Data The overall framework of the proposed model is illustrated as Fig. 2 and three major phases are provided. To detail the proposed model, each process of the proposed model is described as follows. Step 1: Collect experimental datasets Step 2: Data transformation and select essential technical indicators Step 3: Classification and Prediction of Stock Market based on Fuzzy Metagraph Stock data are collected from the website and the dataset has been collected from popular Indian companies like Tata consultancy service (TCS) and Reliance Industry Limited (RIL) from January 2011 to December 2012. The year 2011-2012 had been very challenging year for Indian share market. In this study stock information for that period is taken to analyze the performance of the system at hard times.
Thirunavukarasu Anbalagan and S. Uma Maheswari / Procedia Computer Science 47 (2015) 214 – 221
Collect Experimental Data Set Data transformation and select essential technical indicators
Set the type of membership function for output Variable
Generate FM and FIS system
Optimize parameters of FM and FIS from training datasets
Produce forecasts from the rules extracted from FM model
Model performance evaluation Figure 2: The framework of proposed model.
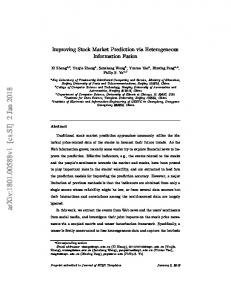
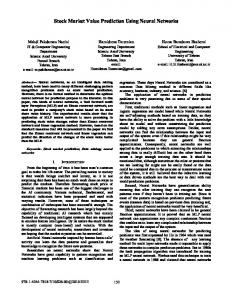
Stocks listed in Bombay Stock Exchange (BSE) are used to evaluate the system. For experimentation, the stock market datasets are divided into two sets such as: (1) training dataset and (2) testing dataset. 80% of the daily data were used for the training dataset and the remainder of the daily data was used for the testing dataset [10, 11]. 3. Experimental results and performance comparison In the FM module of the proposed model, a four layer has been chosen, which is completely linked architecture that has been shown in Fig. 3. The value of every variable is described by one of a feasible five fuzzy membership sets (VL L M H VH) which means very low (VL), low (L), medium (M), high (H), and very high (VH). Fuzzy membership functions may be crisp data observations about the membership degree of these fuzzy sets. Finally, resultant output has a single floating-point value from the set {0.0, 0.25,…,1.0}. As a result, the total number of probable if–then rules for fuzzy system. The output of the FM system has five unique fuzzy sets i.e. Strong Buy, Buy, Hold, Sell, Strong Sell that are defined. A Strong Buy signal is created when the output is almost to 1.0 and a Strong Sell signal is created when the output is almost to 0.0 from the above-mentioned case. The preliminary fuzzy rules are measured by the prediction system with technical indicators generating the following a few fuzzy metagraph rules.
~ X 15 then ~ ~ ~ ~ 2. If X 2 and X 6 and X 11and X 16 then ~ ~ ~ ~ 3. If X 3 and X 7 and X 12and X 17 then ~ ~ ~ ~ 4. If X 4 and X 8 and X 13and X 18 then 1.
~
~
~
If X 1 and X 5 and X
10and
~ X 20 (Rating ~ X 21 (Rating ~ X 22 (Rating ~ X 23 (Rating
e~ 1 = 0.00) e~ 2 = 0.25)
e~ 3 = 0.50) e~ 4 = 0.75)
217
218
Thirunavukarasu Anbalagan and S. Uma Maheswari / Procedia Computer Science 47 (2015) 214 – 221
~ ~ ~ X 19 then X 24 (Rating e 5 = 1.0) ~ ~ ~ ~ Where X 1= SMA is Very High, X 2= SMA is High, X 3= SMA is Medium, X 4= SMA is Low. ~ ~ ~ ~ ~ X 5= EMA is Very High, X 6= EMA is High, X 7= EMA is Medium, X 8= EMA is Low, X 9= EMA is ~ ~ ~ ~ Very Low. X 10= MACD is Very High, X 11= MACD is High, X 12= MACD is Medium, X 13= MACD ~ ~ ~ ~ is Low, X 14= MACD is Very Low. X 15= RSI is Very High, X 16= RSI is High, X 17= RSI is Medium, ~ ~ ~ ~ ~ ~ ~ X 18= RSI is Low, X 19= RSI is Very Low. X 20= Strong Sell, X 21= Sell, X 22= Hold, X 23= Buy, X 5.
24=
~
~
~
If X 4 and X 9 and X
14and
Strong Buy.
e~ 1 represents the rule X~ 1 X~ 5 X~ 10 X~ 15 → X~ 20, where “ ” denotes conjunction and “→” denotes
implication.
~ X1 ~ X2 ~ X3 ~ X4
SMA
EMA MACD
~ X5 ~ X6 ~ X7 ~ X8 ~ X9
~ X 20 ~ X 21 ~ X 22 ~ X 23 ~ X 24
~ X 10 ~ X 11 ~ X 12 ~ X 13 ~ X 14
RSI
Classification and prediction
~ X 15 ~ X 16 ~ X 17 ~ X 18 ~ X 19
Figure. 3: The FM based classification and prediction model.
Fuzzy Metagraph based Decision and Prediction for dynamic stock exchange databases have been constructed by using weighted fuzzy production rules. In these rules, a weight parameter can be assigned to each proposition in the antecedent of a fuzzy production rule and Certainty Factor (CF) can be assigned to
Thirunavukarasu Anbalagan and S. Uma Maheswari / Procedia Computer Science 47 (2015) 214 – 221
each rule. CF can be calculated by using some important variables in dynamic stock market. In Proposed System, FM learning algorithm is used to predict the future prices of stock. Figure 3 shows that Proposed System Architecture for stock market prediction and classification technique.
Figure 4: SVM based Stock market Classification result.
Figure 5: Stock market Classifier tree result.
The main objective of the paper is to build a prediction system to predict the future occurrence of an event If the prediction is based on past prices only, then the strategy for buy, sell and hold follows five simple rules: 1. If the predicted trend is positive and the share has been bought, then hold. 2. If the prediction is negative and the share hasn’t been bought, then do nothing. 3. If the prediction is positive and the share hasn’t been bought, then buy. 4. If the prediction is negative and the share has been bought, then sell. 5. All transaction take place at the end of each trading day, thus the closing price is assumed to be the trading price. News contents are one of the most important factors that have influence on market. If the prediction is based on news only, then the above plans are no longer applicable. This is due to the fact that news articles for each day can only be obtained in the morning before stock market opens. Therefore, changes are made to accommodate for the late arrival of news input and it is summarized as follows: Assuming the overall trend of the stock is rising. News is assumed to have valid influence on the stock only on the same day it is published. 1. If the news prediction is positive and the share hasn’t been bought, then buy at opening price.
219
220
Thirunavukarasu Anbalagan and S. Uma Maheswari / Procedia Computer Science 47 (2015) 214 – 221
2. 3. 4. 5.
If the prediction is positive and the share has been bought, then hold. If the prediction is negative and share hasn’t been bought, buy at closing price. If the prediction is negative and the share has been bought, sale at opening price. If the news prediction is absent, then buy at closing price.
A buy signal from the expert system is used to buy stock and sell signal is used to sell that stock. Only short or long type investment is used to assess the performance of the system. Forecasting performance of different classification methods is shown in table 1. Comparison of classification rate for two machine learning model is shown in table 2. Table 1. Forecasting performance of different classification methods Classification Method Hit Ratio (%) Random Walk (RW) Model
50
Neural Networks
69
SVM
73
FM
75
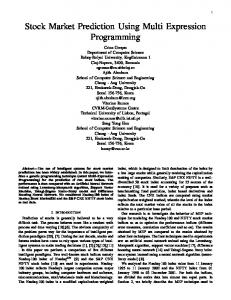
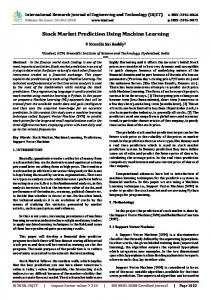
This study developed a novel hybrid model based on a FM and FIS for stock market price forecasting. The proposed model performs best based on two error measures, namely Root Mean Square Error (RMSE) and Mean Magnitude Relative Error (MMRE). The RMSE and MMRE error comparison with a different classification model is shown in Table 3. Figure 4 show that SVM based Stock market Classification technique. Classifier tree is shown in figure 5. FM based Prediction result has been shown in figure 6. Graphs in Figure 7 show that FM is able to follow the trend of the target prices.
Figure 6: FM based Stock market prediction result. Table 2. Comparison of classification rate for machine learning model. Machine Learning Model Algorithm Misclassification Rate FM 0.5611 SVM 0.7426
Correct classification Rate 0.4389 0.2574
Table 3. Comparison of prediction techniques for data of RIL. Prediction Technique
RMSE
MMRE
Accuracy
SVM FM
0.0171 0.0139
0.0228 0.0176
97.50 98.97
Thirunavukarasu Anbalagan and S. Uma Maheswari / Procedia Computer Science 47 (2015) 214 – 221
Figure 7. A comparison between the target and predicted output for three inputs of FM.
6.
Conclusion Stock market prediction and classification are important and of great interest because successful prediction of stock prices may promise attractive benefits. These tasks are highly complicated and very difficult. We have proposed a FM approach for stock market price forecasting. Experimental results, obtained by running on datasets taken from BSE India, show that our method performs better than other methods. This research is just a beginning and the long term goal is to predict the trend of the price variation by including various influential factors such as technical analysis and fundamental analysis. As a result, the system can be further applied for the daily trading purpose. In the future works, the model can be verified by other stock market such as China, Japan and Hong Kong. References [1] [2] [3] [4] [5] [6] [7] [8] [9] [10] [11] [12] [13]
Ahmad Kazem, Ebrahim Sharifi, Farookh Khadeer Hussain, Morteza Saberi, “Support vector regression with chaos-based firefly algorithm for stock market price forecasting,” Elsevier, Applied Soft Computing, Vol.13, pp. 947-958, 2013. Ajith Abraham , “Rule-Based Expert Systems,” Handbook of Measuring System Design, Oklahoma State University, Stillwater, USA, pp. 909-919,2005. indirect approach task fuzzy rule base for Akbar Esfahanipour, Werya Aghamiri,” adapted neuro-fuzzy inference system on stock market analysis”, Elsevier, expert systems with applications 37, pp. 4742–4748, 2010. Alejandro Escobar, Julian Moreno and Sebastian Munera, “A Technical Analysis Indicator Based On Fuzzy Logic,” Elsevier, Electronic Notes in Theoretical Computer Science 292, pp. 27–37, 2013. David Enke, Manfred Grauer, Nijat Mehdiyev, “Stock Market Prediction with Multiple Regression, Fuzzy Type-2 Clustering and Neural Networks”, Elsevier, Procedia Computer Science, Vol. 6, pp. 201–206, 2011. M.H. Fazel Zarandi , B. Rezaee , I.B. Turksen , E. Neshat , “A type-2 fuzzy rule-based expert system model for stock price analysis”, Elsevier, Expert Systems with Applications 36 , pp.139–154,2009. Hussein Dourra, Pepe Siy, “Investment using technical analysis and fuzzy logic,” Elsevier, Fuzzy Sets and Systems 127, pp.221– 240, 2002. Liang-Ying Wei, Tai-Liang Chen , Tien-Hwa Ho, “ A hybrid model based on adaptive-network-based fuzzy inference system to forecast Taiwan stock market,” Elsevier, Expert Systems with Applications , pp. 13625–13631,2011. pei-chann chang, chen-hao liu, “A TSK type fuzzy rule based system for stock price prediction”, Elsevier, expert systems with applications 34, pp135–144, 2008. Thirunavukarasu,Uma Maheshwari, “Technical analysis of Fuzzy Metagraph based decision Support system for capital market”, ISSN: 1549-3636, Science Publications, Journal of Computer Science 9 (9), pp.1146-1155, 2013. Thirunavukarasu,Uma Maheshwari, “Optimization of Fuzzy Metagraph Based Stock Market DSS Using Genetic Algorithm”, ISSN: 978-1-61804-233-0, Europment International Conferences, Computers, Automatic Control, Signal Processing and Systems Science, pp. 132- 139, April 2014. Wei Huang, Yoshiteru Nakamori, Shou-Yang Wang, “Forecasting stock market movement direction with support vector machine,” Elsevier, Elsevier, Computers & Operations Research, Vol.32, pp. 2513–2522, 2005. Zheng Hua Tan, Senior Member, “Fuzzy Metagraph and Its Combination with the Indexing Approach in Rule-Based Systems”, IEEE transactions on knowledge and data Engineering, Vol. 18, no. 6, pp. 829-841, June, 2006.
221