Prediction of Stock Market Index based on Neural Networks, Genetic Algorithms, and Data Mining Using SVD Dr. Mohammad V. Malakooti Faculty and Head of Department of Computer Engineering Islamic Azad University, UAE branch, Dubai, UAE
[email protected]
ABSTRACT Nowadays, most of the investors are interested to use of predicting tools for obtaining the accurate information about the stock market indices and to make a wise decision based in the precise market price. The prediction of the stock market index is an attractive research area that needs to be done with especial tools and with accurate algorithms. In this research we have uses the Neural Network (NN) for the learning and curve fitting process, Genetic Algorithms (GA) for the path search and optimization process, Decision Tree and Data Mining, using SVD to obtain the maximum accuracy of the prediction. The maximum accuracy of the prediction rate obtained for DJIA by using machine learning techniques is about 77.8%. Our focus on this research is to improve the decision tree, dada mining and neural network techniques by using the Eigen System Analysis, Mean value, and SVD.
KEYWORDS stock trading, risk, decision tree, machine learning, neural networks, genetic algorithms, data mining, data classification, future stock, SVM, Eigen value and SVD.
I.
INTRODUCTION
Manuscript In recent decade, many researchers focused on the stock market predication in which we can predict future of stock market price index based on the previous information and the relationships exist between them. In this
Amir AghaSharif Student of Department of Computer Engineering Islamic Azad University, UAE branch, Dubai, UAE
[email protected]
research we want to develop new software based on mathematical rules and prediction algorithms to help affiliates for a better decision. They can obtain the predicted values of the stock market price indices are unpredictable and buy or sell the stock with more confidence. Since the stock market price indices are unpredictable and not only depend upon the economic events but also will be affected by political events. Thus, we cannot easily fit a mathematical model to this unpredicted, nonlinear, and non-parametric rime series. The main concern of the broker is to get into the market at right time and either buy or sell the stock based on the reliable information. We have followed the work of researchers [2], [6], [13], and have used the fundamental analysis, data mining, machine learning, decision tree and neural networks to reach our prediction goals. Fundamental analysis can be used to obtain the price of stock by using natural values and attended return on buy or sell of the share [12], [7]. There are two kinds of analysis on the stock market: 1) Technical Analysis: We have not focused on the technical analysis because it has been used for short-term strategy on the market. In some cases, researchers may have used the technical analysis for stock market
based on the historical data of volume and trading price. We can use the past value of the stock market price information and predict its feature value based on the historical marketing information and volume [9][12]. Therefore, with machine learning and analysis of charts and models we can show the direction of the market.
possible actions such as buy or sell of share to achieve more benefit [8]. Six Major Risks in the Stock Market for Traders: 1) Trade Risk: what you put on trade: for example if you put one thousand dollars in a trade that is your Trade Risk.
2) Fundamental Analysis: We have focused on the fundamental analysis because it has been used for long-term strategy on the market and concentered on the mathematical model. Artificial Intelligent (AI) and Data Mining (DM) techniques which are very tough approach are similar to decision tree. One can use the artificial neural network to perform fundamental analysis in this scope [14]. Data Mining, an interdisciplinary subfield of computer science, is the computational process of discovering pattern in the large data sets involving methods at the intersection of Artificial Intelligence. We need to know all possible outcomes and chart representation and the directions to make a good decision that it comes from decision tree, one of the greatest ways to data classification. For machine learning algorithm we use the decision tree and Artificial Neural network method. In this decade, researchers focus on predicting the stock from the historical data and find the useful rules from raw data in database investors. They cannot extract these rules from raw data easily. Prevalently, in real world, it is impossible to conclude from data in case of huge databases. As we mentioned before, data mining helps investors to classify the historical data and predict the future of market for any
2) Market Risk: What can happen in the market, something that happen to the global economy, possibly to your country or where you are trading 3) Margin Risk: If you are borrowing money on margin. For example if you are borrowing money from a broker and you don’t pay that money back in a certain amount of time or you don’t close out some positions did you have this margin risk eventually, it will catch up to you and you do have to pay that money back or close out your position, otherwise you will be forced to close those positions. 4) Liquidity Risk: If you cannot get out of stock market quickly. That typically, you don’t have liquidity issues because you trade big amount of stock. 5) Overnight Risk: If you hold the position overnight or for multiple days because you don’t know what’s going happen overnight. You don’t know what will happened to the company, what news will come out, something overseas may happened to the company. You
don’t know really what’s going happen. 6) Volatility Risk: is the range of the magnitude that the stock is moving it. Think of volatility is the range, it could be up ten dollars one day, down ten dollars another day, those are more wallet of stock [15]. II.
RELATED WORKS
5) To appraise the model by using the famous method (evolution method). 6) Spread out the model in the market for predicting the suitable action like buy or sell a share. 7) Realize the reason and goals of model. After collecting data, we should use decision tree for classification. There are three main advantages for decision tree: it is fast, simple and accurate. The parameters in this model are, previous, open, max, min, last and action.
Decision Tree:
Genetic Algorithm:
One of the best methodologies in Decision Tree is Data Mining in order to collect the data from the stock market with this method and find firm model to extract issues as well as related solutions. There are different Data Mining methodologies to show us how to manage the collecting data, analyzing data and issue of the information, executing information and finally control the progressive of the result [5]. To make the model for analyzing the stock market, we use the CRISP-DM (Cross-Identity Standard Process for Data Mining) in decision Tree Method. This method is a result of the European consortium of companies in mid 1990s to achieve a non-dedicated standard process model for Data Mining methodology. This model involves 7 steps:
Another algorithm, which is used for prediction of stock marketing, is Genetic Algorithm. One of the reasons that we choose this technique is to find accurate solutions for our issues. This algorithm is referred to evolutionary biology like inheritance, mutation, selection and crossover. In Genetic Algorithm, the first step is to choose a set of chromosomes, which is a possible solution for issues in different situations. After that, one solution should be tested and become better. Finally the better solution has more chance to solve the problem. These steps should be continued until we get the optimal solution [4,10].
1) Comprehend the goals of extracting stock prices. 2) Find out the collected formation of that.
data
and
3) Provide the data, which is placed in the classification model. 4) Choose the technique for making model.
Evolution Strategies: For continuous parameter optimization, there is Evolution Strategy. We can show the gene as a vector and in this algorithm the intermediate recombination strategy is used. In the other words, the average of selected parent values is the child and randomly other parents are selected. At the end, two individual can go to the next generation. We have to follow 5 steps in this algorithm: 1) Build an initial population individuals randomly.
of
2) Use reproduction operator for making children from current population. 3) Conclude the suitability of each individual. 4) Choose the best individuals and ignore other ones. 5) Continue to step 2 until the number of generation is empty. The parameters of genetic algorithm are population size, crossover probability, selection and stopping criteria. And parameters of evolutionary strategy are: population size, crossover probability, mutation probability, selection and stopping criteria. [4] Neural Network: Because of using learning from training and experience, Machine Learning is one of the suitable methods in Artificial Intelligence criteria. ANNs is a connectionist model, which can improve the network by setting the weights. This model includes nodes, direct arcs and weights as well [1]. Rosenblatt created the feed-forward networks [9]. This model is represented by three layers: input layer, hidden layer and output layer. In feed-forward model the arcs are unidirectional. In financial criteria, there are different problems and the important one is to predict the stock market. As we mentioned before, ANNs networks model are used to predict the stock market and it uses the following parameters: previous day’s index value, previous day’s TL/ USD exchange rate, previous day’s overnight interest rate and 5 dummy variables each shows the working days of the week [3].
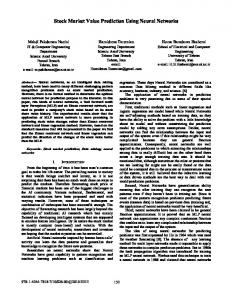
Learning, which is used in various field. Especially we use the different method such as Support Vector Machine (SVM) and reinforcement learning. To reach the goal of SVM method, we collect the global stock market and various financial products to predict the future stock trend. As a result of SVM method, we can predict of 74.4% in NAZDAQ, 77.6% in DJIA and 76.0% in S&P500. In machine learning, we use these formulas: At the first we define Xi(t), where i ϵ {1, 2, …}, to be feature i at time t. F= (X1, X2, ..., Xn)T (1) Where Xt = (x1(t), x2(t),..., xn (t)) (2) ∇δxi(t) = xi(t) − xi(t −δ) ∇δ X (t) = X (t) − X (t − δ) = (∇δ x1(t), ∇δ x2(t), · · · ∇δ x16(t))T ∇δ F = (∇δX(δ + 1), ∇δX(δ + 2), ..., ∇δX(n)) (3) Experimental Results of this Algorithm: A) Trend Prediction: 1) Single Feature Prediction: based on cross-correlation for approximation of importance of data collection in the algorithm we can predict daily NAZDAQ index trend. As we can see in below:
Machine Learning: As we mentioned in the introduction one of the method to predict the stock market is Machine
Figure 1: Prediction accuracy by single
As you can see the best result 70.8% belong to DAX.
Pr {vt+1– vt >ct } where ct = -(vt-ts– vt). (4)
2) Long Term Prediction: For reach to the more accuracy in the long term prediction, we use the below formula:
So, based on this formula we reach 85.0% accuracy when time period longer than 30 days.
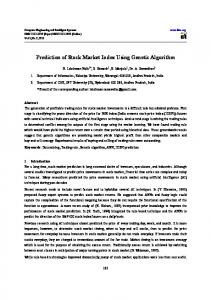
Figure 2: Decision Tree for the MECE
Evolution:
As a result of using Machine Learning algorithm to predict the stock market, we can summarize them into three parts:
The square Root of Mean Square Error (RMSE) for evaluation is used for evaluation of this model:
1) Have a strong relation between the US stock and global stock that close right before or at the very beginning of a US trading market time.
(5) Based on various algorithms such as baseline, SVM, linear and GLM, we can figure out the exact value of daily NAZDAQ.
2) We use different Machine Learning based model that we mentioned in this paper for predicting daily trend and the result is high accuracy numerical.
Table1: Stock Index Regression Accuracy
RMSE
Baseline 40.4
SVM 21.6
Linear 24.8
GLM 28.7
B) Multiclass Classification:
3) A useful trading model based on good trained predictor, which can create high benefit [10]. III.
For minimizing trading risk and maximizing the benefit, we use the SVM model and start from fundamental vision in SVM algorithm. For reach to this goal, we classify the raw data into at least three categorize: positive, negative and neutral. We can select these risky points and reject the prediction results. To make the multi classifier at the first we need to define width of the central area.
PROPOSED MODEL:
As we mentioned in section 2, one of the methods for predicting is Decision Tree. In this paper we want to improve the accuracy of other methods by using SVD, Eigen value and average of features. In Decision Tree method, we collect the data with 6 attributes: previous, open, min, max, last, action. Table2: Attribute Description Attribute Previous Open
(6)
Max
(7) tp: true positive fp: false positive fn: false negative
Min
Last Action
Description Previous day close price of the stock Current day open price of the stock Current day minimum price of the stock Current day maximum price of the stock Current day close price of the stock The action taken by the investor on this stock
Value Positive, Negative, Equal Positive, Negative, Equal Positive, Negative, Equal Positive, Negative, Equal Positive, Negative, Equal Buy, Sell
First of all, for use Decision Tree, the continues collected data should be changed to the discrete value. For changing continues data to discrete data there is one useful criterion, which is based on the close market price. When the amount of the open, max, min and last are greater than previous attribute in the same trading day, the positive value should be replaced to the previous attribute. Otherwise, we put negative instead of previous attribute, and if values are equal, we choose the equal attribute. As we mentioned in the table 3, we can see the continuous numerical value before we select the six attributes manually and before generated them to the discrete value. Table3: Sample of historical data before selecting relevant attributes and before generalization
Tabel4: Sample of historical data after selecting attribute Previous Positive Negative Negative Negative Negative Positive Positive Positive Negative
Open Positive Positive Negative Negative Equal Negative Positive Equal Positive
Max Positive Positive Equal Equal Positive Positive Positive Positive Positive
Min Negative Negative Negative Negative Negative Negative Positive Negative Negative
Last Negative Negative Negative Negative Positive Positive Positive Negative Negative
The next step after to reach the discrete value, is to build the classification model using the Decision Tree. In this paper we assume two different scenarios: Scenario 1: These steps should be done as following:
Previous
Open
Max
Min
Last
Action
25.82
25.99
26
25.41
25.67
Sell
25.67
25.68
25.68
25.2
25.3
Buy
25.3
24.8
25.3
24.41
24.9
Buy
2) Extract the features of them in same day but in 9 different times: previous, open, Max, Min, last and volume.
24.9
24.8
24.9
24.3
24.87
Sell
3) For each feature, form the matrix.
24.87
24.87
25.55
24.85
25.3
Buy
25.3
25.25
26
25.25
25.82
Buy
4) Calculate XXT and apply SVD on that for generating Eigen value.
25.82
25.99
26.4
25.99
26.3
Buy
26.3
26.3
26.3
26
26.02
Buy
26.02
26.09
26.09
25.55
25.63
Sell
According to table 4, show the same sample after collecting the six attributes and transforming them to the discrete amount.
1) Collect stock market data of 30 days.
5) Calculate average of sell volume and buy volume. 6) Calculate the average of each feature. 7) Assign different weights for first day, 7th day and 30th day and average of one month. 8) Finally for predicting the action we have to compare the present feature with first
Action Sell Buy Buy Sell Buy Buy Buy Buy Sell
day, 7th day, 30th day and average of month and make a best decision.
U: left singular vectors V: right singular vectors
9) If our present information is match with all 4 days we have to buy. If it is match with 3 of them we can buy with 25% risk and if it is match with 2 of them we can buy with 50% risk. Where In the following you can see the formula and simulation of the scenario.
δ=
X1 X2 X3 X4 X5 X6 X7 X8 X9
X=
(12) U= R V Ʃ -1
We have to generate this matrix for each feature in 30 days where xi represents 9 different times at the same day. After that R= XXT that it means each matrix should be multiplied by transpose of that. Calculate the SVD and Eigen value by the following formula: Calculate Eigen value: |[R- λI]|=0 Eigen values = λ1, λ2, …, λn
(8)
Calculate Eigen vector: R- λI =0 Eigen vector= Y1, Y2, …, Yn
(9)
Calculate SVD: SVDR= U Ʃ V Where
t
(13)
Scenario 2:
X1 X4 X7 X2 X5 X8 X3 X6 X9
XT =
(11)
(10)
In this scenario we have to also follow same steps but instead of applying SVD on raw data, we should use autocorrelation firstly and then apply SVD on that matrix. On the other hand, for each feature we generate autocorrelation matrix as you can see in the following: C= X1
X2
X3
X4
X5
X6
X7
X8
X9
X1
X2
X3
X4
X5
X6
X7
X8
X9
R0
0
X1
X2
X3
X4
X5
X6
X7
X8
R1
0
0
X1
X2
X3
X4
X5
X6
X7
R2
0
0
0
X1
X2
X3
X4
X5
X6
R3
0
0
0
0
X1
X2
X3
X4
X5
R4
0
0
0
0
0
X1
X2
X3
X4
R5
0
0
0
0
0
0
X1
X2
X3
R6
0
0
0
0
0
0
0
X1
X2
R7
0
0
0
0
0
0
0
0
X1
R8
(14)
We use the autocorrelation lags to form a new matrix of autocorrelation call Toeplitz matrix that may contain accurate information about our raw data.
group numbers with lesser standard deviation are preferred. So for each day we have to keep these information in order to prediction: 1) ϭ previous 2) ϭ open 3) ϭ Max 4) ϭ Min 5) ϭ Last 6) Volume sell 7) Volume buy 8) Avg previous 9) Avg open 10) Avg Max 11) Avg Min 12) Avg last 13) Min Eigen Value 14) Max Eigen Value 15) Avg Eigen Value
CM= R0 R1 R2 R3 R4 R5 R6 R7 R8
R1 R0 R1 R2 R3 R4 R5 R6 R7
R2 R1 R0 R1 R2 R3 R4 R5 R6
R3 R2 R1 R0 R1 R2 R3 R4 R5
R4 R3 R2 R1 R0 R1 R2 R3 R4
R5 R4 R3 R2 R1 R0 R1 R2 R3
R6 R5 R4 R3 R2 R1 R0 R1 R2
R7 R6 R5 R4 R3 R2 R1 R0 R1
R8 R7 R6 R5 R4 R3 R2 R1 R0
Again, we have to repeat calculation of SVD and Eigen value for this matrix. To compare the deviation from mean value among different numbers we calculate the average, variance and standard deviation of each attribute and store them in a vector. 1) Calculate the average Ā = (1/M)
(15)
i
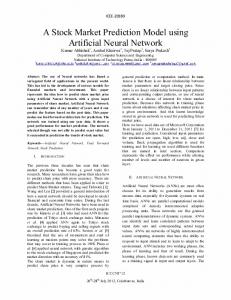
Simulation of 2 scenarios: Scenario1: Here, we apply scenario1 to data of previous feature as an example but in real world we have to use this algorithm for six attributes. X=
Where M is number of samples 2) Calculate variance Var = (1/M)
i
- Ā)2
(16)
X T=
3) Calculate the standard deviation Ϭ=
(17)
Group numbers with same average should be compared based on their standard deviation and
XXT=
SVD:
SVD:
U=
U=
S=
VT = S= Matrix S contains the Eigen values and these Eigen values have the main data that help in stock prediction. Scenario2: C=
VT =
CM=
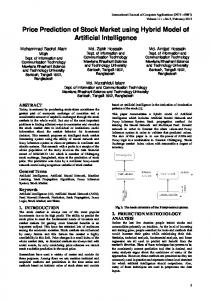
Eventually for getting the best result we use all algorithms in addition to our scenarios as following:
Analysis, Mean value and SVD to increase the predication rate. But we cannot reach to 100% prediction rate. We have used the Eigen value Analysis and SVD of the time series related to the stock market index, and compare the result with old models. The simulation results and our method of prediction caused that the price of stock market index based on SVD can provide a wider range of prediction. REFERENCES [1] A.F. Shapiro “Capital Market Applications of Neural Networks, Fuzzy Logic and Genetic Algorithms” , Penn State University, April 2003. Figure 3: cycle of stock market predicting
IV.
CONCLUSION
We have proposed a model that have used the Neural Network (NN) for the learning and curve fitting process, Genetic Algorithm (GA) for the path search and optimization process. We also used the Decision Tree and Data Mining, using SVD to obtain the maximum accuracy of the prediction. By applying the decision tree classifier on the historical price of the stock market we have obtained the decision rules in which give the advice to our investors to buy or sell the stock with more confidence. In the real world, we have more attributes that can have major effects on the stock market price index. Since, this events are out of our hand we are not able to put them in modular format or nice mathematic formula such as political event, or natural events like earthquake, tsunami, and the general economic condition, and investor’ expectations. In this research, we have focused to improve the decision tree, data mining and neural network techniques by using the Eigen System
[2] M.Al-Debie, M.Walker, “Fundamental Information analysis: An extension and UK evidence”, Journal of Accounting Research, 31(3), pp. 261–280. 1999 [3] B.Egeli, M.Ozturan, B.Badur, Stock Market Prediction Using Artificial Neural Networks. [4] G.Bonde, R.Khaled, “Stock price prediction using genetic algorithms and evolution Strategies” [5] J.Kamber, M.Jian, “Data Mining Concepts and Techniques”. San Francisco, CA: Morgan Kaufmann Publishers, 2011 [6] Lev, B., Thiagarajan, R. “Fundamental information analysis”, Journal of Accounting Research, 31(2), 190– 215. 1993. [7] J. J. Murphy, Technical Analysis of the Financial Markets:” a Comprehensive Guide to Trading Methods and Applications.” New York Institute of Finance. 1999 [8] Q.A. AL-Radaideh Adel Abu Assaf, E.Alnagi. “Predicting Stock Prices Using Data Mining Techniques” The International Arab Conference on Information Technology (ACIT’2013),pp.1,2,5 [9] Ritchie, J.C, Fundamental Analysis: a Back-To-TheBasics Investment Guide to Selecting Quality Stocks. Irwin Professional Publishing. 1996 [10] Rosenblatt, Frank, Principles of neuro dynamics: perceptron and the theory of brain mechanisms. Spartan
Press, Washington, DC, 1961. [11] S.Shen, H.Jiang , T.Zhang , “ Stock Market Forecasting Using Machine Learning Algorithms “ . [12] P.M Tsang A, P. Kwok A,S.O. Choy A, R.Kwan B, S.C .Ng A, J. Mak A, J.Tsang C,K.Koong D, and, T.Lam Wong E. “Design and implementation of NN5 for Hong Kong stock price forecasting”, Engineering Applications of Artificial Intelligence, 20, pp. 453-461. 2007 [13] Wu, M.C., Lin, S.Y., and Lin, C.H., “An effective application of decision tree to stock trading”, Expert Systems with Applications, 31, pp. 270-274. 2006 [14] Y.F.Wang, “Predicting stock price using fuzzy grey prediction system”, Expert Systems with Applications, 22, pp. 33-39. 2002 [15] www.tradersfly.com