Classification and Rule-Based approach to diagnose Pulmonary Tuberculosis Jyotshna Dongardive
Agnes Xavier
Kavita Jain
Dept. of Comp Science, Dept. of Comp Science, Dept. of Comp Science, University of Mumbai, University of Mumbai, University of Mumbai, Mumbai - 400098 Mumbai - 400098 Mumbai - 400098
[email protected] [email protected] [email protected]
ABSTRACT The paper proposes a novel methodology using the classification technique called Identification tree (IDT) to diagnose pulmonary tuberculosis (TB) computationally. It uses an exhaustive list of parameters by integrating the results of different medical examinations that are used conventionally. The model reduces the number of parameters required for the diagnosis from 45 to 19. It also offers a list of rules for the speedy and easy diagnosis. The proposed model was compared with existing models and it offered competitive results.
Siby Abraham G. N. Khalsa College, University of Mumbai, Mumbai – 400098
[email protected]
The paper proposes a novel classification and rule based approach which uses exhaustive list of parameters. It employs an IDT as a classification technique and reduces the exhaustive list of parameters into an optimal set of parameters. This in turn deduces the rules required for diagnosis of TB. The paper is organized in six sections. Section 2 gives literature survey. Section 3 introduces the model proposed. Section 4 provides the experimental setup and results. Section 5 offers conclusion and future work.
Categories and Subject Descriptors I.2 [Artificial Intelligence]: Problem Solving, Control Methods; Heuristic Methods, F.2.2 [Analysis of Algorithms and Problem Complexity]:Non-numerical algorithms and problems; Sorting and Searching.
General Terms Experimentation
Keywords Pulmonary Tuberculosis, Diagnosis, Identification tree, Reduction of parameters
Classification,
1. INTRODUCTION Tuberculosis (TB) is a disease caused by bacteria called Mycobacterium tuberculosis [1]. TB is one of the leading causes of infectious disease mortality in the world, with over two million deaths recorded annually, and it is estimated that one third of the world’s population is latently infected [2].Typical signs of TB are chronic or persistent cough and sputum production. If the disease is at an advanced stage, the sputum will contain blood. The other symptoms are fatigue, lack of appetite, weight loss, fever and night sweats. Medically, TB is diagnosed using x-rays of chest, analysis of sputum or/and skin test [3].The results of these tests can be used as inputs to various computational models. The two major approaches to diagnose TB computationally are based on either images of sputum/x-ray or the results of various chemical/pathological tests which we collectively call as parameters.
2. LITERATURE SURVEY The literature discusses various computational models which use images as inputs. Sadaphal et al. [4] recognizes ZiehlNeelsen (ZN) stained acid-fast bacilli (AFB) in digital images where each pixel on the image is classified as a TB or non TB object based on shape and size. Makkapati et al. [5] discussed diagnosis of TB from ZN-stained sputum smear images where the presence of TB is based on the beaded structure of the bacilli. Campbell et al. [6] used image processing techniques and neural network classifiers for the automatic identification of TB bacilli on Auramine stained sputum specimens. Forero et al. [7] used a classification tree to categorize a sample is positive and negative based on the heuristic knowledge extracted from the bacilli shape contour and color. Gabriel et al. [8] presented a new autofocus algorithm and a bacilli detection technique to reduce the time required to analyze sputum images and used k-means clustering technique for diagnosing TB. The other approach to diagnose TB is by analyzing various parameters which are collected from chemical/pathological tests such as preliminary reports, blood tests, urine tests etc. Nitaya et al. [9] performed chemical detection of TB in sputum by using gas chromatographic analysis and pattern recognition. Fend et al. [10] concluded that ZN staining for TB diagnosis is a time consuming approach and hence they proposed a gas sensor array for detecting different mycobacterium in the sputum samples. An artificial neural network (ANN) technique was further used to classify the patients into TB and non-TB group. Orhan et al. [11] have taken patient’s epicrisis reports and used a multilayer neural network (MLNN) model. Erhan et al. [12] used a MLNN with two hidden layers and a genetic algorithm (GA) for training the network. Solh et al. [13] developed ANN using
clinical and radiographic information to predict active pulmonary TB and further showed that ANN can identify patients with active pulmonary TB more accurately than physicians’ clinical assessment. Santos et al. [14] used only symptoms and physical signs to construct an ANN model for diagnosis of smear negative pulmonary tuberculosis (SNPT). Fernanda et al. [15] developed a prediction model using logistic regression and CART to estimate the risk of SNPT based on symptoms, physical signs and chest X-rays. Bakar et al. [16] have used hybrid rough neural network (RNN), results of which indicated that RNN had better accuracy rate. Asha et al. [17] used the association rule technique which offered a number of rules to describe the association between different symptoms.
3. PROPOSED MODEL The computational diagnosis of TB in the proposed model has been realized in the following four steps: Step 1: Collection of exhaustive list of parameters. Step 2: Creation of an IDT Step 3: Deduction of rules by traversing through IDT
Table 2. Snapshot of some of the parameters with its values ID
weight
fever
1 2 3 4 5 6 7 8 9 10
light heavy light average heavy light light average average average
Yes no Yes No No No No Yes Yes yes
urine appearance s.turbid Clear s.turbid Cloudy s.turbid s.turbid Cloudy Cloudy s.turbid s.turbid
Result TB NO TB TB TB NO TB NO TB NO TB TB NO TB NO TB
3.2 Creation of an IDT A classification method known as IDT is used to find the most significant parameters in the diagnosis of TB. The tree uses an Average Disorder Score (ADS) given by the following formula, for each of the parameters listed in table1.
3.1 Collection of parameters The parameters used in the model are collected from five different medical examinations which are preliminary, sputum, blood, urine and bio-chemistry. Table 1 shows the exhaustive list of 45 parameters used. Each of these parameters has a range of values, which are tabulated and used in the subsequent steps. Table 2 shows the snapshot of the tabulated data used in the training of the proposed system. Column 1 shows the patients ID. Columns 2, 3 and 4 show the three parameters amongst exhaustive list of 45 parameters. Column 5 gives the result of the sample used. Table 1. List of Parameters used Examinat ions
No of Para meter s
Parameters
Preliminar y examinati on
9
Cough, Fever , Loss of Appetite, Loss of Weight, Chest Pain, Sputum with Blood, Breathlessness, Smoking, Alcohol
Sputum Examinati ons
6
Mucopurulent , Blood , Saliva, Elastic Tissue, Epithelial Cells,Pus Cells
Blood Examinati ons
8
Urine Examinati ons
11
BioChemistry
11
Haemoglobin, Total WBC, Polymorphs, Lymphocyte , Eosihophils , Monocytes, Basophils, Netrophils Urine Color, Urine Appearance, Reaction, Albumin, Sugar, Bile Salt, Bile Pigment, Occult Blood, Epithelial Cells, Pus Cells, RBC Blood Urea, Sr. Creatinine, Sr. Uric Acid, Total Bilirubin, Direct Bilirubin, Indirect Bilirubin, SGOT, SGPT, Total Protein,Sr.Albumin, Sr.Globulin
where ‘nb’ is the number of samples in branch ‘b’; ‘nt’ is the total number of samples in all branches and ‘nbc’ is the number of samples in branch b of parameter. The pseudo code used for the generation of IDT is shown in Figure 1 Step 1: For each parameter P, calculate ADS. Step 2: Select a parameter P with least ADS. 2.1 This P forms the root of the tree. 2.2 Place this P in Selected Parameter (SP). 2.3 Calculate ADS for all the branches b of SP. Step3: For each b of SP IF (ADS! = 0) for b, label it as NonHomogenous (NH). Else Label it as Homogenous (H). End if
End for Step 4: For each NH Do Calculate ADS. Select Parameter with least ADS from P for this NH. Populate this P to SP. End do Step 5: Return the tree with SP and H. Step 6: Repeat Step 3 until ADS = 0. End For Step 7: Stop. Figure 1. Pseudo code for IDT The above pseudo code is illustrated in the following steps.
Step 1: Table 3 gives the list of 45 parameters and their ADS.
Table 3. ADS of each of the parameters Parameter Cough Fever
ADS
Sputum
0.7
Para meter HB Total WBC Poly
Loss of weight Loss of Appetite Breathlessness Smokin g Alcohol
0.5
Lym
0.9
Parameter OB Epi Cells Pus Cells RBC
0.6
Eosi
0.9
BU
0.7
0.9
Mono
0.9
0.9
0.9
Baso
0.9
0.8
0.9
Chest Pain Mucopu rulent
0.9
Netrophils Urine Color Urine Appear
Create -nine Uric acid T.Bili
0.8
D. Bili
0.9
0.537
In.Bili
0.9
Blood
0.7
0.9
SGOT
0.9
Saliva Epitheli al Cells Pus Cells
0.9 0.9
Reaction Alb BS
0.6 0.9
0.6 0.8
0.9
BP
0.9
SGPT T.Protein Sr.Albumin
Elastic Tissue
0.9
Sugar
0.9
0.9 0.7
0.9
ADS 0.9 0.9 0.8
Sr.Globulin
ADS 0.7 0.8
Step 3: We label the branches ‘light’ and ‘average’ as Non-Homogeneous (NH) as ADS are non-zero. The branch ‘heavy’ is labelled as Homogeneous (H) as its ADS is zero. Step 4: Calculate ADS of the NH branches ‘light’ and ‘average’. Since the ADS of ‘light’ is the least, its parameter ‘fever’ has been appended to SP. Similarly the parameter ‘urine appearance’ is also appended to SP. Now, SP = { ‘Loss of weight’, ‘Fever’, ‘Urine Appearnce’} Step 5: The tree returned in this step is shown in Figure 3.
0.9 0.7
0.9 0.9 Figure 3. Appended tree based on ‘Loss of weight’ Step 6 : The process is continued. Now, the parameter with the least ADS is ‘fever’ which has two branches ‘yes’ and ‘no’. These branches are Homogeneous as the ADS are zero. Similarly, the node ‘urine appearance’ has two branches ‘cloudy’ and ‘s-turbid’, out of which ‘cloudy’ is a Homogeneous branch and ‘s-turbid’ is Non-Homogeneous’. Figure 4 shows branches of ‘fever’ and ‘urine appearance’.
0.9
0.6
Step 2: From Table 3, ‘Loss of weight’ is the parameter with the least ADS and add it to SP. This becomes the root of the tree which has three branches namely ‘light’, ‘average’ and ‘heavy’ as shown in Figure 2. Calculate ADS of each of these branches. Loss of weight
light
heavy
1
Figure 4. Branches of ‘Fever’ and ‘Urine Appearance’
average
The process is contiuned until all the Non-Homogeneous branches are converted to Homogeneous.
4
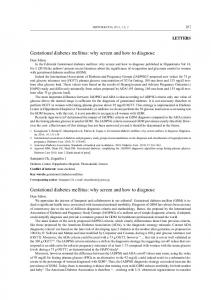
Step 7: Once all the nodes are made Homogeneous, we get a complete IDT. Figure 5 shows the snapshot of the IDT generated.
3
2
8
6
5
9
7
10
Figure 2. Branches of ‘Loss of weight’
3.3 Deduction of rules by traversing through IDT We can deduce rules by traversing the IDT from the root to each of its leaf nodes. The rules deduced for the IDT shown
Figure 5. Snapshot of IDT in Figure 4 are as follows. 1.
If a person’s weight is light and has fever, then the person is infected from TB. 2. If a person’s weight is light and does not have fever, then the person is not infected from TB. 3. If a person’s weight is heavy, then the person is not infected from TB. 4. If a person’s weight is average and appearance of urine is cloudy, then the person is not infected from TB. These rules can then be used for speedy and easy diagnosis of TB.
4. EXPERIMENTAL SETUP AND RESULTS The real time data was collected from Group of T.B Hospital, Mumbai. The dataset was prepared based on the clinical case history of patients, which contained 250 samples for two classes, class 1 contains 131 patients with TB and class 2 contains 119 patients without TB. The system was trained using 150 samples and the remaining was used for testing. The model has been implemented using VBA 2007 and Java jdk1.5.0_07. The database used is Microsoft Excel 2007. The experiments were conducted on a workstation with an Intel Pentium(R) 4 CPU, 3.06GHz, 512MB of RAM, running on Microsoft Windows XP Home Edition, Version 2002, Service Pack 3.
Figure 5: Complete IDT 3.
If a person’s weight is light, do not have fever and urine appearance is s.turbid, then the person is not infected from TB.
4.
If a person’s weight is average and urine appearance is s.turbid, then the person is not infected from TB.
5.
If a person’s weight is average, urine appearance is clear and blood urea range is between 15 and 40, then the person is not infected from TB.
6.
If a person’s weight is average, urine appearance is clear and blood urea range is less than 15 and greater than 40 and pus cells are 1 to 2, then the person is not infected from TB.
4.1 Complete IDT The IDT generated for diagnosis of TB is shown in Figure 5.
4.2 Rules for diagnosis The following are the 12 rules generated from the IDT. 1. If a person’s weight is heavy, then the person is not infected from TB. 2. If a person’s weight is light, do not have fever and urine appearance is clear, then the person is not infected from TB.
7.
If a person’s weight is average, do not have chest pain, elastic tissue is absent, epithelial cells is nil, pus cells is nil, WBC range is between 4500 and 11000, lymphocytes range is between 20 and 40, monocytes range is between 2 and 8, urine color is pale yellow , urine appearance is clear, albumin is absent, pus cells is nil, RBC is absent, occult blood is absent, blood urea range is less than 15 and greater than 40, Sr,uric acid range is between 2 and 7, direct bilirubin is 0.2 and sr.albumin range is less than 3.6 and greater than 5.2, then the person is not infected from TB.
8.
If a person’s weight is light and has fever, then the person is infected from TB.
9.
If a person’s weight is light, do not have fever and urine appearance is cloudy, then the person is infected from TB.
10. If a person’s weight is average and urine appearance is cloudy, then the person is infected from TB. 11. If a person’s weight is average, urine appearance is clear, blood urea range is less than 15 and greater than 40 and trace of pus cells is present, then the person is infected from TB.
Table 4. Reduced list of parameters No 1 2 3 4 5 6 7 8 9 10 11 12 13 14 15 16 17 18 19
Table 5 shows the results obtained for these measures.
12. If a person’s weight is average, have chest pain, elastic tissue is present, epithelial cells are 1 to 2, pus cells are 1 to 2, WBC range is less than 4500 and greater than 11000, lymphocytes range is less than 20 and greater than 40, monocytes range is less than 2 and greater than 8, urine color is dark yellow, urine appearance is clear, albumin is present, occult blood is present, pus cells is nil, RBS is present, blood urea range is less than 15 and greater than 40, Sr,uric acid range is less than 2 and greater than 7, direct bilirubin is greater than 0.2 and
sr.albumin range is between 3.6 and 5.2, then the person is infected from TB.
Reduced List Fever Loss of Weight Chest pain Elastic Tissue Epithelial Cells Pus Cells Total WBC Lymphocytes Monocytes Urine Appearance Urine Color Albumin Occult Blood RBC Pus Cells Blood Urea Sr. Uric acid Direct Bilirubin Sr.Albumin
Table 5. Detection measures Measures
Result in %
Accuracy
94.50
Sensitivity
98.00
Specificity
91.00
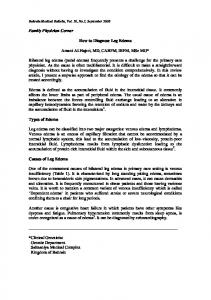
Figure 6 shows the relationship between the number of samples and its accuracy for five sets of samples. It is observed that as the number of samples increases the accuracy of the system increases and then it stabilizes from the sample of size 80 onwards.
4.3 Reduction of parameters In the process of traversing the IDT from the root node to each of the leaf nodes, it has been observed that the total number of parameters included in the tree was 19. Hence the exhaustive list of 45 parameters has been reduced to 19 parameters. The reduced list of parameters is shown in Table 4.
4.4 Effectiveness of the system The paper uses the following conventional detection measures. •
• •
Accuracy: It is defined as the ratio of the number of correct classification of input-output data to the total number of testing data. Sensitivity: It is defined as the ratio of the correctly classified TB cases to the total number of TB cases. Specificity: It is defined as the ratio of the correctly classified non-TB cases to the total number of non-TB cases
Figure 6. System Accuracy
4.6 Comparative study Table 6 gives the comparative study of the accuracy of diagnosis of TB using different methodologies with different inputs such as images and parameters. It is observed that the proposed model gives competitive results compared with other models.
Table 7 shows the comparative study of the accuracy of the proposed model with existing systems which also use parameters as inputs. These systems use 38 parameters. In Table 6. Comparative study with existing methodologies Methodology DIP
Accuracy in % 93.50
Gas chromatographic analysis and pattern recognition MLNN with LM(two hidden layers) MLNN with GA(two hidden layers) The proposed model
REFERENCES [1] Kumar, Vinay; Abbas, Abul K.; Fausto, Nelson; and Mitchell, Richard N. (2007). Robbins Basic Pathology (8th ed.). Saunders Elsevier. pp. 516–522. ISBN 978-1-41602973-1
95.08
[2] Corbett EL, Watt CJ, Walker N, Maher D,Williams BG, Raviglione MC, et al. The growing burden of tuberculosis: global trends and interactions with the HIV epidemic. Arch Intern Med 2003; 163:1009–21.
94.88
[3] Australian Prescriber 33 (1): 12–18. http://www.australianprescriber.com/magazine/33/1/12/18/
75.00
94.50
order to have a better comparison, the proposed model has been tested with the same number of parameters of which 17 were matching. Still, the proposed model could offer competitive result. Table 7. Comparative results of systems which use parameters Methods MLNN with BPwM(one hidden layer)
Accuracy in % 93.04
MLNN with BPwM(two hidden layers)
93.93
MLNN with LM(one hidden layer)
93.42
MLNN with LM(two hidden layers)
95.08
MLNN with GA(two hidden layers)
94.88
The proposed model
94.50
5. CONCLUSION The paper offers a novel method to diagnose pulmonary tuberculosis computationally. It uses identification tree (IDT) for classification. It not only reduces the number of parameters from 45 to 19 but offers a list of twelve rules for speedy and easy diagnosis. The proposed model offers comparable results with the existing systems. In future, the proposed model can be converted as a generic tool for diagnosis of different diseases. This can be done by testing the system against different data sets from diverse areas of medical field.
6. ACKNOWLEDGMENTS The authors acknowledge the contribution of staff of Group of TB hospital, Mumbai for providing the authentic data.
[4] P. Sadaphal,J. Rao, G. W. Comstock, M. F. Beg, Image processing techniques for identifying Mycobacterium tuberculosis in Ziehl-Neelsen stains, INT J TUBERC LUNG DIS 12(5):579–582 © 2008 The Union [5] Makkapati, V. Agrawal, R. Acharya, R. Philips, Segmentation and classification of tuberculosis bacilli from ZN-stained sputum smear images, Automation Science and Engineering, 2009. CASE 2009. IEEE International Conference [6] K. Veropoulos, C. Campbell, G. Learmonth, B. Knigh, J. Simpson , The Automated Identification of Tubercle Bacilli using Image Processing and Neural Computing, Proceedings of the 8th International Conference on Artificial Neural Networks, vol 2, pp 797-802 [7] Forero, M. G. Cristobal, G. Alvarez-Borrego, J, Automatic identification techniques of tuberculosis bacteria, PROCEEDINGS- SPIE THE INTERNATIONAL SOCIETY FOR OPTICAL ENGINEERING [8] Manuel G. Forero, Filip Sroubek and Gabriel Cristóbal, Identification of tuberculosis bacteria based on shape and color , Volume 10, Issue 4, August 2004, Pages 251-262 Imaging in Bioinformatics: Part III , ACM Digital library [9] Nitaya Maliwan, Ralston W. Reid, Stanley R. Pliska, Thomas J. Bird, James R. Zvetina, Direct diagnosis of tuberculosis by computer assisted pattern recognition gas chromatographic analysis of sputum, Biomedical Chromatography Volume 5, Issue 4, pages 165–170, July 1991 [10] Reinhard Fend, Arend H. J. Kolk, Conrad Bessant, Patricia Buijtels, Paul R. Klatser, and Anthony C. Woodman , Prospects for Clinical Application of Electronic-Nose Technology to Early Detection of Mycobacterium tuberculosis in Culture and Sputum , Journal of Clinical Microbiology, June 2006, p. 2039-2045, Vol. 44, No. 6 [11] Orhan Er & Feyzullah Temurtas & A. Çetin Tanrıkulu , Tuberculosis Disease Diagnosis Using Artificial Neural Networks, Springer Science + Business Media, LLC 2008 [12] Erhan Elveren & Nejat Yumuşak, Tuberculosis Disease Diagnosis Using Artificial Neural Network Trained with Genetic Algorithm, Springer Science + Business Media, LLC 2009
[13] El-Solh AA, Hsiao CB, Goodnough S, Serghani J, Grant BJ, Predicting active pulmonary tuberculosis using an artificial neural network, Chest. 1999 Oct;116(4):968-73. [14] A. Santos, B. Pereira, J. Six's, F. Mello and A. Kritski, Neural Networks: An Application for Predicting Smear Negative Pulmonary Tuberculosis, Advances in Statistical Methods for the Health Sciences Statistics for Industry and Technology, 2007, Part V, 275-287, DOI: 10.1007/978-08176-4542-7_18 [15] Fernanda Carvalho de Queiroz Mello, Luiz Gustavo do Valle Bastos, Sérgio Luiz Machado Soares, Valéria MC Rezende, Marcus Barreto Conde, Richard E Chaisson, Afrânio Lineu Kritski, Antonio Ruffino-Netto and Guilherme Loureiro Werneck, Predicting smear negative pulmonary tuberculosis with classification trees and logistic regression: a cross-sectional study, BMC Public Health 2006, 6:43 doi:10.1186/1471-2458-6-43
[16] A. A. Bakar, F. Febriyani, Rough Neural Network Model for Tuberculosis Patient Categorization, Proceedings of the International Conference on Electrical Engineering and Informatics Institut Teknologi Bandung, Indonesia June 17-19, 2007 [17] T. Asha; S. Natarajan; K. N. B. Murthy, Associationrule-based tuberculosis disease diagnosis , Second International Conference on Digital Image Processing, Kamaruzaman Jusoff; Yi Xie, Editors, 75462Y