gen, Inc., Darien, Illinois 60561, and the ¶Comprehensive Cancer. Center, The University .... nonporous; SB, start buffer; EB, elute buffer; HPCF, high performance ... from W. Lancaster (Wayne State University School of Medicine, De- troit, MI).
Technology
Classification of Cancer Cell Lines Using an Automated Two-dimensional Liquid Mapping Method with Hierarchical Clustering Techniques* Yanfei Wang‡, Rong Wu§, Kathleen R. Cho§¶, Kerby A. Shedden储, Timothy J. Barder**, and David M. Lubman‡§¶‡‡§§ A two-dimensional liquid mapping method was used to map the protein expression of eight ovarian serous carcinoma cell lines and three immortalized ovarian surface epithelial cell lines. Maps were produced using pI as the separation parameter in the first dimension and hydrophobicity based upon reversed-phase HPLC separation in the second dimension. The method can be reproducibly used to produce protein expression maps over a pH range from 4.0 to 8.5. A dynamic programming method was used to correct for minor shifts in peaks during the HPLC gradient between sample runs. The resulting corrected maps can then be compared using hierarchical clustering to produce dendrograms indicating the relationship between different cell lines. It was found that several of the ovarian surface epithelial cell lines clustered together, whereas specific groups of serous carcinoma cell lines clustered with each other. Although there is limited information on the current biology of these cell lines, it was shown that the protein expression of certain cell lines is closely related to each other. Other cell lines, including one ovarian clear cell carcinoma cell line, two endometrioid carcinoma cell lines, and three breast epithelial cell lines, were also mapped for comparison to show that their protein profiles cluster differently than the serous samples and to study how they cluster relative to each other. In addition, comparisons can be made between proteins differentially expressed between cell lines that may serve as markers of ovarian serous carcinomas. The automation of the method allows reproducible comparison of many samples, and the use of differential analysis limits the number of proteins that might require further analysis by From the ‡Department of Chemistry, The University of Michigan, Ann Arbor, Michigan 48109-1055, ‡‡Department of Surgery, The University of Michigan Medical Center, Ann Arbor, Michigan 481090654, §Department of Pathology, The University of Michigan Medical Center, Ann Arbor, Michigan 48109-0602, 储Department of Statistics, The University of Michigan, Ann Arbor, Michigan 48109-1092, **Eprogen, Inc., Darien, Illinois 60561, and the ¶Comprehensive Cancer Center, The University of Michigan Medical Center, Ann Arbor, Michigan 48109-0942 Received, August 5, 2005 Published, MCP Papers in Press, September 2, 2005, DOI 10.1074/ mcp.T500023-MCP200
© 2006 by The American Society for Biochemistry and Molecular Biology, Inc. This paper is available on line at http://www.mcponline.org
mass spectrometry techniques. Proteomics 5:43–52, 2006.
Molecular & Cellular
An important area in current cancer research is directed toward improving the molecular classification of cancer (1). This involves the ability to find markers that can be used to differentiate cancers arising in the breast, lung, colon, prostate, and other organs from one another (2, 3). Moreover various subtypes exist for cancers arising in many organs, each with different histopathology and ultimately very different clinical outcomes (4 – 6). It is essential to find markers that can be used to classify tumors with respect to organ of origin, benign versus aggressive behavior, and likely response to specific treatments (7). This ability to use molecular information to improve upon existing morphology-based tumor classification schemes would further the concept of personalized medicine. Ovarian cancer is particularly problematic in that it comprises a heterogeneous group of tumors, many with poorly characterized precursor lesions. Worldwide ovarian cancer is the sixth most common cancer in women with the highest incidence rates appearing in developed countries (1). Epithelial ovarian cancer, or ovarian carcinoma, constitutes about 90% of all ovarian cancers and is divided into four major distinct subtypes (serous, mucinous, endometrioid, and clear cell) based on their morphological features. Interestingly each ovarian carcinoma subtype resembles normal epithelial cells found elsewhere in the female reproductive tract derived from a common embryological precursor known as the coelomic mesothelium (5). For example, serous, mucinous, and endometrioid ovarian carcinomas display morphological features similar to normal epithelial cells lining the fallopian tube, endocervix, and endometrium, respectively. Presently ovarian carcinoma is managed clinically without consideration of morphology, yet there is growing clinical-pathologic and molecular evidence that the different subtypes may represent clinically, biologically, and genetically distinct disease entities. There are several strategies that can be used to classify cancers based upon either gene or protein expression. In particular, DNA microarrays have been used to characterize
Molecular & Cellular Proteomics 5.1
43
Classification of Cancer Cell Lines Using 2-D Liquid Mapping
global gene expression patterns of cancer samples (1, 4). This technology has enabled the study of comprehensive gene expression profiles of large numbers of tumor samples that can be used to classify cancers based upon characteristic gene expression patterns. In recent work, for example, Schaner et al. (4) used DNA microarrays to identify groups of genes that could distinguish ovarian from breast carcinomas, clear cell subtype from other ovarian carcinomas, and grades I and II from grade III serous papillary carcinomas. In related work, Perou et al. (8) were able to use gene expression signatures to define subclasses of breast cancer, and Sorlie et al. (9) were able to correlate differences in expression patterns of breast cancers with clinical outcome and identify subclasses having poor prognosis. In other work, Giordano et al. (3) were able to use gene expression profiles of adenocarcinomas of the lung, colon, and ovary to demonstrate the ability to classify tumors in an organ-specific manner. Schwartz et al. (5) used gene expression patterns to classify the different subtypes of ovarian cancer and showed that these patterns in ovarian adenocarcinomas reflect both the morphological features as well as the biological behavior. Numerous other studies have also used gene expression to classify various cancers, their subtypes, and their relationship to one another (10 –12). An alternative means of classifying different types of cancers involves profiling the protein expression of cells or serum (7, 13). The use of protein expression may be most informative for classification of cancers because mRNA and protein expression from a given gene may be discordant, and it is ultimately the protein expression that determines the function and structure of the cells. In addition, protein expression can be profiled from either tissues or serum. The traditional method for profiling large numbers of proteins from cells is 2-D1 gel electrophoresis (14). A number of studies using large numbers of quantitative 2-D gels for tumor classification have been performed for bladder, breast, lung, prostate, and ovarian cancers (6, 7) where, in general, benign and malignant tumors were identified by proteins that were differentially expressed and tumor stage classified by marker proteins that were up- or down-regulated. Alaiya et al. (6) did extensive work on the classification of ovarian tumors where protein expression of 40 tumor samples was evaluated using 2-D gels with hierarchical cluster analysis to distinguish borderline ovarian tumors from malignant and benign tumors. Other work by this group using quantitative 2-D gel electrophoresis identified protein markers that could classify benign, borderline, and malignant tumors (15). In recent work Jones et al. (7) examined the use of laser capture microdissection of human ovarian epithelial cells in tissue specimens followed by 2-D gel 1
The abbreviations used are: 2-D, two-dimensional; OSE, ovarian surface epithelial; RP, reversed-phase; CF, chromatofocusing; NPS, nonporous; SB, start buffer; EB, elute buffer; HPCF, high performance chromatofocusing.
44
Molecular & Cellular Proteomics 5.1
electrophoresis to identify proteins that change between invasive and noninvasive ovarian cancers. These differentially expressed proteins could potentially be used to generate markers of early detection or therapeutic targets unique to the invasive cancer. Although 2-D gel electrophoresis has been the most widely used technique for separating large numbers of proteins, there are still drawbacks that limit its utility as a general tool for profiling large numbers of samples. The 2-D gel method is generally a slow, manually intensive technique that can require several days to run and stain. Moreover the reproducibility of interlysate comparisons may be limited because of varying run conditions between gels where spots may become difficult to compare and quantitation may be limited. In addition, proteins are embedded in the gel requiring manually intensive procedures to excise the spots for further analysis by mass spectrometry. An alternative strategy to rapidly classify large numbers of different types of cancers using protein expression profiling is 2-D liquid mapping of proteins (16, 17). This technique uses chromatofocusing as the first separation parameter followed by nonporous reversed-phase HPLC as the second dimension to orthogonally map large numbers of proteins based on their pI and hydrophobicity, respectively. Both dimensions of analysis use standard chromatography (HPLC) equipment designed to reproducibly handle large numbers of samples in the liquid phase. It also uses UV absorption for detection so that quantitative comparisons of protein expression can be performed between samples. The method has distinct advantages in automation in that all fractions are in the liquid phase, large numbers of samples can be run, and protein maps can be obtained for easy differential comparisons. Moreover because proteins elute in the liquid phase, direct interface with other methods such as mass spectrometry is readily achieved. In this work, we demonstrated the use of an automated 2-D liquid fractionation system for the liquid phase separation and mapping of the protein expression for eight serous ovarian cancer and three ovarian surface epithelium (OSE) cell lines. Hierarchical clustering analysis was used to classify the different samples according to their protein expression profiles showing that specific types of serous carcinoma cell lines tend to cluster together. Several other cell lines, e.g. ovarian clear cell and endometrioid carcinoma and breast epithelial cell lines, were also fractionated and mapped by the 2-D liquid method, and cluster analysis was performed on a total of 18 samples. We compared our cluster analysis with results using oligonucleotide microarrays, identifying some similarities and some differences in the observed clustering patterns. We could classify different types of cancers as well as identify potential marker bands to classify different subtypes of individual cancer using this methodology. The use of this method also limits the number of potential marker bands that may need to be identified by mass spectrometry. We also demon-
Classification of Cancer Cell Lines Using 2-D Liquid Mapping
strated that these samples could be run reproducibly and in an automated fashion using this method. EXPERIMENTAL METHODS
Cell Culture and Sample Preparation A total of 14 ovarian cell lines were applied in this study, including eight serous, one clear cell, two endometrioid, and three immortalized ovarian surface epithelial cell lines. Ovarian serous carcinoma-derived cell lines HOC-1 and HEY were a gift from L. Dubeau (University of Southern California School of Medicine, Los Angeles, CA); DOV13, OVCA420, OVCA429, OVCA432, and OVCA433 were a gift from D. Fishman (Northwestern University, Chicago, IL); and PEO1 was a gift from T. Hamilton (Fox Chase Cancer Center, Philadelphia, PA). One ovarian clear cell adenocarcinoma-derived cell line (ES-2) and two ovarian endometrioid adenocarcinoma cell lines (MDAH-2774 and TOV-112D) were obtained from the American Type Culture Collection. Ovarian surface epithelial cells expressing SV40 large T antigen (IOSE-80 and IOSE-144) were a gift from N. Auersperg (University of British Columbia, Vancouver, British Columbia, Canada). HOSE-A (96.9.18), an OSE cell line immortalized with HPV16 E6/E7, was a gift from W. Lancaster (Wayne State University School of Medicine, Detroit, MI). The MCF10 human breast epithelial cell lines were obtained from the Barbara Ann Karmanos Cancer Institute (Wayne State University, Detroit, MI). Cells were cultured as described previously (18). All the cell lines were cultured under standard conditions in the Department of Pathology at the University of Michigan Medical School. The cells were maintained in Dulbecco’s modified Eagle’s medium with 10% fetal bovine serum and 1% penicillin/streptomycin (Invitrogen). When monolayer cultures were 80 –90% confluent, the cells were washed three times with PBS and lysed in lysis buffer. Lysis buffer (90 l/cm2) consisted of 6 M urea (ICN Biochemicals, Cleveland, OH), 2 M thiourea (ICN Biochemicals), 1% n-octyl -D-glucopyranoside (OG1) (Sigma), 2 mM DTT (Sigma), 2% Biolyte ampholytes pH 3–10 (Bio-Rad), and 2.5 mM PMSF (Bio-Rad). The cells were removed by scraping with a cell scraper (Costar, Cambridge, MA). The insoluble material was removed by ultracentrifugation at 35,000 rpm at 4 °C for 1 h, and the supernatant was stored at ⫺80 °C for further use.
Chromatofocusing (CF) and Nonporous (NPS) RP-HPLC Separation of Ovarian Serous Carcinoma Cell Line Lysates CF and NPS RP-HPLC were performed continuously using an integrated protein fractionation system, ProteomeLabTM PF 2D (Beckman Coulter, Inc., Fullerton, CA). An HPCF-1D column (250 ⫻ 2.1 mm) was used to perform chromatofocusing. Two buffers, a start buffer (SB) (Beckman Coulter, Inc.) and an elution buffer (EB) (Beckman Coulter, Inc.), were used to generate the pH gradient on the column. Both buffers were prepared in 6 M urea and 0.2% octyl glucoside. Before running the CF, the pH of SB was adjusted to 8.5 ⫾ 0.1 and the pH of EB was adjusted to 4.0 ⫾ 0.1 using either a saturated solution (50 mg/ml) of iminodiacetic acid (Sigma, catalog number I5629) if the buffer was too basic or 1 M NH4OH if the buffer was too acidic. A PD-10 G-25 column (Amersham Biosciences) was used to exchange the protein sample from the lysis buffer to the equilibration buffer used in the CF experiment. The HPCF-1D column was first flushed with 100% distilled water (filtered through a 0.45-m filter) for 10 column volumes at 0.2 ml/min and then equilibrated with 100% SB for 30 column volumes. After equilibration with SB, the HPCF column was ready to start the ProteomeLab PF 2D default method where injection of the sample began the method. After the method had been started, the column was washed with 100% SB to remove material that did not bind to the
column at pH 8.5. When the wash was complete, the UV absorbance returned to base line. Once a stable base line was achieved, the method was initiated at 100% EB. UV detection was performed at 280 nm, and the pH was monitored on line by a flow-through pH probe (Beckman Coulter, Inc.). As the pH decreased, pH fractions were then collected in 0.15 pH intervals where 30 fractions in total were collected in the range of pH 8.5– 4.0. After the pH of the eluent reached 4.0, the HPCF column was washed with 10 column volumes of 1 M NaCl, and the fractions were collected by time. After the salt wash, the HPCF column was washed with 10 column volumes of distilled or deionized water. The CF portion of the method for the ProteomeLab PF 2D required around 185 min. When the first dimension separation was completed, the pI fractions collected from the first dimension were then automatically run on the second dimension based on the specified ProteomeLab PF 2D sequence. Proteins were resolved by reversed-phase chromatography using an HPCF-2D (4.6 ⫻ 33 mm) NPS column (Beckman Coulter, Inc.) and detected by absorbance at 214 nm using a Beckman model 166 UV absorption detector. Solvent A was 0.1% TFA in water with 0.05% n-octyl -D-galactopyranoside, and solvent B was 0.08% TFA in acetonitrile with 0.05% n-octyl -D-galactopyranoside. The gradient was run from 15 to 25% B in 1 min, 25–35% in 6 min, 35–38% in 4 min, 38 – 45% in 6 min, 45– 65% in 2 min, 65– 67% in 6 min, finally up to 100% in 1 min, and then back to 5% in 1 min. After the gradient, the column was washed by two fast gradients from 5% B to 100% B in 5 min and 100% B back to 5% B in 1 min. At the end of each second dimension run, the method equilibrated the column with an initial mobile phase (A) for 10 column volumes. The flow rate used was 0.75 ml/min, and the column temperature was 65 °C. Proteins were collected for further analysis using an automated fraction collector. The method automatically saved the raw UV absorbance data for each second dimension analysis of the chromatofocusing fractions for protein mapping and data analysis using ProteoVueTM in the PF 2D Software Suite.
Software The data from the 2-D liquid separations are displayed using ProteoVue and DeltaVue software available in the PF 2D Software Suite (Beckman Coulter, Inc.). The chromatographic UV intensities result from the NPS HPLC second dimension separation of each pI fraction that were converted and displayed in a 2-D “lane and band” format by the ProteoVue software resulting in a highly detailed pI versus hydrophobicity protein expression map. ProteoVue allows comparison of multiple or all second dimension runs for one sample in a 2-D map using either gray scale or a color-coded format where color hue or its intensity is proportional to the relative quantitative UV intensity of each peak. Relationships or patterns within a complex chromatographic data set can be easily viewed in this format. The DeltaVue software allows side-by-side viewing of the second dimension runs for two samples or two groups of samples so that differences in protein expression between them can be compared. This software quantitatively displays one protein map in shades of red and the other map in shades of green. The difference between the two maps is obtained by point-by-point subtraction or by area difference and displayed as a third map in the middle. The color (red or green) at a particular location in the difference map indicates which protein is more abundant, and the color brightness indicates the quantitative difference. The program also provides a means to obtain a quantitative number between the expression levels of protein in the two samples.
Data Analysis and Clustering Data Standardization—The raw UV data for each sample were standardized to remove differences in the level and
Molecular & Cellular Proteomics 5.1
45
Classification of Cancer Cell Lines Using 2-D Liquid Mapping
slope of the base line. To do this, for each point, the 10th percentile within a window of ⫾50 measurements was calculated and subtracted from the point. Then negative values were replaced with zero, 0.0001 was added to all values, and the data were log-transformed. Alignment—Standardized UV data for each pair of samples were aligned to maximize the local correlation coefficients between the aligned samples. Specifically suppose samples A and B are to be aligned. An alignment is defined by a sequence of index pairs (ta(1),tb(1)), (ta(2),tb(2)) . . . such that (ta(k ⫹ 1) ⫺ ta(k), tb(k ⫹ 1) ⫺ tb(k)) is equal to (1,0), (1,1), or (0,1). That is, at each step either the A sequence advances by one index, the B sequence advances by one index, or both sequences advance by one index. At the initial point either ta(1) or tb(1) is equal to 1, and at the final point either ta or tb is equal to the length of the data sequence (corresponding to the greatest measured hydrophobicity value). To evaluate alignment quality, for each pair of indices ta in sample A and tb in sample B such that 兩ta ⫺ tb兩 ⬍ 150, the correlation coefficient between the data values A(ta ⫺ 75) . . . A(ta ⫹ 75) and B(tb ⫺ 75) . . . B(tb ⫹ 75) was calculated. The goal is to maximize the sum of local correlation coefficients over all possible ta, tb sequences that always remain within 150 units of each other. This problem can be efficiently solved using dynamic programming techniques. Comparisons—To compare the overall pattern of protein expression in the samples, each pair was aligned separately as described above, and then a correlation matrix was formed by calculating the Pearson correlation coefficient between each aligned pair of samples. These correlation matrices were then visualized using a hierarchical clustering technique. The hierarchical clustering technique produces a dendrogram in which pairs of points are joined sooner (i.e. closer to the ends of the dendrogram) if they have greater correlation. Complete linkage clustering was used to define the dendrograms. Biomarker Identification—To identify potential biomarkers, all samples were first aligned to a single sample selected as the standard. Then comparisons were made separately at each hydrophobicity level between two groups of samples. Values were selected if the ratio between mean levels within the two groups exceeded 4 and if the t test p value between the two groups was less than 0.05. In addition, at least 25 consecutive hydrophobicity levels were required to meet these conditions for the band to be considered as a biomarker. RESULTS AND DISCUSSION
Cell Lines—Eight ovarian serous carcinoma-derived cell lines and three OSE cell lines (IOSE-144, IOSE-80, and HOSE-A) were used to study ovarian cancer proteomes (Table I). HOC-1 was derived from ascitic tumors of a patient with well differentiated serous adenocarcinoma of the ovary (19). HEY was established from a moderately differentiated papillary (serous) cystadenocarcinoma of the ovary that had been passaged previously as a xenograft in immunocompromised
46
Molecular & Cellular Proteomics 5.1
TABLE I Cell lines used for comparison of ovarian cancer proteins Cell line HOSE-A IOSE-144 IOSE-80 HOC1 PEO1 DOV13 HEY OVCA420 OVCA429 OVCA432 OVCA433 ES-2 MDAH-2774 TOV-112D CA1d CA1a AT1
Description HPV16 E6/E7 immortalized OSE Life-extended (with SV40 large T antigen) OSE cell lines Life-extended (with SV40 large T antigen) OSE cell lines Ovarian serous carcinoma Ovarian serous carcinoma Ovarian serous carcinoma Ovarian serous carcinoma Ovarian serous carcinoma Ovarian serous carcinoma Ovarian serous carcinoma Ovarian serous carcinoma Ovarian clear cell adenocarcinoma Ovarian endometrioid adenocarcinoma Ovarian endometrioid adenocarcinoma Fully malignant human breast cancer cells Fully malignant human breast cancer cells Preneoplastic human breast cells
mice (19). PEO1 was derived from the ascites of a patient with poorly differentiated serous adenocarcinoma after treatment by chemotherapy (20). Both HEY and PEO1 produce tumors in immunocompromised mice (19, 20), whereas HOC-1 does not. The ovarian carcinoma cell lines DOV13, OVCA420, OVCA429, OVCA432, and OVCA433 were originated from serous cystadenocarcinoma (21). The clear cell carcinoma line ES-2 and two endometrioid carcinoma cell lines, MDAH-2774 and TOV-112D, were also mapped by the 2-D liquid method for comparison with the serous carcinoma cell lines. ES-2 was established from a surgical tumor specimen described as a poorly differentiated ovarian clear cell carcinoma. Tumors develop when nude mice are inoculated subcutaneously.2 The MDAH-2774 cell line was developed from cells in the ascitic fluid from a patient with endometrioid ovarian cancer and forms tumors in nude mice (22). TOV-112D was derived from an endometrioid carcinoma from a patient who was never exposed to chemotherapy or radiation therapy (23). Three MCF10 breast epithelial cell lines (MCF10AT1, MCF10CA1a.cl1 (CA1a), and MCF10CA1d.cl1 (CA1d)) were also mapped and compared with the ovarian carcinoma cell lines. The MCF10A cell line originated from a patient with fibrocystic disease (24). MCF10AT1 cells are MCF10A cells transformed with a mutant c-Ha-Ras protein (T24). This line forms preneoplastic lesions in nude mice that represent a premalignant stage with potential for neoplastic progression. CA1a and CA1d were derived from xenografts of MCF10AT1. When subcultured and rexenografted, these lines rapidly form invasive carcinomas with metastatic potential and display histologic variations ranging from undifferentiated carcinomas 2
ATCC cell biology catalog.
Classification of Cancer Cell Lines Using 2-D Liquid Mapping
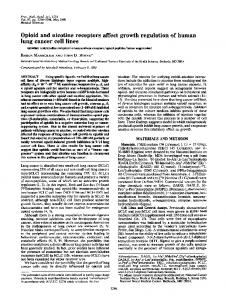
FIG. 2. NPS RP-HPLC separation of one CF fraction. Ovarian cancer serous cell line DOV13 pI fraction 4.85–5.00 was separated by NPS RP-HPLC. au, absorbance units.
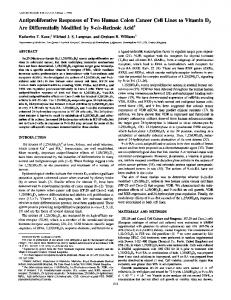
FIG. 1. A close up of a portion of the 2-D liquid protein expression map of the ovarian cancer serous cell line HOC-1 whole cell lysate. Ovarian cancer serous cell line HOC-1 was separated using chromatofocusing over a pH range of 4.11– 8.32 with 0.15 pH intervals followed by separation in the second dimension using NPS RP-HPLC. The x axis is pI of the chromatofocusing, and the y axis is hydrophobicity of the RP-HPLC. The scale of the bands represents the relative intensity of each band by UV detection at 214 nm.
to well differentiated adenocarcinomas (25). Analysis of Ovarian Cancer Proteomes—The primary objective of this study was to classify large numbers of samples by mapping and comparing 2-D liquid maps generated with UV detection so that we can obtain basic information on the similarities and differences among ovarian cancer cell lines. OSE and serous carcinoma-derived cell lines were fractionated using chromatofocusing at 0.15 pI intervals. Each of these fractions was automatically collected and continuously injected into the second dimension column using NPS RPHPLC. The result is a virtual 2-D UV map profile that displays the pI versus hydrophobicity of the protein expression for the whole cell lysate. Protein detection in the first dimension step is performed using UV absorption at 280 nm and 214 nm in the second dimension. As an example, the profile of serous carcinoma HOC-1 is shown in Fig. 1. In Fig. 1, ⬃4.0 mg or 2.0 ⫻107 cells were loaded onto the first dimension chromatofocusing column. In this figure, each lane corresponds to a different pI value, and the bands correspond to the hydrophobicity as generated by the percentage of acetonitrile on the HPLC gradient at that pI. For each map, a total of 28 pI fractions have been mapped that correspond to a pH range of 4.11– 8.32. The more acidic and basic fractions are not shown here because few proteins were detected. Many of the RPHPLC fractions obtained after chromatofocusing contained as many as 60 –100 proteins. As a representative example the different proteins separated by NPS RP-HPLC from the pI fraction 4.85–5.00 of sample DOV13 are shown in Fig. 2. It is estimated that each sample was fractionated into over 1500 protein bands using the 2-D liquid mapping method. In each of the samples used to generate the 2-D UV map, the protein content was determined by the Bio-Rad protein
FIG. 3. Reproducibility study of 2-D liquid separation. A, chromatofocusing was run three separate times on IOSE-144 sample (the total amount of sample was 3.5, 4.0, and 4.5 mg) where the protein content of the IOSE-144 cell lines was detected by UV absorption at 280 nm. B, the second dimension was run continuously by NPS RP-HPLC for each CF separation. One lane has been shown. UV absorption is 214 nm. au, absorbance units.
assay. Equal amounts of protein were loaded onto the first dimension chromatofocusing column so that a quantitative comparison could be obtained. The UV patterns of ovarian cancer proteins were highly reproducible within each cell line. The CF reproducibility is shown in Fig. 3a where sample IOSE-144 was run by CF three separate times. In each case different amounts of sample were loaded onto the CF column (3.5, 4.0, and 4.5 mg, respectively). The second dimension
Molecular & Cellular Proteomics 5.1
47
Classification of Cancer Cell Lines Using 2-D Liquid Mapping
FIG. 4. Alignment analysis. Shown are superimposed sections of the chromatographic trace at 214 nm from NPS RP-HPLC analysis of two serous samples, HEY and PEO1 fraction pI 4.55– 4.70, gradient range from 41.5 to 49.5%. A, prior to aligning. B, after stretching of the entire profile.
hydrophobicity profiles reproducibility is highlighted for one of the pI lanes from the total expression profile and is shown in Fig. 3b. These results show that the chromatogram of the band patterns and retention times in both the first dimension chromatofocusing separation and the second dimension reversed-phase liquid separation are very similar. This was found to be the case in all the pI lanes separated for all samples (data not shown). The 2-D liquid mapping protocol allows the production of highly reproducible differential maps where hundreds of proteins can be compared by computer analysis for a large number of samples. The digitized protein profile that resulted from our liquid separation was relatively reproducible from run to run for the same sample. Reproducible 2-D liquid separations with well resolved protein peaks are a prerequisite for the establishment of a reference map of the proteome of the ovarian
48
Molecular & Cellular Proteomics 5.1
serous carcinoma cell lines for interlysate comparisons. The overall resolution and reproducibility pattern of the 2-D separation was greatly improved by the automated system. This reproducibility makes it possible to compare different cell lines for large numbers of samples, which is essential for searching for biomarkers. The peak patterns for each pI fraction of each cell line were aligned using a dynamic programming technique. The samples were transformed for reasonable statistical analysis. The transform first subtracts the base line of the curve so that a flat base line at zero was obtained; next each point was taken as the natural log. A difference of 1 unit on the y axis corresponds to a roughly 2.7-fold difference in the UV readout. Two original data sets of samples HEY and PEO1, fraction pH 4.55– 4.70, gradient range from 41.5 to 49.5% are shown in Fig. 4A. The index of data pairs aligned together is used as x axis units,
Classification of Cancer Cell Lines Using 2-D Liquid Mapping
and the converted intensity of each peak as we described above is used as y axis units. The data sets that were aligned using this method are shown in Fig. 4B. It is seen that the two traces are not well aligned originally, but after stretching of the profile, the alignment is much improved. The chromatographic profiles are properly aligned to compensate for minor drifts in retention times. These small retention time shifts may be due to changes in the columns during use, minor changes in mobile phase composition, drift in the instrument, interaction between analytes, etc. This alignment technique compensates for these drifts and allows comparisons of protein bands in different cell lines for large numbers of samples. To compare the overall pattern of protein expression in the samples, after each pair was aligned separately a correlation matrix was formed by calculating the Pearson correlation coefficient between each aligned pair of samples. These correlation matrices were then visualized using hierarchical clustering techniques. Here we used three different cluster analyses: “single linkage,” “complete linkage,” and “average linkage” hierarchical clustering (www.ucl.ac.uk/oncology/MicroCore/HTML_resource/Hier_Linkage.htm). Differences between these three methods arise because of the different ways of defining distance (or similarity) between clusters. Single linkage is also known as the nearest neighbor technique where the distance between groups is defined as the distance between the closest pair of objects, and only pairs consisting of one object from each group are considered. The complete linkage involves the farthest neighbor where the clustering method is the opposite of single linkage-distance between groups is defined as the distance between the most distant pair of objects, one from each group. For average linkage, the distance between two clusters is defined as the average of distances between all pairs of objects where each pair is made up of one object from each group. All the fractions, from pH 8.32 to pH 4.11, were analyzed by these three different methods. Total results are obtained by the average of all the fractions and are shown in Fig. 5, A, B, and C. In the dendrograms, the length and the subdivision of the branches display the relatedness of the cell lines and the expression of the proteins. The dendrograms in Fig. 5 show the relationship of the different serous carcinoma cell lines based upon their protein expression using the 2-D liquid mapping technique. To evaluate the method, we analyzed two sets of samples, IOSE144-1 and IOSE-144-2. It was found that, using these three different clustering methods, OSE cell lines IOSE-144 and HOSE-A clustered together (Fig. 5), whereas the two IOSE144 samples clustered together most closely as expected. In addition, several serous carcinoma cell lines clustered with each other, i.e. DOV13, OVCA429, and OVCA433 clustered together. It is interesting that IOSE-80, which was derived from OSE, clustered with serous carcinoma lines HEY and PEO1. Indeed IOSE-80 appeared to be strongly linked to PEO1 throughout the pI fractions of the 2-D maps. This is not
FIG. 5. Hierarchical clustering analysis. Cell lines are aligned separately and grouped based on similarities in their protein expression using a hierarchical clustering analysis technique. This technique produces a dendrogram in which pairs of points are joined sooner (i.e. closer to the ends of the dendrogram) if they have greater correlation. A, complete linkage. B, single linkage. C, average linkage.
FIG. 6. Protein expression maps for a given pH fraction. Shown is fraction pI 4.55– 4.70, gradient range from 30.0 to 78.0%. The relative intensities of the bands are quantitatively proportional to the amount of protein detected by UV absorption.
surprising because the IOSE-80 cell line has been cultured for many passages and may have obtained some of the characteristics of the carcinoma-derived lines. Although limited information is available on the cell lines, it was shown that the protein expression of certain cell lines is closely related to others and that these cluster together on the dendrogram. To show the relationship between some of these cell lines that cluster together, the corresponding protein expression maps for a given pH fraction are shown in Fig. 6. In the fractions that cluster together a number of protein bands are common to the different cell lines that define this relationship. In addition to the serous carcinoma cell lines, several other ovarian and breast tumor cell lines were mapped by the 2-D liquid method. It is interesting to note that ES-2, MDAH-2774, and TOV-112D clustered closely together. This is not unexpected given the detailed 2-D mapping of proteins in previous
Molecular & Cellular Proteomics 5.1
49
Classification of Cancer Cell Lines Using 2-D Liquid Mapping
work (17, 26) where the ES-2 clear cell line and MDAH-2774 were found to have many bands in common between them and in more recent work3 where TOV-112D was found to be somewhat similar also. Other interesting clusters include those from the MCF10 breast epithelial cell lines. CA1d and CA1a are related highly malignant breast cancer lines derived from xenografts of AT1 and clustered together as expected. In addition, AT1, which is a premalignant breast epithelial cell line also derived from MCF10, clustered closely with the other breast cancer cell lines as expected. To quantify differences between the immortalized OSE lines (IOSE-144 and HOSE-A), ovarian carcinoma-derived lines (ES-2, MDAH-2774, and TOV-112D), and breast epithelial (AT1, CA1a, and CA1d) cell line groups, the pairwise correlation coefficients were calculated using normalized data between 24 pI ranges that were aligned separately for each pair of samples, and the Pearson correlation coefficients were calculated between the resulting aligned values. These were averaged for all distinct sample pairs within each of these three groups to produce a single within-group correlation coefficient for each group. Similarly for every pair among these groups, correlation coefficients for every pair of samples spanning the two groups were averaged to produce a single between-group average correlation coefficient. These within-group and between-group correlation coefficients were prepared separately for each fraction and also averaged across the fractions to provide an overall summary. It is interesting that the actual correlation numbers are such that correlation between the breast and ovarian clusters is greater than that of the ovarian carcinoma and OSE clusters, which in turn is greater than that of the breast and OSE clusters as represented in the dendrograms. It would be expected that the breast cancer and OSE clusters would have the lowest correlation. There is some information on the molecular relationship of these cell lines based upon gene expression profiles in prior work (4).4 There are some similarities in terms of the cell lines that clustered together compared with the protein mapping but also very distinct differences. ISOE-144, IOSE-80, and HOSE-A clustered together by gene expression, but IOSE-80 distinctly did not cluster with these lines in the protein maps. Based on the mRNA expression data, ES-2 clear cell line clustered with the OSE samples, whereas MDAH-2774 did not cluster with ES-2 or TOV-112D but rather with the serous carcinoma cell lines. TOV-112D appeared to cluster by itself in the gene expression arrays, whereas in the protein maps it clearly clustered with MDAH-2774 and ES-2. HEY and ES-2 were found to cluster in the gene expression data (4),4 but HEY clustered with PEO1 in the protein expression data; this makes sense because these are both serous carcinomas. OVCA429 and OVCA433 were closely clustered by gene ex3
D. M. Lubman and H. Kim, unpublished results. K. R. Cho, K. A. Shedden, D. R. Schwartz, and R. Wu, unpublished results. 4
50
Molecular & Cellular Proteomics 5.1
FIG. 7. Differential analysis. Shown is fraction pI 7.57–7.72, gradient range from 30.8 to 67.0%. The relative intensities of the bands are quantitatively proportional to the amount of protein detected by UV absorption. Circled areas are differentially expressed bands between two groups of samples.
pression as in the case of the protein mapping, and OVCA432 was reasonably closely linked in both cases. OVCA420 was not closely linked to the OSE cell lines as in the protein expression maps. Nevertheless it is not surprising that the gene expression and protein expression clusters provided different information because in prior work (26) it was found that the gene expression and protein expression for several cell lines had a poor correlation. Such poor correlation has been observed in other studies (27) and is due to the fact that many of the mRNA messages do not translate into proteins (28) or the proteins produced are short lived or misfolded and rapidly degraded (29). Ultimately, however, it is the protein expression that determines the function of the cell so that the relationships as determined by protein mapping will be essential for searching for distinctive markers of cancer. An important capability of the 2-D mapping technique is the use of proteomic patterns for classification using common marker bands in the comparison of different clusters of cell lines. The peak retention time and intensity for each band can be obtained using the Beckman software. As an example the average number of peaks for 11 samples for fraction pI 7.57– 7.72 is 67. Based on the protein expression map, proteins can be classified into three groups. One group of proteins is likely to be common to most cell types. For this fraction, we found 12 proteins of all cells have the same retention time and are likely to be the same. A second set of proteins appears to be linked to one group of cell lines only. This set may provide the basis for detection and classification of serous carcinoma and have the potential to provide identifying biomarkers. A third group of proteins appears to be expressed uniquely on each individual cell line. It is possible to hypothesize that this third group of proteins is responsible for unique aspects of cell behavior. To identify markers of groups of serous carcinoma cell lines, standardization and alignment of bands were performed, and then comparisons were made separately at each hydrophobicity level between two groups of samples. A differentially expressed band is selected on the basis of having at least a 4-fold different mean level within the two groups of samples. In addition, at least 25 consecutive hydrophobicity
Classification of Cancer Cell Lines Using 2-D Liquid Mapping
levels were required to meet these conditions for the band to be considered as a marker. Fig. 7 shows peak patterns for two cluster samples: one group as OVCA429, OVCA433, and DOV13 and the other group as IOSE-80, PEO1, and HEY. The image is displayed in a format with each different sample on the x axis and hydrophobicity on the y axis. The relative intensities of the band are quantitatively proportional to the amount of corresponding protein detected by UV absorption. The three groups of bands are only observed in the group of IOSE-80, PEO1, and HEY but not in the group of OVCA433, OVCA429, and DOV13. The use of differential analysis allows us to identify proteins that may be common bands for classification and limits the number of proteins that might require further analysis by mass spectrometric techniques. Conclusion—The use of the 2-D liquid mapping serves as a powerful tool for comparing the protein expression profiles of large numbers of samples. It provides an automated method for reproducibly running samples for interlysate comparisons. This strategy provides a means for comparing the profiles of different samples and classifying them according to the protein bands observed in their expression maps. This method has been used to classify a number of serous carcinoma cell lines compared with OSE lines and also several ovarian clear cell and endometrioid and breast epithelial cell lines. The results show that in most cases the serous carcinoma clustered within several groups, whereas the breast cancer and other ovarian cell lines clustered separately. The method provides a means to search for markers that may serve to classify a specific set of cancers. It also reduces the potentially large amounts of protein expression data from a large number of samples into a manageable data set. It thus reduces the number of significant bands that need to be identified by mass spectrometry or other methods. Acknowledgment—We thank Beckman Coulter, Inc. for the use of the PF 2D instrument. * This work was supported in part by NCI, National Institutes of Health Grants R01CA10010 (to D. M. L. and K. R. C.) and R01CA90503 (to D. M. L.) and National Institutes of Health Grant R01GM49500 (to D. M. L.). Support was also generously provided by Eprogen, Inc. The costs of publication of this article were defrayed in part by the payment of page charges. This article must therefore be hereby marked “advertisement” in accordance with 18 U.S.C. Section 1734 solely to indicate this fact. §§ To whom correspondence should be addressed: Dept. of Chemistry, The University of Michigan, Ann Arbor, MI 48109-1055. Tel.: 734-764-1669; Fax: 734-615-8108; E-mail: dmlubman@umich. edu. REFERENCES 1. Golub, T. R., Slonim, D. K., Tamayo, P., Huard, C., Gaasenbeek, M., Mesirov, J. P., Coller, H., Loh, M. L., Downing, J. R., Caligiuri, M. A., Bloomfield, C. D., and Lander, E. S. (1999) Molecular classification of cancer: class discovery and class prediction by gene expression monitoring. Science 286, 531–537 2. Alaiya, A. A., Franzen, B., Auer, G., and Linder, S. (2000) Cancer proteomics: from identification of novel markers to creation of artificial learning models for tumor classification. Electrophoresis 21, 1210 –1217
3. Giordano, T. J., Shedden, K. A., Schwartz, D. R., Kuick, R., Taylor, J. M. G., Lee, N., Misek, D. E., Greenson, J. K., Kardia, S. L. R., Beer, D. G., Rennert, G., Cho, K. R., Gruber, S. B., Fearon, E. R., and Hanash, S. (2001) Organ-specific molecular classification of primary lung, colon, and ovarian adenocarcinomas using gene expression profiles. Am. J. Pathol. 159, 1231–1238 4. Schaner, M. E., Ross, D. T., Ciaravino, G., Sorlie, T., Troyanskaya, O., Diehn, M., Wang, Y. C., Duran, G. E., Sikic, T. L., Caldeira, S., Skomedal, H., Tu, I. P., Hernandez-Boussard, T., Johnson, S. W., O’Dwyer, P. J., Fero, M. J., Kristensen, G. B., Borresen-Dale, A. L., Hastie, T., Tibshirani, R., van de Rijn, M., Teng, N. N., Longacre, T. A., Botstein, D., Brown, P. O., and Sikic, B. I. (2003) Gene expression patterns in ovarian carcinomas. Mol. Biol. Cell 14, 4376 – 4386 5. Schwartz, D. R., Kardia, S. L. R., Shedden, K. A., Kuick, R., Michailidis, G., Taylor, J. M. G., Misek, D. E., Wu, R., Zhai, Y. L., Darrah, D. M., Reed, H., Ellenson, L. H., Giordano, T. J., Fearon, E. R., Hanash, S. M., and Cho, K. R. (2002) Gene expression in ovarian cancer reflects both morphology and biological behavior, distinguishing clear cell from other poor-prognosis ovarian carcinomas. Cancer Res. 62, 4722– 4729 6. Alaiya, A. A., Franzen, B., Hagman, A., Dysvik, B., Roblick, U. J., Becker, S., Moberger, B., Auer, G., and Linder, S. (2002) Molecular classification of borderline ovarian tumors using hierarchical cluster analysis of protein expression profiles. Int. J. Cancer 98, 895– 899 7. Jones, M. B., Krutzsch, H., Shu, H. J., Zhao, Y. M., Liotta, L. A., Kohn, E. C., and Petricoin, E. F. (2002) Proteomic analysis and identification of new biomarkers and therapeutic targets for invasive ovarian cancer. Proteomics 2, 76 – 84 8. Perou, C. M., Sorlie, T., Eisen, M. B., van de Rijn, M., Jeffrey, S. S., Rees, C. A., Pollack, J. R., Ross, D. T., Johnsen, H., Aksien, L. A., Fluge, O., Pergamenschikov, A., Williams, C., Zhu, S. X., Lonning, P. E., BorresenDale, A. L., Brown, P. O., and Botstein, D. (2000) Molecular portraits of human breast tumours. Nature 406, 747–752 9. Sorlie, T., Perou, C. M., Tibshirani, R., Aas, T., Geisler, S., Johnsen, H., Hastie, T., Eisen, M. B., van de Rijn, M., Jeffrey, S. S., Thorsen, T., Quist, H., Matese, J. C., Brown, P. O., Botstein, D., Lonning, P. E., and Borresen-Dale, A. L. (2001) Gene expression patterns of breast carcinomas distinguish tumor subclasses with clinical implications. Proc. Natl. Acad. Sci. U. S. A. 98, 10869 –10874 10. Korshunov, A., Neben, K., Wrobel, G., Tews, B., Benner, A., Hahn, M., Golanov, A., and Lichter, P. (2003) Gene expression patterns in ependymomas correlate with tumor location, grade, and patient age. Am. J. Pathol. 163, 1721–1727 11. Tan, Y. X., Shi, L. B., Tong, W. D., Hwang, G. T. G., and Wang, C. (2004) Multi-class tumor classification by discriminant partial least squares using microarray gene expression data and assessment of classification models. Comput. Biol. Chem. 28, 235–244 12. Ross, D. T., Scherf, U., Eisen, M. B., Perou, C. M., Rees, C., Spellman, P., Iyer, V., Jeffrey, S. S., Van de Rijn, M., Waltham, M., Pergamenschikov, A., Lee, J. C. E., Lashkari, D., Shalon, D., Myers, T. G., Weinstein, J. N., Botstein, D., and Brown, P. O. (2000) Systematic variation in gene expression patterns in human cancer cell lines. Nat. Genet. 24, 227–235 13. Yanagisawa, K., Shyr, Y., Xu, B. J., Massion, P. P., Larsen, P. H., White, B. C., Roberts, J. R., Edgerton, M., Gonzalez, A., Nadaf, S., Moore, J. H., Caprioli, R. M., and Carbone, D. P. (2003) Proteomic patterns of tumour subsets in non-small-cell lung cancer. Lancet 362, 433– 439 14. Gorg, A., Obermaier, C., Boguth, G., Harder, A., Scheibe, B., Wildgruber, R., and Weiss, W. (2000) The current state of two-dimensional electrophoresis with immobilized pH gradients. Electrophoresis 21, 1037–1053 15. Alaiya, A. A., Franzen, B., Fujioka, K., Moberger, B., Schedvins, K., Silversvard, C., Linder, S., and Auer, G. (1997) Phenotypic analysis of ovarian carcinoma: polypeptide expression in benign, borderline and malignant tumors. Int. J. Cancer 73, 678 – 683 16. Zhu, K., Zhao, J., Lubman, D. M., Miller, F. R., and Barder, T. J. (2005) Protein pI shifts due to posttranslational modifications in the separation and characterization of proteins. Anal. Chem. 77, 2745–2755 17. Kachman, M. T., Wang, H. X., Schwartz, D. R., Cho, K. R., and Lubman, D. M. (2002) A 2-D liquid separations/mass mapping method for interlysate comparison of ovarian cancers. Anal. Chem. 74, 1779 –1791 18. Zhu, K., Kim, J., Yoo, C., Miller, F. R., and Lubman, D. M. (2003) High sequence coverage of proteins isolated from liquid separations of breast cancer cells using capillary electrophoresis-time-of-flight MS and
Molecular & Cellular Proteomics 5.1
51
Classification of Cancer Cell Lines Using 2-D Liquid Mapping
MALDI-TOF MS mapping. Anal. Chem. 75, 6209 – 6217 19. Buick, R. N., Pullano, R., and Trent, J. M. (1985) Comparative properties of five human ovarian adenocarcinoma cell lines. Cancer Res. 45, 3668 –3676 20. Langdon, S. P., Lawrie, S. S., Hay, F. G., Hawkes, M. M., McDonald, A., Hayward, I. P., Schol, D. J., Hilgers, J., Leonard, R. C., and Smyth, J. F. (1988) Characterization and properties of nine human ovarian adenocarcinoma cell-lines. Cancer Res. 48, 6166 – 6172 21. Kim, J. H., Skates, S. J., Uede, T., Wong, K. K., Schorge, J. O., Feltmate, C. M., Berkowitz, R. S., Cramer, D. W., and Mok, S. C. (2002) Osteopontin as a potential diagnostic biomarker for ovarian cancer. J. Am. Med. Assoc. 287, 1671–1679 22. Freedman, R. S., Pihl, E., Kusyk, C., Gallager, H. S., and Rutledge, F. (1978) Characterization of an ovarian carcinoma cell line. Cancer 42, 2352–2359 23. Provencher, D. M., Lounis, H., Champoux, L., Tetrault, M., Manderson, E. N., Wang, J. C., Eydoux, P., Savoie, R., Tonin, P. N., and Mes-Masson, A. M. (2000) Characterization of four novel epithelial ovarian cancer cell lines. In Vitro Cell Dev. Biol. Anim. 36, 357–361 24. Soule, H. D., Maloney, T. M., Wolman, S. R., Peterson, W. D., Brenz, R., McGrath, C. M., Russo, J., Pauley, R. J., Jones, R. F., and Brooks, S. C. (1990) Isolation and characterization of a spontaneously immortalized
52
Molecular & Cellular Proteomics 5.1
human breast epithelial-cell line, Mcf-10. Cancer Res. 50, 6075– 6086 25. Santner, S. J., Dawson, P. J., Tait, L., Soule, H. D., Eliason, J., Mohamed, A. N., Wolman, S. R., Heppner, G. H., and Miller, F. R. (2001) Malignant MCF10CA1 cell lines derived from premalignant human breast epithelial MCF10AT cells. Breast Cancer Res. Treat. 65, 101–110 26. Wang, H. X., Kachman, M. T., Schwartz, D. R., Cho, K. R., and Lubman, D. M. (2004) Comprehensive proteome analysis of ovarian cancers using liquid phase separation, mass mapping and tandem mass spectrometry: a strategy for identification of candidate cancer biomarkers. Proteomics 4, 2476 –2495 27. Gygi, S. P., Rochon, Y., Franza, B. R., and Aebersold, R. (1999) Correlation between protein and mRNA abundance in yeast. Mol. Cell. Biol. 19, 1720 –1730 28. Woodman, A. C., Sugiyama, M., Yoshida, K., Sugino, T., Borgya, A., Goodison, S., Matsumura, Y., and Tarin, D. (1996) Analysis of anomalous CD44 gene expression in human breast, bladder, and colon cancer and correlation of observed mRNA and protein isoforms. Am. J. Pathol. 149, 1519 –1530 29. Yewdell, J. W., Anton, L. C., and Bennink, J. R. (1996) Defective ribosomal products (DRiPs)—a major source of antigenic peptides for MHC class I molecules? J. Immunol. 157, 1823–1826