Automated cell phenotype image classification combining different methods
Loris Nanni1 Chun-Nan Hsu2 Alessandra Lumini1 Yu-Shi Lin2 Chung-Chih Lin2
[email protected] [email protected] [email protected] [email protected]
1
Department of Electronic, Informatics and Systems (DEIS), Università di Bologna, Via Venezia 52, 47023 Cesena, Italy. 2 Institute of Information Science, Academia Sinica, Taipei, Taiwan. Keywords: cell phenotype image classification; subcellular location; machine learning techniques; ensemble of neural networks; AdaBoost.
Abstract In this paper our aim is to study how an ensemble of classifiers can improve the performance of a machine learning technique for cell phenotype image classification. We want to point out some of the advantages that an ensemble of classifiers permits to obtain respect a stand-alone method. Finally, the preliminary results on the 2D-HeLa dataset, obtained by the fusion between a random subspace of Levenberg-Marquardt neural networks and a variant of the AdaBoost, are reported. It is interesting to note that the proposed system obtains an outstanding 97.5% Rank-1 accuracy and a >99% Rank-2 accuracy.
1. Introduction (Peng, 2008) has defined as “bio-image informatics” all the bioinformatics applications and problems where the aim is to extract biological information from image data. The automated cell phenotype image classification problem is an interesting “bio-image informatics” application. It can be used for establishing knowledge of the spatial distribution of proteins within living cells. It is a very useful tool since it permits to screen systems for drug discovery or for early diagnosis of a disease. In the last years several methods that achieve an accuracy >90% are proposed, e.g. (Nanni & Lumini,
2008; Lin et al., 2007), which is higher than the performance of an human expert. The main part of the proposed approaches are based on the use of image statistics (Chebira et al., 2008) for extracting a feature vector from an input image and a general purpose classifier for the classification step. Recently, to improve the performance some authors proposed to combine different set of features (Hamilton et al., 2007; Nanni & Lumini, 2008; Lin et al., 2007). Another proposed method for improving the performance is to use ensemble of classifiers instead of a stand-alone method (Lin et al., 2007; Chebira et al., 2007). In particular in (Chebira et al., 2007) a multiresolution approach is proposed and it gains a very high accuracy rate (95%) in the 2D HeLa dataset.
2. Machine Learning classifiers
and
ensemble
of
A very important subset of the Pattern Recognition techniques is the Machine learning, in those methods the parameters of a given approach are learned from a given dataset, named training set. Notice that if the learning is performed when the labels of the patterns that belong to the training set are known it is called supervised learning (Duda et al., 2000). While when the learning is performed in a unlabelled dataset it is called unsupervised learning. In the unsupervised learning the aim is to find a good partition of the dataset, e.g. according a clustering algorithm, where each partition contain patterns with similar characteristics. A generic architecture of a Pattern Recognition System may be defined in five steps, as reported in Figure 1.
————— Preliminary work. Under review by the International Conference on Machine Learning (ICML). Do not distribute.
1
Data Collection (input is obtained by a sensor, etc)
Pre-Processing (noise filtering, illumination normalization, etc)
Feature Extraction (identify the characteristics of the patterns)
Classification (classify the data)
Post-Processing (e.g. normalization of the scores)
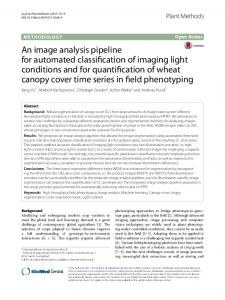
Figure 1. Generic architecture of a Pattern Recognition System. The main problem with supervised learning when few examples of the same class (e.g. few images of the same class) are available is that the error rate in the test set is higher than the training error. If enough samples are available it is possible to extract from the training set a validation set and to use the validation set to find the parameters of a given method. In Figure 2 we plot the average error rate of the training set, of the test set and of the validation set.
The main general methods (a good survey for ensemble of classifier in bioinformatics is (Nanni & Lumini, 2009a)) for building an ensemble of classifiers are: • Patterns perturbation, i.e. each different classifier is trained with a different set of training patterns. The most well-known methods based on pattern perturbation are Bagging and Boosting. In Bagging each base classifier is trained using a different bootstrap replicate, while in Boosting the classifiers are constructed iteratively considering the performance of the previous set of classifiers. • Features perturbation, i.e. each different classifier is trained with a different set of features. A well know feature perturbation method is the Random Subspace Method (RS) (Ho, 1998). In RS each classifier is trained using a randomly selected feature subset. • Parameters perturbation, i.e. each different classifier is trained with a different set of classifier's parameters. To combine a set of classifiers several different combination strategies have been proposed (Kittler et al., 1998). One of the most used is the sum rule (used also in this paper), it consists in summing the scores provided by the different classifiers.
3. Texture descriptors
Figure 2. The learning curves show the average error rate. From: Richard O. Duda, Peter E. Hart, and David G. Stork, Pattern Classification. Copyright 2001 by John Wiley & Sons, Inc. From the machine learning point of view, we can answer to the question “What is Learning?” as a method for changing the structures of the program to maximize (or minimize) a given objective function. A simple example is the back-propagation neural network that modify its parameters to minimize the errors obtained considering the training patterns. In the Pattern Recognition literature there is a huge number of works that show that ensembles of classifiers enhance the performance of a stand-alone method.
The texture descriptors are used to describe each image with a vector, the “ideal” descriptor should be invariant to image scale, image rotation and robust to changes in illumination. In the literature two different types of descriptors have been proposed and tested (Nanni & Lumini, 2008b): • global descriptors, the features are extracted from the whole image • local descriptors, the features are extracted separately considering local regions. In the following sub-sections, the used descriptors are briefly presented (for a more detailed review see (Nanni & Lumini, 2009) or (Nanni et al., 2009b)). 3.1 Invariant Local Binary Patterns (LBP) LBP is calculated considering the joint distribution of grey values of a circularly symmetric neighbor set of P pixels, of a pixel c, on a circle of radius R. In this paper, LBP is used as local descriptors (see (Nanni & Lumini, 2008) for more details). Here we concatenate the features extracted considering different parameters configurations: (P=8; R=1), (P=16; R=2), (P=24; R=3).
2
3.2 Threshold adjacency statistics (TAS) Threshold adjacency statistics (TAS) has been proposed by (Hamilton et al., 2007). The features are obtained by calculating three 9-bin histograms, starting from three different binary images, considering the number of adjacent white pixels for each white pixel in the binary image. Each binary image is built using a different threshold. In this paper, TAS is used as global descriptors. 3.3 Haralick texture features (HAR) This set of features is calculated by extracting 13 statistical measures (i.e. energy, correlation, inertia, entropy, inverse difference moment, sum average, sum variance, sum entropy, difference average, difference variance, difference entropy and two information measures of correlation) from the Spatial Grey Level Dependence Matrices (SGLD). Each element (i,j) of the SGLD matrices is calculated considering the probability that two pixels with a specified distance d have grey levels i and j along the direction θ. In this work, θ∈ {0,45°,90°,135°} and d=1. In this paper, HAR is used as local descriptors. 3.4 Edge features (EDGE) These features (ranging from SLF1.9 to SLF1.13 of the Subcellular Location Features descriptors of the Murphy’s research group) are calculated from the binary image of the cell ITH (obtained by thresholding) and its edge image IED (obtained by the Canny method). In this paper, EDGE is used as global descriptors. 3.5 Wavelet features (WAVE) We have used the Coiflets wavelet transform to extract a set of 30 features. These features include the average energy, square root of the sum of the square of each element of the three high-frequency components (i.e. horizontal, vertical and diagonal) calculated up to the 10th level decomposition. In this paper, WAVE is used as global descriptors.
4. Experimental Results In this work, we train a random subspace, each of the 100 subspaces contain a subset of the 66% of the original features, of Levenberg-Marquardt neural networks (Dude et al., 2000) and the variant of the AdaBoost (named AdaBoost.ERC) used in (Lin et al., 2007). The training is performed using the 142 features obtained by the concatenation of the five descriptors reported in Section 3 (LBP, HAR, TAS, EDGE, WAVE) and the 180 features proposed from Murphy's Lab for
2D HeLa experiments 1 . In this way, each method is trained using a set of 322 features. The dataset used for evaluating the system proposed in this paper is the 2D HeLa dataset (Chebira et al., 2007). It is composed of 862 single-cell images; this dataset is available for download from http://murphylab.web.cmu.edu/. All the experimental results have been obtained using a 10-fold cross validation. Moreover, in order to deal with the inherent non-uniform lighting present in cell images, some of the descriptors are extracted from an enhanced version of the image, obtained by applying the contrast limited adaptive histogram equalization. As a performance indicator, the Rank k recognition accuracy is used. It is the ratio of testing images for which the correct class is found in the top k ranked candidate classes. This indicator is also used in (Nanni et al., 2009b). In Table 1 the Rank k recognition accuracies obtained by a Random subspace of LMNC (RS-LM), by an AdaBoost.ERC (A-ERC), and by the fusion with the sum rule (named FUS) between a Random subspace of LMNC and an AdaBoost.ERC are reported. Table 1. Performance of the tested systems. RS-LM A-ERC FUS Rank-1
96.6%
96.5%
97.5%
Rank-2
99.2%
99.1%
99.4%
It is clear from Table 1 that the proposed ensemble outperforms several state-of-the-art methods as (Chebira et al., 2007; Hamilton et al., 2007; Nanni & Lumini, 2008; Nanni & Lumini, 2009), where the rank1 is always lower than 96%.As a further experiment, we investigated the complementarities among the three best performing texture descriptors (i.e. LBP, TAS, HAR). For simplicity, we use only the random subspace of Levenberg-Marquardt neural networks. In Table 2 we report the error independence, considering the Yule’s Q-statistic (Kuncheva & Whitaker, 2003), between the classifiers trained using those features. The Q-statistic is defined as: Q=[N11 N00- N01 N10]/[ N11 N00+ N01 N10] where Nab is the number of instances in the test set, classified correctly (a=1) or incorrectly (a=0) by the first classifier, and correctly (b=1) or incorrectly (b=0) by the latter classifier. Q varies between –1 and 1; Q = 0 for statistically independent classifiers. Classifiers that tend to recognize the same patterns correctly will have Q>0, and those which commit errors on different patterns will have Q99% Rank-2 accuracy in the 2D-Hela dataset, which is the most used benchmark for comparing automated cell phenotype image classification approaches.
References Chebira A, Barbotin Y, Jackson C, Merryman T, Srinivasa G, Murphy RF, & Kovačević J. (2007). A multiresolution approach to automated classification of protein subcellular location images, BMC Bioinformatics, 8:210. Duda RO, Hart PE, Stork DG. (2000) Pattern Classification, Wiley, New York, 2nd edition. Hamilton N, Pantelic R, Hanson K, & Teasdale RD. (2007) Fast Automated Cell Phenotype Classification, BMC Bioinformatics, 8:110. Ho TK. (1998) The random subspace method for constructing decision forests, IEEE Transactions on Pattern Analysis and Machine Intelligence, 20 (8) 832–844. Kuncheva LI. Whitaker C.J., (2003) Measures of Diversity in Classifier Ensembles and their Relationship with the ensemble accuracy, Machine Learning, 51, 181-207. Lin CC, Tsai Y-S, Lin Y-S, Chiu T-Y, Hsiung C-C, Lee M-I, Simpson JC, & Hsu C-N (2007), Boosting multiclass learning with repeating codes and weak detectors for protein subcellular localization, Bioinformatics, 23(24):3374–3381. Nanni L, & Lumini A (2008), A reliable method for cell phenotype image classification, Artificial Intelligence in Medicine, 43 (2) Pages 87-97. Nanni L, & Lumini A (2009), Ensemble of neural networks for automated cell phenotype image classification, Biomedical Image Analysis and Machine Learning Technologies: Applications and Techniques, chapter, to appear. Nanni L, & Lumini A. (2009a) Using ensemble of classifiers in Bioinformatics, in H. Peters and M. Vogel, Machine Learning Research Progress, Nova publisher. Nanni L, Lumini A, Lin YS, Hsu C-N, Lin CC (2009b) Fusion of systems for automated cell phenotype image classification, submitted to Expert system with applications. Peng, H. (2008). Bioimage Informatics: A New Area of Engineering Biology, Bioinformatics, 24(17), 18271836.
4