Journal of Physics: Conference Series
PAPER • OPEN ACCESS
Classification of Company Performance using Weighted Probabilistic Neural Network To cite this article: Hasbi Yasin et al 2018 J. Phys.: Conf. Ser. 1025 012095
View the article online for updates and enhancements.
This content was downloaded from IP address 181.214.181.56 on 30/05/2018 at 13:30
ISNPINSA-7 IOP Conf. Series: Journal of Physics: Conf. Series 1025 (2018) 1234567890 ‘’“” 012095
IOP Publishing doi:10.1088/1742-6596/1025/1/012095
Classification of Company Performance using Weighted Probabilistic Neural Network Hasbi Yasin1, Adi Waridi Basyiruddin Arifin1, Budi Warsito1 1
Department of Statistics, Faculty of Science and Mathematics, Diponegoro University Jl. Prof. Soedharto, SH, Tembalang, Semarang 50275, Indonesia E-mail:
[email protected] Abstract. Classification of company performance can be judged by looking at its financial status, whether good or bad state. Classification of company performance can be achieved by some approach, either parametric or non-parametric. Neural Network is one of non-parametric methods. One of Artificial Neural Network (ANN) models is Probabilistic Neural Network (PNN). PNN consists of four layers, i.e. input layer, pattern layer, addition layer, and output layer. The distance function used is the euclidean distance and each class share the same values as their weights. In this study used PNN that has been modified on the weighting process between the pattern layer and the addition layer by involving the calculation of the mahalanobis distance. This model is called the Weighted Probabilistic Neural Network (WPNN). The results show that the company's performance modeling with the WPNN model has a very high accuracy that reaches 100%.
1. Introduction Classification of company performance can be judged by looking at its financial status, whether poor or good state. A company can be said has a good state in term of financial when it can survive in any kind of economic conditions, by looking at its ability to fulfill its financial obligations, and carry out its operations constantly and maintain its continuity to expand its company from time being. In order to achieve that objective, its management or executive company are bound to confront many problems in technical section, administrative, or financial [1]. A financial report can be understood by many parties, when it has been analyzed and interpreted. Analyzing a financial report is an activity that designated to gather and interpret any kind of information from those reports for certain purpose. The output from that analyze will be used by its management for evaluate its performance and achievement then making policy in order to be a better company in the future. While for investors, they can use it for investment strategy and planning. For creditor purpose, it will affect their lending policy in the next period. In order to classified company performance whether it has a good finance or poor finance, can be measured and calculated by using Decree of the Ministry of Finance of the Republic of Indonesia No 740/KMK.00/1989 from its measure performance score attachment that has been revised in Decree of the Ministry of Finance of the Republic of Indonesia No 826/KMK.013/1992 where liquidity ratio, profitability ratio, and solvency ratio as its fundamental measurement. Classification of company performance can be conducted with some approach, either parametric or non-parametric. ANN is one of the non-parametric methods for classification. An artificial neural network is an information-processing system that has certain performance characteristics in common
Content from this work may be used under the terms of the Creative Commons Attribution 3.0 licence. Any further distribution of this work must maintain attribution to the author(s) and the title of the work, journal citation and DOI. Published under licence by IOP Publishing Ltd 1
ISNPINSA-7 IOP Conf. Series: Journal of Physics: Conf. Series 1025 (2018) 1234567890 ‘’“” 012095
IOP Publishing doi:10.1088/1742-6596/1025/1/012095
with biological neural networks [2]. Probabilistic Neural Network (PNN) is an ANN model for classifying purpose. PNN consists of four layers, i.e. input layer, pattern layer, addition layer, and output layer [3]. PNN is often being used for case of classifying due to able plotting every input into classification with quick processing and high accuracy more than any other ANN model[4]. Classic PNN is using euclidean distance and every class for classification is weighted with the same number of value [5]. Weighted Probabilistic Neural Network (WPNN) include weighting factors between the pattern layer and the summation layer of the conventional PNNs. The results show that modified PNN has improving the accuracy of classification [6].
2. Methodology 2.1. Analysis of Financial Statements In order to learn that a company’s financial health, whether in a good state level or the otherwise, financial report will be required. It can be achieved by comparing some financial ratios of the company itself from its income report and balance sheet report. With those comparison, we can learn its profitabilitiy, liquidity and solvency in certain times. Based on the Decree of the Ministry of Finance of the Republic of Indonesia No. 740/KMK.00/1989 and its attachment regarding the weight of performance that has been revised in No. 826/KMK.013/1992, judging the company performance comes into 3 ratios, the first one is profitability ratio with 75%, then liquidity ratio with 12.5% proportion, and lastly solvency ratio with 12.5% proportion. 2.2. Determination of The Company’s Financial Health Level Profitability ratio, liquidity ratio, and solvency ratio can be used to determine the company’s financial health level, which based on Decree of the Ministry of Finance of the Republic of Indonesia No. 826/KMK.013/1992. The calculation result will deterimine the company’s financial health levels, that are: a. Very good is when the company earned more than 110 score for its performance in recent year b. Good is when the company earned between more than 100 to and less than equal to 110 score for its performance in recent year c. Bad is when the company earned between more than 90 and less than equal to 100 score for its performance in recent year d. Very bad is when the company earned less than equal to 90 score for its performance in recent year In this study, the determination of company’s financial health level are divided into 2 levels, which is: 1. Good state is when a company that earned more than 100 score for its performance in recent year. 2. Bad state is when a company that earned less than equal to 100 score for its performance in recent year. 2.3. Probabilistic Neural Network Probabilistic Neural Network (PNN) is a classification algorithm that uses probabilistic function, does not require large dataset in learning stage, and has an advantages that can overcome the problems that exist in Back-Propagation (BP), which is shorten the amount of time processing in training stage, and difficulties in designing network architecture [7]. However, the PNN’s problem lies in determining the smoothing parameter, which is no concrete way to define it, thus the value was obtained by trial and error until acquiring satisfaction result. The PNN is inspired from Bayesian classification and classical estimators for probability density functions.These operations take placeat four layers of the PNN. The first layer is an input layer, The number of neurons in this layer is equal to the number of parameters (variables) needed to describe the
2
ISNPINSA-7 IOP Conf. Series: Journal of Physics: Conf. Series 1025 (2018) 1234567890 ‘’“” 012095
IOP Publishing doi:10.1088/1742-6596/1025/1/012095
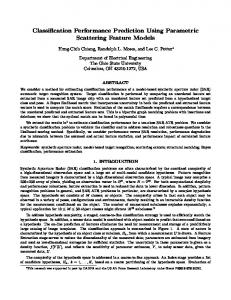
separable form input [8].The second layer contains nodes with activation functions. These nodes are called pattern units and are fully connected to the input nodes. There are as many pattern units as training samples. The feature values associated with each pattern unit are used as connection weights of that unit to the input layer nodes. The activation function that will be used is radial basis function [9], the formula is written below: = e−𝑛 , where n = neuron. The third layer contains summation units needed to complete the probability estimation. There are as many summation units as classes. Each summation unit receives input only from those pattern units belonging to its respective class. The last layer is the decision layer. The maximum of the summation node outputs is found in this layer. There are as many units as classes, each receiving input fromall summation units. Through a simple comparison, only the unit corresponding to the class with the highest summation unit value produces an output of one, while others generate a value of zero there by indicating the classification decision for the input vector [6]. Neuron A1
Neuron Neuron 12 A2
X1 X2
fAk(x)
. . . . . . . . . . . .
Neuron X1k1 An . . . . Neuron
Xh1
Define the classificatio n for fωk based on the maximum value of fωk(x)
B1
Xj
fBk(x)
Neuron B2 . . . .
Neuron Bi
Input Layer
Summation Layer
Pattern Layer
Output Layer
Figure 1. Structure of Probabilistic Neural Network Model 2.4. Weighted Probabilistic Neural Network Modified PNN, or WPNNs include weighting factors between the pattern layer and the summation layer of the conventional PNNs. The architecture of the WPNNs is shown in figure 2. TheWPNNs are three-layer feed forward networks including an input layer, a pattern layer and a summation layer [5]. This weighted value will getting higher for patterns with high class separation levels, and vice versa.
3
ISNPINSA-7 IOP Conf. Series: Journal of Physics: Conf. Series 1025 (2018) 1234567890 ‘’“” 012095
IOP Publishing doi:10.1088/1742-6596/1025/1/012095
X11
Neuron
A1
Neuron
XA12
PAk(x)
2
X1
. . . . Neuron
X2
. . . . . . . . . . . . . .
XA1n1 i
. .. . .. ..
. . . . Neuron
. . .
Xr1 B1
Xj
Define the classificati on for Pωk based on the maximum value of Pωk(x)
PBk(x)
Neuron X B2r2 . . . . Neuron
Xrnr Bi
Summation Layer
Pattern Layer
Input Layer
Output Layer
Figure 2. Structure of Weighted Probabilistic Neural Network Model 2.5. Classification Performance According to Prasetyo [11], in order to measure the performance of a classification, commonly is by using confusion matrix. Table 1 is a confusion matrix × that classifies binary problems. Every cell in the matrix, states the number record (data) of the class which predicted to join the class . For example, cell is the amount of data in class A correctly mapped to the class A, and cell is the data in class A which wrongly mapped to class B. Table 1. Confusion Matrix
×
Predicted Class Class = A Class = A Original Class Class = B
4
Class = B
ISNPINSA-7 IOP Conf. Series: Journal of Physics: Conf. Series 1025 (2018) 1234567890 ‘’“” 012095
IOP Publishing doi:10.1088/1742-6596/1025/1/012095
Based on the contents of confusion matrix, to find the amount of data of each class that predicted correctly, is by using this formula + , and incorrectly classified data, that is + . By knowing the number of these values,the accuracy of the predictions and the rate of error of prediction will be able to conducted: 1. Accuracy
=𝑓
2. Apparent Error Rate
=𝑓
𝑓 +𝑓 +𝑓 +𝑓 +𝑓
𝑓 +𝑓 +𝑓 +𝑓 +𝑓
3. WPNN’s Algorithm Let V as training dataset. WPNN’s testing algorithm is written below [9]: 1. Define X as matrix input with the size: × 𝑿=
⋱
[
]
X is the input data matrix with , where k represent as a number of data observation and j represent as a number of variable. 2. Set T as the target vector corresponding to the matrix V. 3. Initiation: Weight for input layer: V Weight for bias input layer:
=
Weight for output layer: W=T set
=
⋱
;
= [
ℎ
ℎ
√− ln .5 p a
, where
< spread ≤
]
[ ] ℎ Where V represent as matrix for training data where i represent as a number of observation and j represent as a number of variable. W is output matrix, where i represent as a number of observation and h represent as a number of class. 4. For k=1, for all data to be tested : a. Determined distance Xk to Vi, i=1, 2, …, n as follows: 𝑝
𝐷 = √∑
−
=
b. Determined the first activation function that is a1ki as follows: = − 𝑏𝑖𝐷𝑘𝑖 ; with i=1, 2, …, n. c. Calculated mahalanobis distance for each data to be tested as follows: = [𝑥 ⃗⃗⃗𝑖 − ⃗⃗ ]𝑇 𝑆 − [𝑥 ⃗⃗⃗𝑖 − ⃗⃗ ]; with i=1, 2, …, n. 𝑥 = Vector with jcomponent ⃗⃗ = Vector mean – average of the independent variable with j component − 𝑆 = Invers of variance matrix of the data being tested d. Determined second activation function namely a2kh as follows: 5
ISNPINSA-7 IOP Conf. Series: Journal of Physics: Conf. Series 1025 (2018) 1234567890 ‘’“” 012095
IOP Publishing doi:10.1088/1742-6596/1025/1/012095
= ∑𝑛= ℎ ; with ℎ = multiplication between mahalanobis distance to the vector target T corresponding to h=1, 2, …, r. e. Determined Z such that a2kz = max(a2kh| h=1, 2, …, r). f. Determined Z as the class of Xk. ℎ
4. Variables In this study, 140 Companies’s Annual Financial report from official website of Indonesia Stock Exchange was used for classification of company performance. There are 7 variables that have been obtained from the data, which consist of 6 independent variables and 1 dependent category variable. Those variables are: 1. Dependent Variable The dependent variable in this study is about financial status of company that divided into 2 categories, which is Good State or Bad State 2. Independent Variable 1. Working Capital to Total Asset Ratio (X1) 2. Earning Before Taxes Ratio (X2) 3. Total Asset Turnover Ratio (X3) 4. Debt to Asset Ratio (X4) 5. Long-term Debt to Asset Ratio (X5) 6. Return on Investment Ratio (X6) 5. Result and Discussion 5.1. Financial Health Status The description of the data shows the financial health status from 140 companies in Indonesia. Tabel 2 shows that only 35% or 49 companies was diagnosed in good state, while the rest, 65% or 91 companies in bad state. That’s why, a model that capable to classfying the status with high accuracy is necessary. Table 2. Description of Company’s Financial Status Company’s Performance
The number of companies
Percentage
Good
49
35%
Bad
91
65%
Total
140
100%
5.2. Classification of Financial Health Status Using WPNN Classification using WPNN was carried out for determining the optimum parameters, which is obtaining the highest classification rate. In other words, obtaining the minimum error by using Apparent Error Rate (APER) method.In the process of classfying with WPNN, the dataset was divided into 2 dataset, which is for training sample and testing sample. After several trial, for the optimum classification rate, in this dataset that consist 140 data observation, 90% of data (127 observation), was included into training sample, while the rest or 10% (13 observation) included into testing sample proportionally corresponding to the number of classification class. The next step is to defining the value of smoothing parameter (spread). In order to obtain the optimum value of spread, is by entering a series of number with interval from 0