Classification of gait patterns with self-organizing maps ... gait malfunctions by using self-organizing maps. The .... patterns to train the artificial neural network. .... of a self-organizing map. Proc Australian Conf on Neural Networks. Sydney.
Proc. of the 7th Australian Conference on Neural Networks (ACNN’96). Canberra. April 10-12. 1996.
Things we observed when watching people walk: Classification of gait patterns with self-organizing maps Monika Köhle and Dieter Merkl Institute of Software Technology, Vienna University of Technology Resselgasse 3/188, A-1040 Vienna, Austria {moni, dieter}@ifs.tuwien.ac.at Abstract. Clinical observation and the evaluation of the various locomotive patterns in human walk is the subject of gait analysis. We suggest a novel approach to gait pattern classification as a tool for subsequent medical diagnosis and therapy considerations. Based on data collected from patients at an rehabilitation centre we achieve a clustering according to various gait malfunctions by using self-organizing maps. The major benefit of such an approach is that the learning process ends up with a classification of gait malfunctions. Relying exclusively on observable data, we do not face the need of the tremendous effort to define a biomechanical model of gait. From a biomedical point of view, our study demonstrates that the collected data from ground reaction force measurement platforms actually contains relevant information to classify gait patterns.
1
Introduction
Clinical observation and the evaluation of the various locomotive patterns inherent in human walk is referred to as gait analysis. Gait analysis is used, on the one hand, to gather insight in the functional relationship of the parts comprising the human motor system aiming at a model of human gait. On the other hand, the clinical observations may be collected in order to support medical diagnosis and therapy considerations. One of the difficulties in gait analysis, at least apart from collecting relevant data, is the assessment of gait patterns. Assessment of “gait quality” is legitimately a controversial issue, not least because the definition of quality in gait is highly subjective and dependent on the context and target of assessment. Especially what concerns rehabilitation, the definition of an “ideal”
gait pattern could vary markedly with respect to different groups of patients. A patient with an artificial limb will definitely have to learn a different style of gait compared to a patient with calcaneus fracture. Thus, the definition of a generally usable gait quality parameter seems to be out of reach. We feel that employing biomechanically derived loads of joints or tendons in accomplishing this purpose [1], does not meet the actual requirements. Internal loads cannot be calculated precisely, and even knowing them would not give rise to straightforward assessments. Besides that, gait is not merely a mechanical problem, it is also personal expression. To illustrate this point, Horvat selected 71 terms to describe gait patterns, and most of them are more psychological than mechanical in nature [3]. In many cases of gait analysis, however, a gait quality parameter is needed, to provide a means for clinical diagnosis and therapy considerations. A convenient strategy is training neural networks on examples of gait patterns. We have demonstrated before [2] that employing a supervised neural network model for discriminating “healthy” and “pathological” gait patterns leads not only to a classification scheme but also to a fairly good assessment of the gait patterns. In this paper we classify a number of “pathological” gait patterns by using self-organizing maps, yielding a topographic arrangement of the diverse patients’ injuries, and thus a detailed classification means. From a biomedical point of view, our study demonstrates that the collected data from ground reaction force measurement platforms actually contains relevant information to classify gait patterns. Furthermore, the classification is done automatically. In other words, we employ only observable data
without the necessity of defining whatever model of gait, be it biomechanical or statistical. The remainder of the paper is organized as follows. In the following section we provide the description of the data that was used for classification. In Section 3 we give a brief review of self-organizing maps. Section 4 contains a typical result from gait pattern classification with self-organizing maps. Finally, we provide some conclusions in Section 5.
2
900
right
800 700 600 500 400 300 200
left
100 0
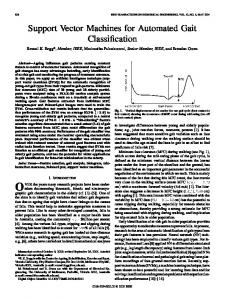
Fig. 1: Difference between left and right footstep of one patient
Data collection and representation
The various gait patterns to be classified were collected by using two ground reaction force measurement platforms. Their purpose is among others to record the forces exhibited in the three directions in space while the foot is stepping on the ground. The platforms are mounted evenly on the ground in such a way that a pair of a consecutive left and right footstep can be recorded. The data was collected from patients at an Austrian rehabilitation centre (“Weißer Hof”). The patients start walking at least three footsteps, then step on the first platform and afterwards on the second one. In order to produce habitual gait patterns the patients were asked to walk some footsteps further after they left the second platform. The recording as such was done at a sampling frequency of 250 Hz. The usual duration of one footstep is slightly less than one second. The actual input patterns for the training process of the artificial neural network consist of the vertical force component of the recorded gait pattern from one consecutive left and right footstep. The motivation behind using just the vertical force component is that the training results were largely the same when using all three components, yet at the expense of longer training times. Just to show the potential differences between left and right footsteps, Figure 1 depicts the patterns recorded at four different times from one and the same patient suffering from a pelvis injury. In this particular case the right footstep comes close to a “healthy” pattern of the vertical force component. In order to come up with comparable values within the patterns, the recorded components have been FastFourier transformed and subsequently mapped to the interval [0, 1]. Apart from performance considerations of training, the Fast-Fourier transform was chosen since the amount of data recorded at each footstep heavily depends on that footstep’s actual duration. As an example consider Figure 2 where the graph of the vertical force component measured in Newton is depicted for four patients each recorded at three
distinct times. Apparently, even the durations of the same patient’s footsteps are inhomogeneous. 900 800 700 600 500 400 300 200 100 0
Fig. 2: Vertical force component of three distinct gait patterns recorded with four different patients
Additionally, the Fast-Fourier transform leads to massive data reduction because the first few coefficients contain most of the information needed to reproduce the graph. This fact may readily be seen in Figure 3 containing the graph of the Fourier coefficients computed from the gait patterns presented in Figure 2. For a convenient representation we show only the Fourier coefficients of one footstep per patient. 150000 100000 50000 0 -50000 -100000
Fig. 3: The first 32 Fourier coefficients of selected gait patterns depicted in Figure 1
For the actual training process of the artificial neural network we restricted to the first 64 Fouriercoefficients. Additionally, we should note that we used the raw input data without any normalization in time. In the remainder of the paper we will use gait patterns from about 100 different patients and about 10 pairs of footsteps per patient recorded at different times during their stay in the rehabilitation centre. Just to provide the exact figure we used 1003 distinct gait patterns to train the artificial neural network.
3
Self-organizing maps
The various gait patterns as described above are classified by using self-organizing maps [4], [5] which are one of the most prominent unsupervised artificial neural network models. The model consists of a layer of input units each of which is fully connected to a grid of output units. These output units are arranged in some topological order where the most common choice is represented by a two-dimensional grid of output units. Input units take the input patterns and propagate them as they are onto the output units. Each of the output units is assigned a weight vector with the same dimension as the input data. The learning process of self-organizing maps can be seen as a generalization of competitive learning. The key idea of competitive learning is to adapt the unit with the highest activity level with respect to a randomly selected input pattern in a way to exhibit an even higher activity level with this very input in future. Commonly, the activity level of an output unit is computed as the Euclidean distance between the unit’s weight vector and the actual input pattern. Hence, the so-called winning unit, i.e. the winner in short, is the output unit with the smallest distance between the two vectors. Adaptation takes place at each learning step and is performed as a gradual reduction of the difference between the respective components of input and weight vector. The degree of adaptation is guided by a so-called learning-rate that is gradually decreasing in the course of time. As an extension to competitive learning units in a time-varying and gradually decreasing neighborhood around the winner are adapted, too. Pragmatically speaking, during the learning steps of self-organizing maps a set of units around the actual winner is tuned towards the currently presented input pattern. Without assuming it to be a biologically plausible function, we use the following realization of a neighborhood-function [7]. In this equation i and j
refer to the coordinates of a unit within the output grid. The time-dependent, gradually decreasing function β is used as a sort of gain parameter in order to reduce the amount of weight vector adaptation in the course of time. ηij(t)=β(t) (sin(α ||i-j||) / (α ||i-j||)) (1) With c denoting the winner at learning iteration t, x being the current input pattern, wj referring to the weight vector of unit j and ε(t) representing the learning-rate, the complete learning rule may now be written as follows. wj(t+1)=wj(t) + ε(t) ηcj(t) [x(t)-wj(t)] (2) This learning rule leads to a clustering of highly similar input patterns in closely neighboring parts of the grid of output units. Thus, the learning process ends up with a topological ordering of the input patterns. Due to the limited space in this paper we cannot provide a more detailed exposition of self-organizing maps we rather refer to literature, especially to [6].
4
Gait classification results
In order to provide a means for convenient analysis of the classification result presented thereafter, we give the distribution of selected gait malfunctions of the observed patients in Table 1. Malfunction
Percentage
Pelvis right
21.3
Pelvis both sides
9.0
Artificial ankle left
7.9
Artificial ankle right
6.7
Knee left & Foot right
6.7
Knee right
5.6
Foot left & add. injuries
5.6
Foot left & ankle left
4.5
Ankle left
4.5
Table 1: Distribution of selected gait malfunctions
The complete training set comprises 15 different groups of motor system injuries. In Figure 4 we show the absolute value of the mean Fourier coefficients calculated from the respective patients’ gait patterns. A typical result from the classification of gait patterns by using self-organizing maps is depicted in Figures 5 through 7. In this particular case we utilized a 10x10
rectangular grid of output units. The training process ended up with a stable arrangement of the input patterns after approximately 10,000 learning iterations with a remaining quantization error of 0.053015. Before we present the classification result in full detail we start with two observations related to a higher degree of abstraction. The first one is that the training process was successful in distinguishing malfunctions of the left motor system from the right. Figure 5 illustrates this type of mapping. The labelling “middle” refers to malfunctions of the vertebral column which is by nature not readily assignable to either left or right motor system. Interestingly, gait patterns of patients with artificial limbs are strictly separated and classified in their own areas of the map. Notice that four units are assigned to two different classes each. We visualized this fact by horizontally
splitting the shading of the respective units into two halves. As a second observation we find that the geographical arrangement of gait patterns resembles the location of the malfunctioning part of the motor system within the human body to a large degree. This type of arrangement is presented in Figure 6. Finally, the topological arrangement of the various gait patterns in the stable self-organizing map is presented in Figure 7. The different shadings of units in Figure 7 designate the location of gait patterns of persons with varying gait malfunctions. The arrows in the figure are used to connect areas allocated for patients with similar malfunctions that are, however, arranged in different parts of the map. Yet, their geographical separation is not dramatic. As a first observation, the gait patterns of patients with similar
200000 150000 100000 50000 0
Fig. 4: Absolute values of the mean Fourier coefficients from 15 groups of injuries
ARTIFICIAL LIMB LEFT
Artificial limb Knee
“MIDDLE”
Vert. Col.
RIGHT
Shank
Pelvis Pelvis
LEFT & RIGHT
ART. LIMB RIGHT
Foot & add. injuries Misc. LEFT
Knee Foot & Ankle
Fig. 6. Arrangement of injured motor system parts
Fig. 5. Separation of left and right motor system
artificial ankle left knee right vert. column
foot left right
foot left vert. column
shank right
pelvis right artificial ankle right foot ankle ankle right pelvis left ankle thigh left left pelvis right left add. injuries
foot l&r
pelvis left & right
knee left, foot right
foot left and additional injuries foot left and ankle left
ankle left
Fig. 7. Map of gait patterns from 100 patients
knee left
gait malfunctions are mapped onto neighboring areas in the output space. Moreover, gait patterns of patients with multiple malfunctions are arranged topologically close to the respective gait patterns of patients suffering from subsets of these malfunctions. Another observation refers to the fact that almost no misclassification of gait patterns occurred during the learning process. Patterns of patients with injuries of the same part of the motor system are mapped onto the same region of units within the output grid. The sole exceptions are the regions labelled “thigh, pelvis left, additional injuries” in the lower left part of the final map and “vertebral column” in the upper left part of the map. However, due to the fact that in the first case patients with highly divergent “additional injuries” are classified such a rather small distortion comes naturally. In the second case, the separation of the allocated output units also does not come surprisingly since the effect of injuries in the various parts of the vertebral column causes highly divergent gait patterns. On a closer look at the lower left part of the final map we recognize a rather large part intermingling two similar groups of gait malfunctions. More precisely, we find patients with injuries related to their left foot and ankle as well as patients with multiple malfuntions including the left foot. Hence, the region is allocated for highly overlapping gait malfunctions. However, with training of larger self-organizing maps in terms of the number of output units this very region becomes separated into neighboring portions of the output space, thus giving a more precise representation of the “additional injuries”. As another highly interesting observation again from the lower left part of the final 10x10 map, patients suffering exclusively from injuries of their left ankle are mapped neighboring this large area. In a nutshell, the self-organizing map proved to be highly effective in classifying gait malfunctions based on real-world measured input data. Furthermore, the classification result is interpretable at various levels of abstraction ranging from single pattern classification to motor system parts.
5
Conclusion
In this paper we presented a novel approach to gait pattern classification by using a prominent unsupervised artificial neural network model, namely the self-organizing map. The gait patterns were recorded with patients at a rehabilitation centre at different time during their stay. We were able to
demonstrate that the self-organizing map was successful in classifying the gait patterns according to the patients’ malfunctions based solely on input patterns representing data recorded with ground reaction force measurement platforms. The major benefit of such an approach is related to the fact that it is only necessary to employ observable data without the need of the laborious definition of whatever model of gait beforehand, be it biomechanical or statistical. Even though the self-organizing map produced classification results where malfunctions of the left motor system were distinguished from the right. Moreover, the geographical arrangement resembled the location of malfunctioning motor system parts within the human body to a large degree. Future work will concentrate on classifying a larger set of gait patterns. Additionally, gait patterns from healthy persons will be included in the training data in order to provide assistance to medical personnel in the rehabilitation centre in developing therapy strategies.
References [1] J. Denoth. Analyse von Belastung und Beanspruchung des Bewegungsapparates. Swiss Med 36. 1987. (in German). [2] S. Holzreiter, M. Köhle. Assessment of gait patterns using neural networks. J. Bio Med. 1993. [3] E. Horvat. Gangbildanalyse. Mecke. Duderstadt. 1990. (in German). [4] T. Kohonen. Self-organized formation of topologically correct feature maps. Bio. Cyber. 43. 1982. [5] T. Kohonen. The self-organizing map. Proc of the IEEE 78(9). 1990. [6] T. Kohonen. Self-Organizing Maps. SpringerVerlag. Berlin. 1995. [7] D. Merkl. The Effects of lateral inhibition on learning speed and precision of a self-organizing map. Proc Australian Conf on Neural Networks. Sydney. 1995.