LETTERS International Journal of Recent Trends in Engineering, Vol 2, No. 2, November 2009
Classification of Microcalcifications Using Multi-Dimensional Genetic Association Rule Miner K. Thangavel1, A. Kaja Mohideen2* 1
Professor and Head, Department of Computer Science, Periyar University, Salem-11, Tamil Nadu, India,
[email protected] 2 Research Scholar, Department of Computer Science, Periyar University,Salem-11, Tamil Nadu, India.
[email protected]
Abstract – Breast cancer is a most common disease diagnosed in women. The Microcalcification Clusters (MCs) in the mammograms are one of the important early sign. The accurate detection of microcalcifications is a key problem in Computer Aided Detection (CAD). In this paper, we have proposed a novel association rule mining approach for classification of microcalcifications. Initially, the shape features are extracted from the digital mammograms. With these feature values association rules are constructed to develop a rule based system for classification of microcalcifications. A novel Multidimensional Genetic Association Rule Miner (MGARM) is proposed for rule construction. The result shows that the proposed rule-based approach reaches the classification accuracy over 85% and also demonstrates the use and effectiveness of association rule mining in image classification. Index terms – Mammograms, Microcalcification Clusters, Shape Features, Classification, Association Rule Mining, Genetic Algorithm.* I. INTRODUCTION Breast cancer continues to be a significant public health problem in the world. Mammography is, at present, one of the most effective methods for early detection of breast cancer. One of the important early signs of breast cancer is the appearance of Microcalcification Clusters (MCs) in mammogram. Because of the importance in early breast cancer diagnosis, accurate detection of MCs has become an important problem. Number of approaches has been applied to the detection of MCs [1-3]. This paper proposed a new method for building a system for classification of microcalcifications based on association rule mining. This work is an extension and improvement of the system and algorithm developed in [4,5]. In which, a general association rule mining is used with statistical features. Here, we have proposed the framework with a novel Genetic Algorithm (GA) based association rule mining with shape features, as demonstrated in [6] which classifies better than the statistical features. The rest of the paper is organized as follows. Section 2 describes the preprocessing and shape based feature extraction. Section 3 explains the proposed rule-based algorithm to build the classification system. Section 4 demonstrates the proposed *
Corresponding Author
© 2009 ACADEMY PUBLISHER
algorithm with mammogram images and presents the results obtained. Section 5 concludes the paper with direction for further research. II. PREPROCESSING Preprocessing is the process of cleaning the data by removing noise, outliers etc. that could mislead the actual mining process. Initially the breast profile is segmented and labeled as described in [6]. Then the shaped features are extracted from the segmented Microcalcification clusters. One set of shape features of the microcalcifications and their clusters are used for classification given by [6]. This set contains totally 17 features as listed in the following table.
1 2 3 4 5 6 7 8 9 10 11 12 13 14 15 16 17
TABLE I FEATURES RELATED TO THE SHAPE AND APPEARANCE OF MCS Number of microcalcifications in the cluster Maximum size of calcifications in cluster Standard deviation of the size of calcifications in cluster Number of calcifications with size of 1 pixel Sum of the area of the calcifications in each cluster Maximum value of compactness in cluster Average compactness in cluster Maximum value of F3–F1 in cluster Average F3–F1 in cluster Maximum value of F3 in cluster Average F3 in cluster Radius of the circle that best fits the cluster Scattering of the microcalcifications Average gray level of the microcalcifications in cluster Standard deviation of the mean of the MCs Maximum standard deviation of the gray levels Average standard deviation in each calcification in cluster
III. ASSOCIATION RULE MINING Association rule mining is one of the important tasks of data mining intended towards decision support. Basically it is the process of finding some relations among the attributes of a huge database. Such relationships will help in taking some decisions. The process of extracting these relationships is termed as association rule mining. A number of algorithms have been developed for searching these rules [7]. In this work, we have used the measures like information gain and interestingness [8], used for constructing and evaluating a rule. A. Multi-Dimensional Genetic Association Rule Miner The shape features extracted for the digital mammograms are discretized using WEKA, an open source tool freely downloadable from http://www.cs.waikato.ac.nz/ml/weka. And
233
LETTERS International Journal of Recent Trends in Engineering, Vol 2, No. 2, November 2009 the discretized values are stored in database, in which, each columns represents one feature (attribute) and the last column represents the class attribute. And tuples are used to represent images. A novel genetic algorithmic approach named Multidimensional Genetic Association Rule Miner (MGARM) is proposed for constructing rules for classification of MCs. Here, the multi-dimensional means, for each class in the database, a separate thread of GA is applied to construct the rule. Finally the best rule in each thread is combined to form the rule set. The detail of the proposed algorithm is explained in the following sequel. The genes are the basic elements of GA. Here the attributes are considered as genes. The sequence of genes is known as chromosome, represents one rule. A collection of 20 chromosomes generated for each population. The MCs are going to be classified into three types: normal, benign and malign. So, in this work, the GA has 3 dimensions, means 3 set of populations. The chromosomes are encoded with numbers, every 2 digits are reserved for one attribute and the final attribute is mean for the class attribute. In this way the rule can be easily decoded. Each attribute can have set of possible values. The encoding represents one of the possible values with its index. If that gene 00 means that the corresponding attribute is not included in the rule. Consider the following chromosome: 00 11 05 00 01 Which represents a rule, in that, the first and fourth attributes are not considered, the second and third attributes are included with their 11th and 5th index values. For rule construction, the items are selected at random, and the information gain is calculated for the attribute, if it is greater than the threshold (0.5) then the item will be added to the rule, ignored otherwise. For each rule the interestingness measure is calculated as fitness value. And the rule having highest interestingness is stored as global best rule for each population. Then the genetic operators are applied to generate a new set of population as given: Reproduction (selection) The selection process selects chromosomes from the mating pool directed by the survival of the fittest concept of natural genetic systems. In the proportional selection strategy adopted in this article, a chromosome is assigned a number of copies, which is proportional to its fitness in the population that goes into the mating pool for further genetic operations. Roulette wheel selection is one common technique implements the selection strategy. Crossover Crossover is a probabilistic process that exchanges information between two parent chromosomes for generating two child chromosomes. In this paper, single point crossover with a fixed crossover probability of pc=0.6 is used. For chromosomes of length l, a random integer, called the crossover point, is generated in the range [1, l-1]. The portions of the chromosomes lying to the right of the crossover point are exchanged to produce two offspring.
From the new set of populations, the best rules are extracted known as locally best. The global and local best rules are compared. If local rules are better than the next iteration is continued with the new populations and the local rules are saved as global best. Otherwise, the next iteration is performed with the old populations. The global best rules are pruned to check whether the quality is improving or not. In rule pruning, the attributes are temporarily removed one by one at random, if the interestingness measure improves than the attributes are removed permanently. The following algorithm describes our proposed method. MGARM Algorithm 1. Load the training samples of shape features. 2. Construct 20 chromosomes (rules) based on information gain for M populations, one population for each dimension (class). 3. Calculate the interestingness of each chromosome; assign them as fitness value. 4. For each population, Store the chromosomes having better interestingness as global best rule. 5. Apply the Genetic operators such as reproduction, crossover and mutation to construct the new population. 6. For the new populations at each dimension, calculate the interestingness of each chromosome. 7. Choose the locally best rule. 8. Compare the global and local best rules. 9. If local rules are better than the global Continue the next iteration with the new population and hold the local best rule as global best. Otherwise, continue with the old population. And perform rule pruning. Repeat from Step 5 for n number of iterations. Decode the global best chromosomes to form the association rules for each class. IV. EXPERIMENTAL RESULTS The digital mammograms used in our experiments were taken from the Mammographic Image Analysis Society (MIAS). The database consists of 322 images, which belong to three categories: normal, benign and malign (ftp://peipa.essex.ac.uk). There are 208 normal images, 63 benign and 51 malign, which are considered abnormal. The proposed method is evaluated based on ten-fold cross validation method. The following table presents the ruleaccuracy of the proposed classification system compared with other association rule based system proposed in [4,5]. The results for the ten splits of the mammogram database are given in Table II.
Mutation Each chromosome undergoes mutation with a fixed probability pm=0.03. For binary representation of chromosomes, a bit position is mutated by simply flipping its value. Since we are considering real numbers, a random position is chosen in the chromosome and replace by a random number between 0-9.
234 © 2009 ACADEMY PUBLISHER
TABLE II CLASSIFICATION ACCURACY FOR THE TEN SPLITS WITH MGARM
Splits 1 2 3 4 5 6 7 8 9 10 Average
Classification Accuracy
81.33 79.65 87.89 90.76 73.12 88.23 83.66 89.41 88.54 90.05 85.26
LETTERS International Journal of Recent Trends in Engineering, Vol 2, No. 2, November 2009 Table III shows the overall performance analysis of the proposed method with the existing. As the result shows, our proposed algorithm, MGARM reaches more than 85% of accuracy, which is better than others. TABLE III
PERFORMANCE ANALYSIS Algorithms Classification Accuracy MGARM 85.26% 80.33% Association Rule Mining [4] 69.11% Association Rule Mining [5]
ACKNOWLEDGEMENT
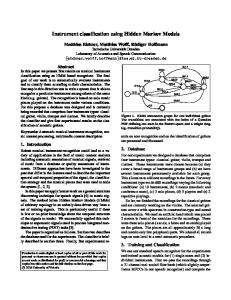
Precision/Recall
The Precision/Recall (PR) curve also presented to measure the performance of the proposed algorithm. The formula for precision and recall are given below: Precision = TP / (TP+FP)
(1)
Recall = TP / (TP+FN)
(2)
dimensional Genetic Association Rule Miner (MGARM) is applied to construct the association rule to classify the images into three classes: normal, benign and malign. The result shows that MGARM outperforms than the existing. In future, an efficient algorithm can be used to select the relevant features and the rules can be generated to improve the accuracy.
The first author wishes to thank the University of Grant Commission (UGC Grant F.No. 34-105/2008 (SR)) for providing research grants.
1 0.9 0.8 0.7 0.6 0.5 0.4 0.3 0.2 0.1 0 0
1
2
3
4
5
6
7
8
9
10
splits
Figure 1. PR Curve for MGARM
where TP, TN, FP, and FN are the numbers of true positive, true negative, false positive, and false negative test results, respectively. Fig 1 shows the PR curve for the proposed method. As defined in the equations, most of the splits the FP and FN are very lower, makes the curve to reach the maximum. It can be observed from the curve that the proposed method is an efficient rule based classifier than the existing. V. CONCLUSIONS Classification of Microcalcification Clusters (MCs) is one the key to find the early sign of breast cancer. In this paper, we have proposed a novel association rule based system for classification of Microcalcification Clusters (MCs). Initially the MCs are segmented from the mammograms and the shape features are extracted. The proposed approach Multi-
© 2009 ACADEMY PUBLISHER
235
REFERENCES [1] H. D. Cheng, X. Cai, X. Chen et al., “Computer-aided detection and classification of microcalcifications in mammograms: a survey,” Pattern Recognition, vol. 36, no. 12, pp. 2967-2991, 2003. [2] K. Thangavel, M. Karnan, R. Siva Kumar, and A. Kaja Mohideen, “Automatic Detection of Microcalcification in Mammograms-A Review”, Intl. J. on Graphics Vision & Image Processing, vol. 5, no. 5, pp: 31-61, 2005. [3] K. Thangavel, M. Karnan, R. Siva Kumar and A. Kaja Mohideen, “Segmentation and Classification of Microcalcification in Mammograms Using the Ant Colony System”, Int.l Journal on Artificial Intelligence and Machine Learning, vol. 5, no. 3, pp. 29-40, 2005. [4] ML Antonie, OR. Zaiane, and A Coman, “Application of data mining techniques for medical image classification”. In Proc. Of Second Intl. Workshop on Multimedia Data Mining (MDM/KDD’2001) in conjunction with Seventh ACM SIGKDD, pp 94–101, San Francisco, USA, 2001. [5] OR. Zaiane, ML Antonie, and A Coman, “Mammography Classification by an Association Rule-based Classifier”, Intl. Workshop on Multimedia Data Mining (with ACM SIGKDD 2002), pp. 62-69, 2002. [6] HS Zadeh, F Rafiee-Rad, SP. Nejad, “Comparison of multiwavelet, wavelet, Haralick, and shape features for microcalcification classification in mammograms”, Pattern Recognition, vol. 37, pp. 1973 – 1986, 2004. [7] J Hipp, U Güntzer, and G Nakhaeizadeh, “Algorithms for association rule mining––a general survey and comparison”, vol. 2, no. 1, 2000. [8] Jiawei Han and Micheline Kamber, “Data Mining, Concepts and Techniques”. Morgan Kaufmann, 2001.