(1) Dept. of Signals and Systems (2) Dept. of Electric Power Engineering. Chalmers ... Keywords: power system monitoring, power quality, voltage dips,.
- 745 Classification of Power System Events: Voltage Dips Emmanouil Styvaktakis"', Math H.J.Bollen'2', Irene Y.H. Gu"' (1) Dept. of Signals and Systems (2) Dept. of Electric Power Engineering
Chalmers University of Technology, S-412 96 Gothenburg, Sweden Abstract: The extensive monitoring programs that are run by power utilities enable new insights of the power system operation and new characterisation methods must be used for the classification and analysis of the recordings. This paper focuses on events that cause a temporary decrease in the fundamental frequency voltage magnitude (voltage dip). The analysis of the recordings from surveys in medium and low voltage networks shows that new classes of voltage dips should be introduced in order to characterise the events that are captured by the power quality monitors. Aim of the paper is to show the distinctive characteristics of each class and give the guidelines for the automatic processing of the recordings. Finally, a large number of recordings from a medium voltage network are classified using these characteristics and the results are presented. Keywords: power system monitoring, power quality, voltage dips, power system faults, power transformers, induction motors, Short Time Fourier Transform.
I. INTRODUCTION The importance of power quality in the operation and design of power systems is widely accepted. Utilities are forced to prove that the offered power meets the specified standards and the requirements of the customers. Furthermore, when the quality of power is not accordant with these requirements, immediate action should be taken. For these reasons power utilities run extensive monitoring programs in order to provide statistics regarding the quality of the power and the necessary information for the solution of problems. Additional benefit of monitoring is that the engineers obtain new knowledge about system operation. The developments in communications and electronics make monitoring even more attractive from a cost point of view and is expected that more monitors will be installed in the coming years. The monitors according to their settings capture different types of events and long sequences of measurements are transferred to the databases. Some of these events are due to normal system operations, do not cause any problem and are not of particular interest, while others need to be categorised according to the needs of the monitoring program.
0-3803-6G99-6/CO/$lO. 00
2OOC IEEE
However, because of the large size of these databases new tools are required that will enable the automatic processing of the recordings. These tools should be able to extract all relevant information and offer all the necessary statistics. This paper focuses on a large class of power system events: those that their main characteristic is a temporary decrease in the fundamental frequency voltage (voltage dip) in one or more phases. Voltage dips have attracted a lot of attention due to the problems that cause to equipment like adjustable speed drives, computers, industrial control systems etc. They are mainly caused by faults and induction motor starting [ 121. It has been clarified already that voltage dips cannot be characterised by a single magnitude and duration for each phase. In [3], it is shown that these values are inadequate in describing a voltage dip and especially its impact on sensitive loads. In [4], the case in which the voltage dip contains multiple components is highlighted. Aim of this paper is to show that there are certain types of voltage dips that should be considered in the analysis of monitoring data as showed the analysis of a large number of recordings. Furthermore, the distinctive characteristics of each type are extracted and presented. For the analysis of the different types of voltage dips, recordings are used that were performed at medium and low voltage networks in Sweden (by Goteborg Energi Nat AB), Norway (by SINTEF Energy Research) and Scotland (by Scottish Power). Finally, a large set of recordings is classified, explained and presented in terms of the above mentioned types. 11. BACKGROUND A. Short Time Fourier Transform. The squared magnitude of the Fourier Transform is the classic method used to represent the frequency domain information (spectrum) of a stationary signal. However, this approach does not provide any information on the time properties on the frequency components that the signal contains. The Short Time Fourier Transform ( S m ) overcomes the problem by partitioning the signal into short time segments (during which the signal is considered stationary) then applying a weighting function to the signal within each segment, prior to evaluating the Fourier Transform. This
- 746 provides a time-frequency distribution of the signal which represents the evolution of the signal spectrum as a function of time. Let x(n) represent a discrete time signal, the STFT at time ndt and frequency f is defined as [5]:
where w is the analysis window that selectively determines the portion of x(n) for analysis. In this paper STFT is used to extract the fundamental frequency of voltage and its harmonics. For the purposes of this paper, the Sl” was applied using a rectangular weighting window and the segmentation of the analysed signals was in overlapping blocks of one cycle.
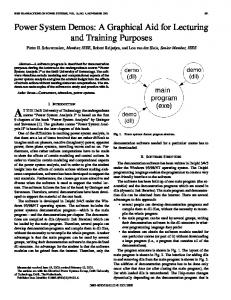
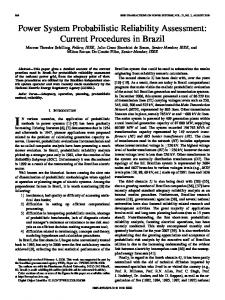
B. Voltage dips due to faults Voltage dips due to faults can be severe and therefore are of major concern. They cause problems to a large number of customers as they propagate in the system. The magnitude of this type of voltage dip at a certain point in the system depends mainly on the type of the fault, the distance to the fault, the system configuration and the fault resistance. Its duration depends on the type of protection that is used and varies between half a cycle (for a fuse) to a few seconds [2]. Faults are either symmetrical (three phase or three phase-toground faults) or non-symmetrical (single phase or double phase or double phase-to-ground faults). Depending on the type of fault the magnitudes of the voltage dips of each phase might be equal (symmetrical fault) or unequal (nonsymmetrical faults). Fig.] shows the voltage waveforms during a fault induced voltage dip. The measurement was performed in an 11 kV network. The duration of dip is approximately 5 cycles, which is the typical time for a circuit breaker to open after it receives a trip command from the system’s protection relays. The recovery of voltage is fast and it creates an almost rectangular shape for the fundamental frequency voltage magnitude. The magnitude of the voltage dip is different for each phase (non-symmetrical fault).
I
12 0
50
100
150
200
250
3M)
lime(msec)
Hg.1. (a)-(c) Phase-to-phase voltage waveforms during a fault (d) The fundamental frequency magnitude of voltage.
I
400
50
100
150
200
50
100
150
200
50
100
150
200
100
150
200
I
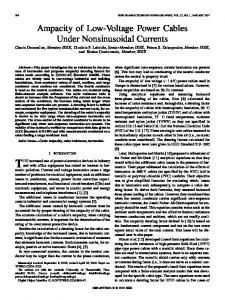
C. Voltage dips due to induction motor starting During starting, motors draw approximately five-times their full-load running current, and at a very low power factor. This starting current causes shallow voltage dips. The magnitude of the voltage dip depends on the characteristics of the induction motor and the strength of the system at the point that the motor is connected. Fig. 2 shows the voltage waveforms during a voltage dip due to induction motor starting. The measurement was performed in a 400 V network. The fundamental frequency voltage magnitude of all phases drops approximately 10% of the pre-event value and then recovers gradually as the current that is drawn by the motor decreases.
I
272 0
W 50
i
Time(msec)
Fig.2. (a)-(c) Phase-to-groundvoltage waveforms during induction motor starting (d) The fundamental frequency magnitude of voltage.
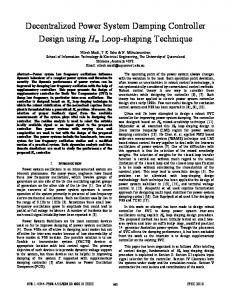
- 747 111. OTHER VOLTAGE DIP TYPES A. Multistage voltage dips Multistage voltage dips are due to faults but they present different levels of magnitude before voltage returns back to normal. Fig. 3 shows the voltage waveforms during a multistage voltage dip. The measurement was performed in an I I kV network. As the fundamental frequency magnitude of voltage shows, the voltage dip magnitude shows an additional step before the final voltage recovery. These steps in the voltage dip magnitude can be due to either changes in the system configuration while the protection system tries to isolated the fault or changes in the nature of the fault itself. A typical situation is a fault in the transmission system that is not cleared during the operation of zone 1 distance protection but only during the zone 2 operation. Consider as an example the subtransmission loop of Fig. 4. Suppose that Zl and Z,are the impedances between the source and the load bus, 2, the source impedance and that a fault occurs between the circuit breakers CBI and CB2 at fraction p from the source. The voltage dip at the load bus (in P.u.) is given by [ 6 ] :
If CBI opens to clear the fault then the load bus will experience a voltage dip of magnitude:
I 0
Fig.4. Equivalent circuit for faults in a subtransmissionloop
(3)
By comparing the denominators of the above formulas it is easy to see that the opening of CB 1 will lead to an increase in voltage (because: &(Z,+&)>pZ&). The voltage dip at the load bus will recover completely only after circuit breaker CB2 opens. B. Voltage dips due to self-extinguishing faults Voltage dips due to self-extinguishing faults are the ones that disappear before the fastest possible breaker opening time. Fig. 5 shows the voltage waveforms during a selfextinguishing voltage dip. The measurement was performed in a 10 kV network. As the fundamental frequency magnitude of voltage shows the voltage decreases for less than 2 cycles before it disappears without causing operation of the protection system. The healthy phases present an overvoltage.
I
100
2w
300
400
500
600
0
100
200
300
400
500
600
I 0
100
200
300
400
500
100
200
300 400 Time(msec)
500
I
I
0
50
100
150
200
250
600
0
50
100
150
200
250
600
0
50
100
150
200
250
I
15
12 0
Fig.3. (a)-(c) Phase-to-phase voltage waveforms during a fault (d) The fundamental frequency magnitude of voltage.
Tlme(msec)
Fig.5. (a)-(c) Phase-to-groundvoltage waveforms during a self-extinguishing fault (d) The fundamental frequency magnitude of voltage.
- 748 C. Voltage dips due to transformer energising
D. On the classification of voltage dips
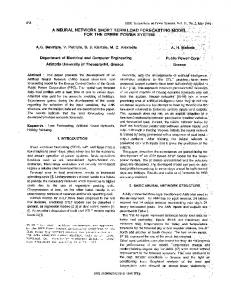
Voltage dips due to transformer energising have been reported in the literature [7]but neither the frequency in which this event appears in a power quality survey nor the characteristics of this event in terms of voltage have been presented. The main attention has been given to the effects of the inrush current on the protection relays of the transformer itself [8]. In a transformer under steady-state conditions there is a particular value of flux in the core, for each point on the voltage waveform. When the transformer is energised, the initial value of flux in the core might not necessarily be the steady-state value for this particular point on the voltage waveform. A transient will occur to change the flux in the core to the steady state condition. In general, this will cause the flux to go above the saturation value once each cycle until the average value of the flux for a cycle has decayed to nearly zero. This temporary over-fluxing of the transformer core causes high values of the magnetising current. This phenomenon is known as magnetising inrush current. In tum, short duration voltage dips are caused that might result in an unwanted tripping of differential protective relays. As described in [7] and [9]this voltage dip can be long in duration and drive more transformers into saturation. Fig 6 shows the voltage waveforms during transformer energising. The measurement was performed in an 1 1 kV network. The fundamental frequency voltage magnitude drops for a very short time and recovers gradually as the magnetising current decreases. The largest drop is approximately 8% of the pre-event voltage.
As mentioned in the introduction, automatic processing of the recordings is needed for the analysis of the databases created by power quality surveys. In this direction, the distinctive features of each type must be extracted and utilised in a rule-based system. The analysis of a large number of recordings from different surveys showed that the following characteristics can be used to distinguish between the different types of voltage dips: 1. The rectangular shape of the fundamental frequency voltage magnitude: voltage dips due to faults have this shape as shown in Fig. 1 due to the operation of protection that clears the fault and forces voltage to recover fast. On the other hand, voltage dips due to induction motor starting and transformer energising recover gradually as show in Fig. 2 and 6 providing that there is no protection maloperation. 2. The symmetry between the different phases: voltages during induction motor starting are symmetrical because an induction motor is a balanced load and each phase will draw the same inrush current causing a voltage dip of the same magnitude for all phases as in Fig. 2. In the case of transformer energising this is not true. The inrush current depends on the degree of saturation of each phase therefore, each phase will experience a voltage dip of different magnitude (non-symmetrical) as shown in Fig. 6. Finally, voltage dips due to faults can be symmetrical or nonsymmetrical depending on the type of the fault. 3. The harmonic contents of voltage during the voltage dip: it is well documented that the voltage waveforms during transformer energising present high harmonic distortion [e.g. 91. The analysis of voltage waveforms during transformer energising showed that the harmonic distortion is temporary and the even harmonics (second and fourth) are contributing the most as shown in Fig. 7 which shows the harmonics up to the fifth of the first voltage waveform of Fig. 6. These features have been already applied in a ruled-based system for power system event classification and the results show strong potential [IO].
I
0
I
100
200
300
400
500
I I
0
100
200
300
400
"
"
"
'
'
'
I
500
t
3.5
0
"
I
100
200
300
400
I
"I,
500
I
I
14
0
100
200
300
400
500
Time(msec)
Rg.6.(a)-(c) Phase-to-phase voltage waveforms during transformer energising(d) The fundamental frequency magnitudeof voltage
Fig.7. Harmonicsof voltage (ofFig. 6) during transformer energising as percentage of the fundamental frequency voltage using the STFT.
- 749 V. ANALYSIS OF A DATABASE USING THE PROPOSED CLASSIFKATION Recordings that correspond to one month of monitoring in a medium voltage network (33 and 11 kV), were analysed using the STFI’. Using the features that were described in the previous section, these recordings were classified in different categories as shown in Table 1. The monitors are triggered by current or voltage disturbances and all the resulting recordings are considered here. Voltage dips due to faults turned out to be the category with the largest number of recordings. They are subdivided into three classes: a) Voltage dips of duration longer than 3 cycles: this is the largest class of all and their duration varies with the type of protection that is used to clear the fault that caused them. b) Voltage dips of duration shorter than 3 cycles: these are either due to self-extinguishing faults or fuse-cleared faults. However, it is not clear to the authors for how long a selfextinguishing fault might persist before it disappears. It is possible that self-extinguishing faults exist in the first subclass (voltage dips longer than 3 cycles). Records of the protection operation from all the voltage levels are needed to accurately extract this type of voltage dip from the database. c) Multistage voltage dips: in this group there are recordings that have two or even three different levels of voltage dip magnitude. In this category we recognised shallow voltage dips of duration that points towards a fault in the transmission system that is cleared only after zone 2 operation of distance protection. Voltage dips due to transformer energising form a considerable part of the database. These are basically nonrectangular, non-symmetrical voltage dips having a temporary harmonic distortion. This type of event might take place either due to normal system operation (manual energising of a transformer) or due to reclosing actions following the opening of circuit breaker to clear a fault. Category 3 contains recordings in which voltage increases or decreases in a step way without a voltage dip. These events could be due to on-load transformer tap changing, capacitor switching or reactor switching.
I I
I Durationz3cycles “Itage
to faults
I1 2
dips due
I 190records 1 I
Duration < 3cycles
I Multistage
Voltage dips due to transformer energising
I 3 1 Step changes in voltage
48 records
I 65records 1)
I
85 records
1
I 134 records 1
4
Insignificantdrop in voltage (less than 2%)
221 records
5
Unclassified
I3 records
Category 4 consists of recordings that did not present any significant drop in voltage. Most of these recordings were captured by the monitors because of a variation in current. Category 5 contains recordings that although contain a voltage dip could not be explainedklassified using the above categories. Voltage dips due to induction motor starting were not found. The explanation is that induction motors connected in low voltage do not cause severe voltage dips in the medium voltage network. VI. CONCLUSIONS The analysis of a large number of recordings mainly from medium voltage networks showed that new characterisation methods are needed because not all voltage dips can be described by a single magnitude and duration for each phase assuming a rectangular shape of the fundamental frequency voltage. The most interesting findings in the analysed data are that: 1. A large part of voltage dips due to faults are multistage, i.e. they present different levels of voltage dip magnitude before the fault is cleared. As explained above this could be either due to a change in the nature of the fault or due a change in the system configuration during the protection operation. Further work is needed in order to distinguish these two cases. 2. A new category of voltage dips should be taken into consideration: those that are due to transformer energising. The number of recordings due to this type of event is significant. This type of voltage dips might take place either due to normal system operation (manual energising of a transformer) or due to reclosing actions following the opening of circuit breaker to clear a fault. 3. Most of the recordings (70%) from a medium voltage network present a distinctive voltage signature, i.e. they can be characterised in terms of voltage. These recordings present either voltage dips (due to faults or transformer energising) or step changes in voltage due to load switching or voltage compensation related events. 4. A number of fault-type dips are of very short duration: less than three cycles. These may be associated with fault clearing by fuses, due to self-extinguishing faults, or other phenomena. A further investigation of the recordings and of the various fault-clearing mechanisms is needed. There is a recognised need for automatic processing of the recordings that are obtained from power quality monitors because of the large size of the created databases. Towards this direction the distinctive characteristics of the different types of voltage dips are given in section 111. The method can also be used as a basis for more sophisticated event characterisation. An additional classification and characterisation algorithm can be applied to fault-type events, e.g. as proposed in [ I 11. This method characterises the event in such a way that the characteristics do not change when the disturbance propagates to lower voltage levels.
- 750
*
VII. ACKNOWLEDGEMENTS This work is funded through the Elektra program, which is jointly financed by Energimyndigheten, ABB Corporate Research and ABB Automation Products AB. The authors are thankful to Scottish Power, Goteborg Energi Nat AB and SINTEF Energy Research for kindly offering the measurements that were presented in this paper. VIII. REFERENCES [I] M.H.J. Bollen, Understanding power quality problems: voltage sags and intenuptions. New York: IEEE Press, 1999. [2] L. Conrad, K. Little, C. Grigg, "Predicting and preventing problems associated with remote fault-clearing voltage dips", IEEE Transactions on Industry Applications, vol. 27, no. I , January-February 1991, pp. 167 -172. [3] M.H.J. Bollen, "Characterisation of voltage sags experienced by threephase adjustable-speed drives", EEE Transactions on Power Delivery, vol. 12, no. 4, Oct. 1997, pp. 1666-1671. [4] D.L. Brooks, R.C. Dugan, M. Waclawiak, A. Sundaram, "Indices for assessing utility distribution system RMS variation performance", IEEE Transactions on Power Delivery, vol. 13 no. I , January 1998, pp. 254-259. [5] I.Y.H. Gu, M.H.J. Bollen, "Time-frequency and time-scale domain analysis of voltage disturbances", to appear in IEEE Transactions on Power Delivery, 2000. [6] M.H.J. Bollen, "Fast assessment methods for voltage sags in distribution systems", IEEE Transactions on Industry Applications, vol. 32, no. 6, November-December, 1996, pp. 1414-1423. [7] K.S. Smith, L. Ran, B. Leyman, "Analysis of transformer inrush transients in offshore electrical systems", IEE Proceedings in Generation, Transmission, Distribution, vol. 146, no. I , January 1999, pp. 89-95. [8] S.H. Horowitz, A.G. Phadke. Power system relaying, Research Studies Press and John Wiley, Somerset, UK, 1992. [9] H.S. Bronzeado, P.B. Brogan, R. Yacamini, "Harmonic analysis of transient currents during sympathetic interaction", IEEE Transactions on Power Systems, vol. I I , no. 4, November 1996, pp. 205 1-2056. [IO] Varapom Lawskool, "Analysis and automatic classification of voltage dips measured in electric distribution networks", MSc thesis, Dept. of Signals and Systems, Chalmers University of Technology, Gothenburg. Sweden, March 2OOO. [ I I ] L.D. Zhang, M.H.J. Bollen, "A method for characterising unbalanced voltage dips (sags) with symmetrical components", to appear in E E E Transactions on Power Delivery, 2000.
VIIII. BIOGRAPHIES Emmanouil Styvaktakis received his BSc in Electrical Engineering from the National Technical University of Athens, Greece, in 1995 and his MSc in Electrical Power Engineering from the University of Manchester Institute of Science and Technology in 19%. He is currently a research assistant in the Department of Signals and Systems at Chalmers University of Technology, Gothenburg, Sweden, working towards his PhD degree. His research interests is signal processing applications in power systems and power quality. Math H.J. Bollen (M'94, SM'96) is a professor in electric power systems in the Department of Electric Power Engineering of Chalmers University of Technology, Gothenburg, Sweden. He received the MSc and PhD degrees from Eindhoven University of Technology, Eindhoven, The Netherlands, in 1985 and 1989, respectively. Before joining Chalmers in 1996 he was a research associate at Eindhoven University of Technology from 1989 to 1993, and a lecturer at University of Manchester institute of Science and Technology between 1993 and 19%. His research interests cover various aspects of power quality and reliability. He has published a number of fundamental papers on voltage dip analysis and a textbook on power quality. Math Bollen is cochair of the IEEE-IAS Power System Reliability Subcommittee and active in several IEEE working groups on power quality. bene Y.H. Gu obtained her MSc degree from East China Normal University, China, in 1984, and her PhD degree in electrical engineering from Eindhoven University of Technology, The Netherlands, in 1992. She was a research fellow at Philips Research Institute IPO (NL) and Staffordshire University (UK),and a lecturer at the University of Birmingham (UK) during 1992-1996. She joined the Department of Signals and Systems at Chalmers University of Technology, Sweden, in September 1996 and is currently an associate professor there. Her current research interests include time-frequency signal analysis and applications, image processing and object recognition.