... from the stand- point of our amazing ability to differentiate a large number of ... explanation for the CR classification advantage is the race- feature hypothesis ...
Journal of Experimental Psychology: Learning, Memory, and Cognition 1996, Vol. 22, No. 6, 1364-1382
Copyright 1996 by the American Psychological Association, Inc. 0278-7393/96/$3.00
Classifying Faces by Race: The Structure of Face Categories Daniel T. Levin Cornell University This article explored the finding that cross-race (CR) faces are more quickly classified by race than same race (SR) faces. T. Valentine and M. Endo (1992) modeled this effect by assuming that face categories can be explained on the basis of node activations in a multidimensional exemplar space. Therefore, variations in exemplar density between and within face categories explain both facilitated classification of CR faces and the relationship between typicality and classification RT within face categories. The present findings from classification and visual search tasks suggest that speeded classification of CR faces is instead caused by a quickly coded race feature that marks CR but not SR faces. Also, systematic manipulations of facial typicality cause no variation in classifiability aside from slowed classification of very distinctive faces. These results suggest that the exemplar model cannot explain important aspects of face classification.
Although face perception is usually studied from the standpoint of our amazing ability to differentiate a large number of faces, representations of face categories are also important. The process of categorizing individual faces has a number of implications both for general models of classification and for understanding face identification. The focus here is on the apparently paradoxical finding that participants are faster to classify faces they have difficulty recognizing. In the present case, this means that White participants classify Black or Asian faces faster than White faces (Levin, 1989; Valentine & Endo, 1992). In attempting to understand facilitated classification of cross-race faces (hereinafter referred to as the CR [cross-race] classification advantage), the present research considers explanations for the CR classification advantage as they relate to the basic structure of face categories, both in terms of discrimination between categories and in terms of their internal structure. Three explanations for the CR classification advantage are tested here. The first, stemming from Valentine's (1991) multidimensional space framework, places the advantage in the context of an exemplar model of face classification and recognition. This model uses simple assumptions based on abstract similarity relations among faces to unite a wide variety of effects including the CR classification advantage and the effects of facial typicality on recognition and classification. The second explanation for the CR classification advantage, the interference hypothesis, suggests that expertise-based configural coding interferes with coding race. Because configural
coding is less predominant in CR faces, they escape some of the interference and are therefore easier to classify. The final explanation for the CR classification advantage is the racefeature hypothesis, which suggests that race is coded directly for CR faces, whereas same-race (SR) faces are coded in terms of the absence of race-specifying information. In the sections that follow, each of these three hypotheses is examined in turn.
The Multidimensional Space Hypothesis
Portions of this work were presented at the May 1995 Association for Research in Vision and Ophthamology conference in Fort Lauderdale, Florida. I would like to thank Frank Keii, James Cutting, Dan Simons, David Dunning, Julia Noland, and Jonathan Schooler for reading and commenting extensively on previous versions of this article; Beena Khurana for suggesting I do a visual search for race and for all her subsequent help in setting up the experiments; and Eduardo Mordujovich for assisting in Experiment 3. Correspondence concerning this article should be addressed to Daniel T. Levin, Department of Psychology, Corneil University, Uris Hall, Ithaca, New York 14853-7601. Electronic mail may be sent via Internet to DTL1 @eornell.edu. 1364
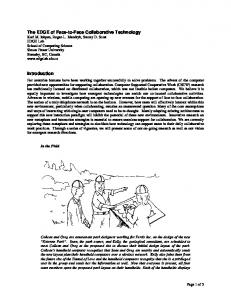
The first explanation of the CR classification advantage is provided by the multidimensional space model of face encoding and classification described by Valentine (1991) and Valentine and Endo (1992). This model is intended to provide an account of several findings including effects of distinctiveness and race on face recognition. According to the multidimensional space model, a face is encoded as a point in an n-dimensional space where the distance between any two nodes is analogous to their psychological similarity. Figure 1 is an example of such a space in which familiar individual faces are represented as points, and two face categories (such as races) are represented as different clouds of points. Faces are identified and classified by encoding them to a given location in the space and then evaluating the resulting pattern of activation in nearby nodes. When identifying a previously seen face, the nearest and therefore most active node will be chosen as the correct one for that face. Identification will be easier for faces that activate one specific node to the exclusion of others and more difficult if several neighboring representations are activated to similar degrees. Classification is achieved by summating the total activation of all nearby nodes. Increased total activation of nodes in a given group leads to faster classification. The multidimensional space model is important because it provides a systematic explanation for findings that distinctive faces are easier to recognize than typical ones (Going & Read, 1974; Light, Kayla-Stuart, & Hollander, 1979; Valentine & Bruce, 1986b) but are harder to classify (normal vs. jumbled configuration of features; Valentine, 1991). In this case, the model assumes that face categories are characterized by
FACE CATEGORIES Santo-Race Flmee
44-
4-
Crmm-Race Farm
+4-
4t-
~
Figure 1. A multidimensional face space. Same-race faces on the left are represented by a large cloud containing many exemplars, and cross-race faces are represented in a smaller, more dense area of the space (as in Valentine, 1991).
exemplar-density gradients in which proximity to the center of the category is associated with a large number of exemplars per unit area. Therefore, increasing typicality causes faster classification due to increased activation of neighboring exemplars, whereas it causes reduced recognition accuracy due to decreased specificity in activation of the correct node. The model can also explain CR face recognition and classification by assuming that the cloud of nodes representing CR faces is more dense than the SR cloud (see Figure 1). That is, CR faces are more psychologically similar to each other. Recognition is impaired because an individual face activates many neighboring representations, whereas classification is facilitated because the overall activation of exemplars from the group is high. The deficit in recognition accuracy is well documented, and as mentioned before, Valentine and Endo (1992) confirmed the improvement in classification by showing that participants classify CR faces faster than SR faces. The multidimensional space model therefore provides an excellent fit to current data and correctly predicts the CR classification advantage on the basis of simple generalizable principles stemming from variations in exemplar density. Given the importance of exemplar density in explaining face classification and given that exemplar density parsimoniously links within-category effects and between-category effects, it is worthwhile to take a close look at within-category variations in face classifiability. The multidimensional space model posits a graded internal structure for face categories. Although this implies that the relationship between facial distinctiveness and classification reaction time (RT) is a function with some positive slope, the exact form of this relationship is unknown. The only directly relevant findings come from Valentine (1991) and Valentine and Endo (1992) who showed that average classification RT for a group of distinctive faces is greater than that for a group of typical faces. This could be caused by a number of different distinctiveness-classifiability relationships ranging from a linear one in which variation in distinctiveness throughout the face category affects cla~isitiability to a nonlinear relationship that depends only on slowed classification of very distinctive faces. The exact shape of the distinctiveness--classifiability relationship is important here because both of the competing explanations for the CR classification advantage would suffer reduced parsimony if it were found to be linear and therefore to cover a
1365
broad extent of face space. As discussed in the next sections, both of these hypotheses have little to say about withincategory variation in classifiability. In particular, the racefeature hypothesis assumes that classification RT is controlled by a unitary race-specifying feature, which would presumably be instantiated in a nearly equal fashion across most CR faces. Given this, broad differences in within-category classifiability would necessitate a dual model of face classification where the multidimensional space model is retained to explain withincategory classifiability, whereas it is dispensed with in explaining between-category classifiability. However, separating a continuously graded exemplar space from one where only the most distinctive faces drive the classification-distinctiveness relationship is problematic because it has previously been difficult to accurately determine the typicality of a realistic face. Participant ratings of typicality are often used, but these are not precise enough to separate a linear typicality-classifiability function from a nonlinear one. It is also difficult to determine the exact basis of participants' distinctiveness ratings across faces (Rhodes & Moody, 1990). Such ratings could confound a variety of factors with distinctiveness, such as attractiveness or membership in a given ethnic subgroup. The present research therefore confronts this problem by distorting faces to make them more or less typical with an algorithm originated by Brennan (1985). It involves systematically mapping the features of a face by defining a series of key points that outline critical facial features such as the eyes, nose, and jawline. This map can then be distorted to be more or less similar to the map of an average face. In summary, the multidimensional space model explains the CR classification advantage by appealing to broad principles stemming from variation in exemplar density, both within categories and between categories. In Experiments 1-4, participants classified faces systematically manipulated in terms of distinctiveness to test the generality of the relationship between classification RT and distinctiveness. Although this served to illuminate the internal structure of face categories, a direct test of the model's explanation for the CR classification advantage is more difficult. This is because the model does not specify the information that makes up the dimensions of face space. Therefore, any finding in which the CR classification advantage is eliminated can be assimilated by simply assuming that the manipulation has effectively eliminated the relative difference in exemplar density between the races. The two competing explanations for the CR classification advantage, the interference hypothesis and the race-feature hypothesis, attempt to specify processes for which the multidimensional space model does not account. As such, the multidimensional space model's explanation for the CR classification advantage was tested by contrast with these alternatives. The Interference Hypothesis In this hypothesis, the configuration of SR faces is coded automatically and interferes with the coding of other types of information (e.g., race). Assuming that people do not code the configuration of CR faces, classification of SR faces would be slowed relative to CR faces. The assumptions inherent to this hypothesis are well grounded in previous research.
1366
LEVIN
A number of findings suggest that we code individual faces by making use of subtle deviations in the configuration of facial features (Carey & Diamond, 1977). Much of the support for the existence of configural encoding is based on the wellknown face-inversion effect. Yin (1970) found that inverting faces decreases recognition accuracy more than inverting other kinds of objects such as houses. This is probably because inversion differentially disrupts configural or holistic encoding (Farah, Tanaka, & Drain, 1995; Rhodes, Brake, & Atkinson, 1993; Tanaka & Farah, 1993). In addition, Diamond and Carey (1986) suggested that a high degree of expertise is required to do configural encoding. They found that expert dog show judges showed an inversion decrement when recognizing dogs, which is comparable with that observed for faces, whereas less experienced participants showed no such effect. The first important assumption made by the interference hypothesis is that configural encoding interferes with coding the race of a face. Evidence in support of this comes from Young, Hellawell, and Hay (1987). Here, participants were asked to name the celebrity depicted in the top half or the bottom half of composite pictures. In some of the stimuli, the halves were correctly aligned to form a coherent looking face, whereas others were misaligned considerably. Participants in this experiment took considerably longer to name parts of aligned faces, which suggests that the presence of a coherent face configuration interfered with their ability to code one of the halves in isolation. In addition, disrupting configural processing by inverting the faces eliminated the effects of face alignment. Other data, from research by Suzuki and Cavanagh (1995), reinforce the conclusion that coding facial configuration can interfere with extracting other information about the face. Using a visual search paradigm, they found that a conjunction search for a target defined by the presence of upward and downward arcs was slowed when the arcs were part of a correctly configured schematic face (where one of the arcs represented a smiling or frowning mouth) as compared with a search for the arcs in stimuli that shared the same low-level features as the faces but did not appear to be faces. The interference hypothesis assumes that coding the race of a face is similarly interfered with by configural coding. The interference hypothesis also assumes that CR face coding represents a sufficiently low level of expertise such that CR faces are not encoded configurally. Accordingly, the CR recognition deficit (e.g., Shapiro & Penrod, 1986) is a consequence of participants' inability to adequately encode the configuration of the faces. This leads to the prediction that the inversion effect should be greater for SR faces. Rhodes, Tan, Brake, and Taylor (1989) confirmed this prediction, using White and Asian faces with White and Asian participants. The inversion decrement in recognition was much smaller for CR faces than for SR faces (but see Valentine & Bruce, 1986a, for the opposite finding). Other less equivocal data on verbal overshadowing converge to support the assumption that CR faces are not encoded configurally. Schooler and Engstler-Schooler (1990) found that verbalizing facial features can actually reduce recognition accuracy. They argued that the best representation of a face depends on nonverbalizable information about holistic structure or configuration. Verbalizing the features of a face causes
this accurate information to be overwritten with inherently less accurate information about individual facial features. If CR faces are not coded configurally, then the verbal overshadowing effect should not occur for them. Fallshore and Schooler (1995) reported data showing that White participants indeed do not show verbal overshadowing with CR faces. They also show no verbalization effect for inverted SR faces. In summary, configural encoding allows us to recognize faces with maximum efficiency. Furthermore, the CR disadvantage in recognition may be due to participants' inability to extract configural information from these faces. Yet, coding the race of CR faces is easier because configural processing does not interfere. This hypothesis is easily tested. Interfering with configural encoding should eliminate the CR classification advantage just as it eliminates the CR recognition disadvantage, the verbal overshadowing effect, and Young et al.'s (1987) alignment effect. This is the purpose of Experiment 4 in which participants classified inverted faces. T h e R a c e - F e a t u r e Hypothesis Another explanation for the CR classification advantage has less to do with expert coding of individuality in SR faces than with expert coding of race in CR faces. This might be rooted in a tendency to consider members of a group outside of one's own (an outgroup) to be more homogeneous than those within one's own group ( a n / n group; Linville, Fischer, & Salovey, 1989). Groupings can range from different races to different academic majors. We might, therefore, consider out-group membership to be more informative than in-group membership when making a variety of judgments about people. For example, participants are more likely to use gender or race schemas to recall information about a person who is of a different gender or race (Frable & Bern, 1985). The CR classification advantage would, therefore, arise not from an interfering individuation process, but rather from a facilitated classification process. Increased use of out-group labels and schemas could have a number of different consequences. It might affect the fundamental structure of race and gender categories in a manner analogous to gender marking in which femaleness is considered a deviation from a norm of maleness and is therefore more frequently specified (Bern, 1993). In this account, gender is the presence or absence of femaleness, whereas maleness per se is not specified. In the race-feature hypothesis, the same thing happens for race. In the case of White individuals, race is not coded as Black or White; it is coded as Black or not Black. In such a case, race would be coded in terms of the presence or absence of a marked race-specifying feature for out-group races. This would lead to the CR classification advantage, assuming it is easier to determine the presence of a feature than its absence. It is important to note that the CR classification advantage depends not only on out-group status, but also on small out-group size. Large out groups are much less likely to be coded with a race feature because features defining the group are less useful for making inferences. As Mullen (1991) argued, being a member of a minority group is different from being a member of a majority group in that for minorities the
FACE CATEGORIES out group is much more likely to contain salient individuals. In addition, Mullen reviewed evidence suggesting that minority group members tend to see their own group as more salient. Both of these factors suggest that race-feature coding is most likely to occur where the in group is also the majority. Where the in group is a minority, predictions made by the race-feature hypothesis are unclear, but it is likely that neither group will be coded with a race feature. In Experiment 6, therefore, the generality of the race-feature hypothesis was tested with three groups of participants. In addition to White and African American participants, a group of native Africans was tested under the assumption that they would have experienced White faces as a minority out group and therefore would have the greatest chance of coding White faces by using a race feature. The race-feature hypothesis emphasizes an important point. The cognitive context in which object recognition takes place may be critical to understanding even the most simple classifications. The difference between SR and CR face coding is more than just a question of skill. Faces are coded in a specific cultural context which not only affects the kind of information people seek from them, but also may affect how people code facial features. According to the race-feature hypothesis, the way in which a Black person differs from a White person (and not the way in which a White person differs from a Black person) might be a perceptually salient facial feature just like an eye or a nose. This hypothesis was tested in Experiment 5 by having participants search for SR or CR target faces in a field containing a varying number of distractor stimuli. In this paradigm, detecting a feature-positive target is easier than detecting a feature-negative target, leading to the prediction that the marked CR face is more quickly located than the SR face. The logic behind the visual search paradigm is explained in the introduction to Experiment 5.
1367
explored the CR classification advantage by using a simple classification paradigm in which participants classified a series of faces by race (Black or White). Experiments 1 and 2 are replications of the basic CR classification advantage, which used different kinds of stimuli: line drawings of faces and photographic-quality gray-scale faces. As such, Experiments 1-3 tested the robustness of the CR classification advantage with very different stimulus sets. Experiments 1-3 also explored the internal structure of face categories by having participants classify prototypicallydistorted faces and caricatures, both by race and by feature configuration. As discussed in the second part of the article, predictions stemming from the interference and race-feature hypotheses were tested. Experirnent 4 is a test of the interference hypothesis in which participants classified inverted faces, and Experiments 5 and 6 tested the race-feature hypothesis with a visual search paradigm.
Experiment 1 In this experiment, participants classified individual Black and White faces by race. The faces were realistic line drawings made on the basis of photographs. In addition to classifying undistorted faces, participants classified prototypical and caricatured distortions of these faces. The distortion process is based on the one described by Brennan (1985) and allows faces to be adjusted to look more or less like the average face for each race. In addition, the averages themselves were included in the stimulus set. The basic purpose of the experiment was to confirm the CR classification advantage and to explore the internal structure of CR and SR face categories. In addition, both familiar and unfamiliar faces were used in this experiment and in Experiments 2 and 4 to ensure the generality of the CR classification advantage.
Summary and Predictions The present research attempts to understand face categories by looking closely at race classifications and at visual search for a target defined by race. This exploration is organized around the CR classification advantage and three hypotheses that attempt to explain it. The multidimensional space hypothesis suggests that increased psychological similarity among CR faces causes faster classification. Its predictions are based on assumptions about the global similarity structure of face categories, both between and within categories. Variation in density between categories causes the CR classification advantage, whereas density gradients within categories cause typical faces to be more quickly classified than distinctive ones. The other two explanations for the CR classification advantage are the interference hypothesis and the race-feature hypothesis. The interference hypothesis explains the CR classification advantage in terms of the costs of automatic configural encoding. According to this hypothesis, inverting the faces should eliminate the CR classification advantage. Finally, the race-feature hypothesis predicts that CR faces should be more quickly located in a standald visual search paradigm because they are marked by the presence of a visual race feature, whereas SR faces are defined by its absence. Experiments 1-3 make up the first part of the article. They
Method Participants. Thirty-one Cornell undergraduates completed the present experiment. Of these, 5 were dropped because of computer problems. Three additional participants were eliminated from the analysis because they did not meet the criterion of 7% or fewer classification errors. These participants misclassified 11%, 11%, and 10% of the faces, leaving 23 White participants (11 male) in the final data set. Stimuli. The stimuli were line drawings of famous and unfamiliar male faces based on original photographs and pictures from magazines and books. All pictures were full front poses, with neutral facial expression. The set of 16 faces used in the experiment was taken from a larger pool of 26 faces on the basis of distinctiveness (How well would this person stand out in a crowd?) and familiarity ratings of 13 judges. From this pool, 16 faces were selected (8 Black and 8 White, 8 famous and 8 unfamiliar) to equalize distinctiveness and familiarity ratings between the races. The group of famous Black faces had a mean distinctiveness rating of 5.16 (7-point scale; 7 = very distinctive) and a mean familiarity rating of 5.26 (7-point scale; 7 = very familiar). The familiar White faces had a mean distinctiveness rating of 5.19 and a mean familiarity rating of 5.30. Unfamiliar Black and White faces had mean distinctiveness ratings of 4.28 and 4.37, respectively, and mean familiarity ratings of 1.86 and 1.67, respectively. Line drawings of each face were created in a manner similar to that used by Rhodes, Brennan and, Carey (1987). For each face, a series of
1368
LEVIN
232 points, which made up 39 lines representing facial features, were input into the computer by hand. There was one significant departure from Rhodes et al.'s method. Instead of connecting the points with a smooth curve defined by the spline through the points in each line, the points were connected with straight lines. This was done to avoid the tendency of splines to trace features by a mathematical fit instead of by the actual contours on the face. To provide sufficient resolution to avoid unnatural contours, additional points were added to the nose and eyes. Line drawings were then distorted to look either more prototypical or less prototypical. First, a prototype face for each race was created by averaging the X and Y coordinates of each point on the face drawings across the 8 faces in each race. Once the prototype was created, the original line drawings were prototypically distorted by moving the points defining each face on a linear path toward the points on the prototype face. The degree of distortion is simply the percentage of the distance that the points migrate between the exemplar face and the prototype. A - 5 0 % distortion is, therefore, a distortion in which the points on the exemplar face move halfway to the prototype. This process can also be used to make faces look more distinctive, producing caricatures. This was done by moving points on a line extrapolated away from the prototype, the distortion of which is again defined on the basis of corresponding points on the prototype and exemplar faces. A 25% distortion is a migration away from the prototype, which is equivalent to 25% of the distance between the prototype face and the exemplar face. For the present experiment, -50%, - 3 3 % , - 1 6 % , 16%, 33%, and 50% distortions of each face were created. Including the undistorted face, participants therefore saw seven different versions of each of the 16 faces. Figure 2 contains a sample set of distortions for 1 face. Apparatus. Stimuli were presented on Macintosh LC computers using Superlab (Cedrus Software). Stimulus size on the screen was approximately 13 cm (vertical) x 9 cm (horizontal). Participants were seated in front of the monitor with a viewing distance of approximately 45 cm and responded on the computer keyboards. Procedure. Participants were tested in small groups of 1 to 8 on individual computers in the same room. All instructions were presented on the computer. Participants were instructed to sort the faces by race, pressing the 1 key for one race and the 2 key for the other. Assignment of a race to each key was alternated between participants, and a small cardboard reminder of which key to press for each race was placed on the keyboard. Instructions emphasized the need to "respond as quickly as possible without sacrificing accuracy" and informed participants that a low error rate was necessary for their data to be
useful. After reading the instructions, participants completed a practice sort containing a set of seven distortions of each of 4 faces, then sorted the full set of 114 faces (112 distorted and undistorted exemplars and the 2 prototypes) three times. On each trial, a single face was presented in a response-terminated display. Feedback in the form of a brief tone was given for incorrect responses during the first half of the
Prototype
-60% Distortion
Undlstort~l
Table 1
Analysis of Variance for Experiment I Source
F
df
MSE
p
Race (R) Familiarity (F) R x F Distortion level (D) R x D Block (B) R x B F x D × B
24.46 5.32 18.07 3.63 8.01 29.71 11.69 1.98
1, 22 1, 22 1, 22 6, 132 6, 132 2, 44 2, 44 12, 264
0.294 0.090 0.044 0.030 0.028 0.265 0.059 0.021
.0001 .0309 .0003 .0023 < .0001 < .0001 .0001 .0262
practice set and was discontinued thereafter. Faces within each block were presented in random order.
Results F o r E x p e r i m e n t s 1-4, all R T s were subjected to a logarithmic t r a n s f o r m a t i o n , R T s m o r e t h a n 3 SDs above the m e a n were eliminated, a n d R T s from e r r o r trials were eliminated. T h e average e r r o r rate was 2.7% (range: 0 % to 6.0%). Classification times were e n t e r e d into a R a c e ( B l a c k - W h i t e ) x Familiarity ( f a m i l i a r - u n f a m i l i a r ) x D i s t o r t i o n Level ( - 5 0 , - 3 3 , - 1 6 , 0, 16, 33, a n d 50) x Block (1, 2, a n d 3) withinparticipants analysis of variance ( A N O V A ) . All RTs pres e n t e d in figures a n d in the text are b a c k t r a n s f o r m e d a n d r e p o r t e d in milliseconds. A n a l p h a level of .05 was used in all e x p e r i m e n t s as the criterion for rejecting null hypotheses. T h e primary result of interest was the significant m a i n effect of race with Black faces classified m o r e quickly t h a n W h i t e faces (744 ms a n d 841 ms, respectively; see T a b l e 1 for c o m p l e t e A N O V A results). T h e distortion-level effect was also significant as was the Race x D i s t o r t i o n Level interaction. Simple effects suggest t h a t the effect of distortion was larger for Black faces, F(6, 1 3 2 ) - - 8 . 9 9 , MSE --0.030, t h a n for W h i t e faces, F(6, 132) = 2.27, MSE = 0.028; see Figure 3. A l t h o u g h t h e Race x Familiarity interaction was significant, t h e C R classification a d v a n t a g e was significant for b o t h familiar a n d unfamiliar faces: unfamiliar, F(1, 22) = 39.74, MSE = 0.161; familiar, F(1, 2 2 ) = 9.21, MSE = 0.177. Pairwise c o m p a r i s o n s b e t w e e n u n d i s t o r t e d stimuli a n d all prototypically distorted stimuli in all four Familiarity x Race cells show t h a t in n o case were prototypical distortions classified m o r e quickly t h a n u n d i s t o r t e d faces ( D u n c a n tests in all cases). 1 A d d i t i o n a l pairwise c o m p a r i s o n s were m a d e b e t w e e n classification times for caricatures a n d prototypical distortions. F o r
50% Distortion
Figure 2. Sample line-drawing distortions: John F. Kennedy. The negative number denotes a prototypical distortion, and the positive number denotes a caricature.
1 Because different versions of the same face repeat over trials, it is necessary to confirm the effects of distortion on classification time by using only the first presentation of each face. In particular, the lack of a prototype advantage needs to be confirmed. This was done by regressing distortion level on classification RT by using only undistorted and prototypically distorted faces and by using only the first presentation of each face in the first block. This analysis yielded no significant linear relationship between distortion level and classification time for Experiment 1, F(1,184) = 0.13, MSE = 0.217,p = .7212, or for Experiments 2 or 4 where similar procedures were used, F(1, 1017) = 0.11, MSE = 0.075,p = .7366; F(1,362) = 0.33, MSE = 0.094, p = .568, respectively.
FACE CATEGORIES
1369
900
850 ¢
Black Unfamiliar
"-
Black Familiar
•
White Unfamiliar
rso ----..-0
White Familiar
7OO
650
-50
-33
I
I
I
I
I
-16
0
16
33
50
Distortion Level
Figure 3. Reaction times (RTs) to classify distorted line drawings of faces. Negative distortions are prototypical, and positive ones are caricatures.
Black faces, the 16% caricatures were classified more slowly than the - 1 6 % , - 3 3 % , and - 5 0 % distortions (Duncan tests). Also, the 33% and 50% caricatures were classified more slowly than undistorted faces and all of the prototypical distortions (Duncan tests). For White faces, undistorted drawings and the 16% caricatures were classified significantly faster than the - 5 0 % prototypical distortions (Duncan tests). The main effect for block was significant. Classification times significantly decreased across blocks (Block 1:890 ms, Block 2:778 ms, Block 3:715 ms; Duncan tests). The Race x Block effect was also significant. The CR classification advantage became smaller over the three blocks (176 ms in Block 1, 66 ms in Block 2, and 60 ms in Block 3), although it remained significant in each case (Duncan tests). A separate analysis was done to compare classification times for prototype drawings and undistorted drawings of unfamiliar faces. In this case, data were entered into a Stimulus Type (prototype-undistorted exemplar) x Race (Black-White) A_NOVA. This analysis indicated that the difference in classification time between prototype drawings and undistorted drawings was not significant (mean RT for prototype: 800 ms, mean RT for undistorted exemplars: 761 ms), F(1, 22) = 0.77, MSE = 0.065. The Stimulus Type x Race interaction was also nonsignificant, F(1, 22) = 0.27, MSE = 0.043.
Discussion In general, Experiment 1 clearly replicated the CR classification advantage. There also seem to have been some clear effects of distortion on classification time, but mostly for CR faces for which classification was slowed by caricaturing. The lack of a classification advantage for either prototypically distorted stimuli or the prototype faces themselves suggests that the structure of face categories might indeed be more uniform than previously assumed. These results suggest that previously observed typicality advantages in classification might
be better characterized as atypicality disadvantages. This is discussed thoroughly after the internal structure of face categories is more clearly established in Experiments 2 and 3. Experiment 2 Experiment 2 is a replication of Experiment 1 with photographic quality images. If the CR classification advantage is again observed, then it is unlikely to be caused by low-level features inherent to the particular stimuli used in either experiment. In addition, an SR and CR face-recognition test was added to the procedure to test the hypothesis that the CR classification advantage is related to experience with the two sets of faces. On the basis of this test, a group of White participants who showed no CR recognition deficit was isolated. The existence of such individuals was confirmed by Li, Dunning, and Malpass (1994), who found that White basketball fans who had had extra practice in recognizing Black faces showed no CR recognition deficit. In the present case, the group showing no CR recognition deficit should also show no CR classification advantage. Participants also rated the distinctiveness and familiarity of the faces they sorted. This was done to confirm the ratings of the judges and to test for a correlation between distinctiveness ratings and classification times.
Method Partic~oants. Fifty-six White Cornell University undergraduates (47 female) participated in the present experiment in exchange for course credit. All participants met the 7% error criterion. Stimuli. The stimuli were faces similar to those used in Experiment 1 except that they were photographic-quality gray-scale images instead of line drawings. These are very similar to stimuli used by Benson and Perrett (1991). In addition to the 16 faces used in Experiment 1, 16 additional faces were chosen from a new pool of 26 faces. The same selection procedure was used with 12 judges rating familiarity and
1370
LEVIN
distinctiveness. The 16 new faces were again matched for distinctiveness and familiarity across races. The mean rated distinctiveness for the new Black and White familiar faces was 4.96 and 4.91, respectively. Mean distinctiveness ratings for Black and White unfamiliar faces were 4.55 and 4.57, respectively. Mean familiarity ratings were 5.38 for famous Black faces and 5.47 for famous White faces. In addition, mean darkness and contrast of the images were equated across the races. The new combined group of faces contained 8 faces in each of the four cells of the Familiarity x Race design for a total of 32 faces. Face distortions were created in a manner similar to that used in Experiment 1. The Morph program from Gryphon software was used for this purpose. The program continuously transforms one object onto another by distorting the shape of the objects and simultaneously averaging the luminance information. Because the program functions with only two objects at a time, the 16 faces for each average were arbitrarily combined into eight pairs. For each pair, a set of key points was defined that best described corresponding features on each face. The particular points used for each pair varied somewhat but followed the same general principles used to generate the line drawings for Experiment 1. When all points were defined, a new face was created that represented a blend of the two original faces. Once the 8 new faces were created from the original set of 16 faces, they were again combined into four pairs, and the process was repeated. The 4 resulting faces were then combined into 2 faces, which were finally combined into I face. The resulting face is an average of all 16 faces in the original set. Although this process is somewhat atypical, averages created this way were very similar to the separately created linedrawing averages (Figure 4). Once the averages were created for each race, prototypical and caricatured distortions were created. As in Experiment 1, the shape of each face was continuously and linearly distorted by moving the key points a certain distance from the original face toward or away from the prototype face. The faces were distorted only in shape with no averaging or extrapolation of luminance values. These were prototypical distortions and caricatures that were analogous to the line-drawing
Figure 4. Separately created line-drawing average and gray-scale average of the same set of faces.
Figure 5. Sample set of face distortions. Negative numbers denote prototypical distortions, and positive numbers denote caricatures.
caricatures used in Experiment 1. A set of sample stimuli appears in Figure 5. Sets of four distortions ( - 5 0 % , - 2 5 % , 25%, and 50%) were created for each face. This reduction in distortion levels from the seven used in Experiment 1 was necessitated by computer memory limitations. As in Experiment 1, negative distortions were prototypical, and positive ones were caricatures. There were, therefore, five different versions of each of 32 faces for a total of 160 stimuli. In addition, the 25% and - 2 5 % distortions were created from 4 other faces for use as practice stimuli. Stimuli for the face-recognition task were black-and-white slides of male faces from high school yearbooks. Photos were chosen that lacked unusual facial expressions or hairstyles. Apparatus and procedure. The race-sorting task was similar to that in Experiment 1 and used the same computers. There were 16 practice trials with two repetitions of two different distortions (25% and - 2 5 % ) of 4 faces. Feedback was given for the first 8 practice trials and was discontinued thereafter. Participants then sorted the entire set of 160 faces in a single block of randomly ordered trials with a short rest break after the 80th trial. The overall number of trials in the sorting task was reduced as compared with Experiment I because participants in Experiment 1 found the sorting task to be overly long. After completing the sorting task, participants completed the face-recognition test and rated the faces they had sorted for distinctiveness and familiarity. The order of the recognition and rating tasks was counterbalanced across alternate groups of participants. In the face-recognition task, participants first saw an inspection set of 32 (16 Black and 16 White) faces from high school yearbooks. They were told to pay close attention to the faces so they could complete an upcoming recognition test. Inspection-set slides were presented to participants by using a slide projector attached to an electronic timer, which showed the slides for 3 s with a 0.82-s pause between slides. The photographs were masked with cardboard cutouts that obscured clothes and backgrounds. The test set, containing 16 faces from the inspection set and 16 new faces (8 Black and 8 White), was shown to participants after a brief delay during which they were instructed on how to complete the recognition test form. Participants were instructed to record a y on the recognition test form if they had seen the
FACE CATEGORIES face in the inspection set and an n if they had not. Participants were also told that the best way to do the task was to decide on the basis of their first impression if the face was in the previous set. Recognitionset slides were then presented one by one for as long as necessary. For each group of participants, a new random ordering of slides was used. Finally, participants rated each of the 32 faces from the sorting task for familiarity and distinctiveness. Faces were presented without distortion on the same computers used for the face-sorting task. Participants were instructed to rate distinctiveness according to "the unusualness of the face, or how well the person would stand out in a crowd" on a 7-point scale ranging from veryund/st/nct/ve (rating of 1) to very distinctive (rating of 7).
1371
false-positive rate caused the race difference in recognition. There were 194 misses for Black faces and 190 for White faces, whereas there were 134 false positives for Black faces and 53 for White faces. This replicates previous research in which the race difference in recognition has been associated with an increased false-positive rate for CR faces (Valentine, 1991; Valentine & Endo, 1992). The selection described below was therefore based on the false-alarm data. On the basis of the recognition-test data, 16 participants were selected who showed no difference in recognition between Black and White faces or showed better recognition f o r Black faces. These participants were compared with the 39 remaining participants who completed the recognition test. (One participant who did not correctly complete the test form is not included here.) Classification RTs were entered into a two-variable Recognition Difference (none-high) x Race (Black-White) mixed-variables A_NOVA with recognition difference as the between-subjects variable. The Recognition Difference x Race interaction was nonsignificant, F(1, 53) = 2.24, M S E = 0.002,p = .1406, although the pattern of means was in the correct direction. There was no difference in classification times for the group that showed no CR advantage in face recognition (RT for Black faces: 614 ms, RT for White faces: 620 ms), F(1, 53) = 0.27, M S E = 0.002, whereas there was a significant classification-time difference for the group that did show the difference in recognition accuracy (RT for Black faces: 639 ms, RT for White faces: 663 ms), F(1, 53) = 12.80, M S E = 0.002. Effects o f distinctiveness. Average distinctiveness ratings and average classification RTs were computed across-subjects for each of the 32 faces. These were uncorrelated (r = -.01). The ratings of the judges were also uncorrelated with the participants' classification times (r = - . 1 9 ) . Distinctiveness ratings of the participants were significantly correlated with the judges' ratings (r = .68).
Resets Classification task. RTs were entered into a Group (BlackWhite) x Familiarity (familiar-unfamiliar) x Distortion Level ( - 5 0 % , - 2 5 % , 0, 25%, 50%) within-subjects ANOVA. The average error rate was 1.3% (range: 0% to 4.4%). The main effect of race was significant, replicating the CR classification advantage (mean RT for Black faces: 630 ms, mean for White faces: 651 ms), F(1, 55) = 11.97, M S E = 0.024. The main effect of distortion level was also significant, F(4, 55) = 9.86, M S E = 0.007. Unplanned comparisons indicate that the 50% distortions were classified significantly more slowly than the - 5 0 % , - 2 5 % , 0%, and 25% distortions (Duncan test) and that there were no significant differences in overall classification times among the other distortion levels (Duncan test; see Figure 6). No other interactions or main effects were significant. In no case were prototypical distortions classified more quickly than undistorted faces (Duncan tests in all Familiarity x Race cells). Recognition test. A ' scores (Rae, 1976) were computed separately for recognition of Black faces and White faces and entered into a one-variable ANOVA. (A' is a measure of decision accuracy that combines hits, misses, false positives, and correct rejections in an unbiased fashion. H i g h e r A ' scores are associated with increased accuracy.) The m e a n A ' score for Black faces (.6507) was significantly less than that for White faces (.8053), F(1, 54) = 17.33, M S E = 0.038. Separating errors into misses and false positives clearly shows that the
Discussion
The results from Experiment 2 replicate the essential parts of Experiment 1. The CR classification advantage was again
68O 670 66O
62O
¢
BlackUnfamiliar
--
BlackFamiliar
O
WhiteUnfamiliar
D
WhiteFamiliar
610
-50
-25
0
Distortion
25
50
Level
Figure 6. Reaction times (RTs) to classify gray-scale faces by race.
1372
LEVIN
significant. As in Experiment 1, there was no prototype advantage. In addition, distinctiveness ratings of undistorted faces were uncorrelated with RTs. This suggests the possibility that previous results showing a classification advantage for typical faces were being driven by slowed classification of very distinctive faces, which may not have been present in this experiment. The close similarity in the pattern of results between the two experiments suggests that neither the CR classification advantage nor the pattern of classification times across distortions is the result of idiosyncrasies in the stimuli. This is important because the classification advantage might be due to some aspect of the stimuli more basic than race. For example, if something inherent to the shading in photographs of Black people (aside from average brightness and contrast which were equalized across the races) reduces the discriminability of facial details, then speeded classification might result. This is not, however, a problem with the line drawings, which contain no shading information at all. Although it did not reach conventional levels of significance, the interaction between differential recognition of SR and CR faces and the CR classification advantage was in the expected direction. Participants who showed a large recognition difference also showed a significant classification time difference, whereas those who showed no CR recognition deficit showed no CR classification advantage. This finding helps to validate the CR classification advantage by linking it to some aspect of the participants' face-processing experience.
Experiment 3 One difficulty with interpreting the relationship between distinctiveness and classification RT is that the validity of the distortion process as a manipulation of facial distinctiveness has not been confirmed. Therefore, in Experiment 3 one group of participants rated the distinctiveness of face distortions, whereas another group classified them by configuration (normal vs. jumbled features). This task allows for a conceptual replication of Valentine's (1991) research in which the task was used to test the prediction that distinctiveness is inversely related tO classifiability. In addition, if a prototype advantage again does not appear, then it is less likely that its absence is due to peculiarities of the race classification. Another difference between this experiment and Experiments 1 and 2 is that a new average was generated from 8 new unfamiliar White male faces and was combined with the average of unfamiliar White faces from Experiment 2. Therefore, the present average contains no celebrities who might reduce its representativeness. Experiment 3 also used a set of distortions weighted more toward the prototypical (range: - 6 6 % to 33%) to provide an increased probability of observing a prototype advantage if it exists. Finally, different participants completed the rating task and the classification task to avoid the possibility of betweentask contamination. Method Participants. Thirty-fiveparticipants (13 male) completed the present experiment, 18 in the distinctiveness-rating task and 17 in the classification task. One participant was not included in the analysis
because of a 10% error rate, and another was not included because of very unusual classificationRTs (M = 1,851 ms, SD = 1,281 ms). Stimuli. Stimuli were four versions (-66%, -33%, and 33% distortions and the undistorted original) of each of 16 unfamiliar White male faces for a total of 64 faces. Eight of the faces were the unfamiliar White faces from Experiment 2, and 8 were new. These 16 faces were combined to make a new average, which was used as the basis for all distortions. Jumbled faces were created by exchanging the eyes with the nose and mouth of each face. This was done in a manner similar to that reported in Valentine (1991). Rectangular sections of equal width including the mouth-nose area and the eyes were simplyexchanged. Procedure. In the rating task, participants rated the 64 faces on a 9-point scale of distinctiveness (1 = very undistinctive, 9 = very distinctive). Stimulus order was randomized with the constraint that each of four successiveblocks of 16 faces contained one of the four versions of each face. The particular block that each distortion appeared in was rotated across subjects. Rating instructions were similar to those used in Experiment 2, and the apparatus was identical. In the classificationtask, participants classifiedthe faces by configuration (normal vs. jumbled). No analysis of the jumbled faces is presented because their only purpose was to act as foils in the classificationtask. Results
Distinctiveness ratings and classification times were averaged across subjects for each of the 64 stimuli. Distortion level was significantly correlated with rated distinctiveness (r = .60; Figure 7), whereas classification time was not (r = -.09). In addition, distinctiveness ratings were not correlated with classification times (r = .07). A polynomial regression was run on the rating data to test for significant nonlinearities. The distortion-squared term approached significance (t = 1.96,p = .0546). Table 2 contains the mean distinctiveness ratings and classification times for each distortion level.
~8
.m
o
o
o
W W
0 C 0
o
7
0
o
o
o
°
._> o
.E
O
0
0
0
~me
a o
-.8
-), -.2 Distortion
6
.a
.4
Level
Figure 7. Distinctiveness ratings of 16 unfamiliar White faces at four levels of distortion. Enlarged circles represent coincident data points.
FACE CATEGORIES Table 2 Mean Distinctiveness Ratings and Classification Times for 16 White Faces at Four Levels of Distortion Distinctiveness rating Distortion level -66 -33 0 33
M 4.45 4.65 5.35 6.54
SD 1.00 0.95 1.10 1.06
Classification RT (ms) M 525 515 521 513
SD 40 45 34 45
Note. For the distinctiveness rating, 1 = undistinctive and 9 = very distinctive. RT = reaction time.
Discussion The results of Experiment 3 confirm that the distortion process used here is a valid manipulation of distinctiveness and that substantial variation in rated distinctiveness is associated with no variation in classification time. However, the apparent nonlinearity in the data suggests that prototypical distortions might not cause as much of a change in apparent distinctiveness as caricatures. The data in Figure 7 suggest that this might be due to a floor effect given the apparent skew in ratings of the - 6 6 % distortions. In any case, the data make it clear that prototypical distortion and moderate caricaturing cause substantial changes in distinctiveness ratings that are associated with no change in classification time. The overall amount of change in ratings caused by the distortion process (covering 23% of a 9-point scale) is similar in magnitude to the differences in rated distinctiveness across groups of faces used in previous research (26% of the scale in Johnston & Ellis, 1995, Experiment 1 and 23% in Experiment 2; 25% in Valentine, 1991, Experiments 1 and 3; 26% in Valentine & Endo, 1992; Experiment 2). This suggests that the lack of differences in classification RT across distortion levels was not due to insufficient variation in distinctiveness. Discussion o f Experiments 1-3 Taken together, the results of Experiments 1, 2, and 3 make two clear points. First, the CR classification advantage is robust. Highly significant effects of race were observed in both Experiments 1 and 2. This was the case despite substantial differences in the nature of the stimuli in the two experiments, which clearly suggests that the CR classification advantage is not tied to any specific low-level perceptual differences in the faces themselves. Line drawings of faces containing no color information and little information about underlying bone structure showed the CR classification advantage as did photographic-quality images that contained a large amount of information irrelevant to race or identity. The second major way in which these experiments are consistent is that they uniformly showed no classification advantage for prototypically distorted faces. In three separate instances with different averages, different (albeit overlapping) stimulus sets, and different tasks (race classification and classification by configuration), no prototype advantage was observed. In addition, rated facial distinctiveness was uncorre-
1373
lated with classification RT across both individual faces and different distortions of faces. The only consistent effect distinctiveness had on classification was a slight increase in classification RTs for highly caricatured faces. This suggests that previous findings linking facial distinctiveness to classification RT need to be reinterpreted. Instead of suggesting a global and continuous relationship between distinctiveness and classifiability, these results suggest that there is little relationship for most faces. Previous results such as Valentine (1991) and Valentine and Endo (1992) may therefore rest on slowed classification of the most distinctive faces in a given stimulus set. It might be argued that the manipulations of distinctiveness presented here are insufficient to test the relationship between distinctiveness and classifiability. Perhaps the distortion process does not make faces prototypical enough to have a substantial effect on classification RT. Although the distortion process does leave some aspects of the gray-scale faces relatively unchanged (skin folds for example), the manipulation produced a significant change in distinctiveness ratings similar in size to that reported in previous research. This variation was associated with no change in classification time. Also, for the line drawings in Experiment 1, there was no information that was unaffected by the distortion process. In this way, the line drawings are very similar to stimuli used in previous research on novel object categories, which have continuously variable shapes, and allow for complete control over the degree to which an exemplar matches a prototype. Again, no classification advantage was observed for prototypical distortions or for the prototypes themselves. The common finding across both Experiments 1 and 2 is that the only effect distinctiveness had on classification time was slowed classification for the 50% caricatures. As such, these findings are consistent, and they are also not negative findings. There was a small effect of distinctiveness, but it was limited to highly caricatured faces. The most important question to ask about these data is whether they are really counter to the multidimensional space model. Generally, it is difficult to discern the amount of variation assumed to be present in the density of face space, although it appears as though density variation is assumed to cover a large part of the space. For example, Johnston and Ellis (1995) spoke of exemplar gradients when describing face space, and Valentine (1991) wrote that "the density of points will decrease as the distance from the central tendency increases" (p. 166). Both of these descriptions imply that meaningful variation in exemplar density should not be confined to only a small percentage of very distinctive faces. Previous assumptions about the internal structure of face categories may, therefore, need to be reexamined. If one were to maintain an exemplar-activation view of face classification, then it would appear that exemplar density is fairly uniform across most face space. However, an exemplar model is not strictly necessary to explain face classification. Slowed classification of distinctive faces might be due to participants automatically taking pause for unusual faces, perhaps to code new and informative possibilities for the deviation of facial features. This would be consistent with Rhodes and Moody's (1990) suggestion that participants spontaneously code distinctive aspects of a face. If this kind of coding is automatic, it may slow
1374
LEVIN
classification of highly distinctive faces. Alternatively, it is plausible that long-term experience in coding faces as members of groups allows abstracted features to control classification and reduces dependence on similarity to specific exemplars. This would be consistent with findings that increasing category size is associated with reduced dependence on exemplar similarity for shape-based object classification (Homa, Sterling, & Trepel, 1981; Omohundro, 1981). In general, the particular relationship between distinctiveness and classification RT observed here does not demand rejection of the multidimensional space model. Rather, it suggests that exemplar density gradients do not characterize most face space and that other accounts for variation in classification RT are at least as plausible. As such, the data from Experiments 1-3 imply that the previously observed relationship between classification R T and facial distinctiveness needs to be reconceptualized because it might be driven by the most distinctive faces in a given sample. These experiments have also established the robustness of the CR classification advantage, have provided evidence that it is related to participants' experience with CR faces, and have opened the way for the two other hypotheses that attempt to explain it by suggesting that an exemplaractivation model may not be strictly necessary to explain variation in face classification RT. Experiments 4--6, therefore, test the interference hypothesis and the race-feature hypothesis as alternatives to the multidimensional space model's explanation for the CR classification advantage.
Experiment 2 (where participants sorted upright gray-scale faces) with the exception that faces were inverted. Method Participants. Twenty-one White Cornell University undergraduates (17 female) completed Experiment 4 in exchange for course credit. All participants met the 7% error criterion. Stimuli. Stimuliwere identical to those used in Experiment 2 with the exception that the faces were presented upside down (180" rotation). Other testing materials and procedures were identical to those used in Experiment 2. Results Classification task. The analysis was identical to that in Experiment 2. The primary result is that the CR classification advantage remained for the inverted faces (Figure 8). Black faces were classified significantly more quickly than White faces (690 ms vs. 746 ms), F(1, 20) = 11.54, M S E = 0.054, and the 50% caricatures were classified significantly more slowly than the -50%, -25%, and 0% distortions (Duncan tests). The distortion-level effect was significant, F(4, 80) = 2.79, M S E = 0.010. There were no other differences in classification times among distortion levels, and none of the interactions were significant. The mean error rate was 3.2% (range: .63% to 6.2%). In no case were prototypical distortions classified significantly faster than undistorted stimuli. Pairwise comparisons were carried out in each of the four Familiarity × Race cells for both the - 2 5 % and the - 5 0 % distortions (Duncan tests). Recognition test. The recognition test produced difficult-tointerpret results. First, no CR recognition deficit was observed (Black A ' = .6869, White A ' = .7427; F < 1). Participants were again grouped by differences in number of false alarms instead of A ' scores with the same cutoffs as in Experiment 2, and classification-time data were entered into a two-way Recognition Difference (high-low) × Race (Black-White) mixed-variables ANOVA. The Recognition Difference × Race interaction approached significance, but it was opposite to the
Experiment 4 In Experiment 4, the interference hypothesis was tested by having participants sort inverted faces. The prediction was that disrupting participants' ability to encode facial configuration by using inversion would eliminate the CR classification advantage. This prediction was based on the assumption that increased configural coding in SR faces is the source of interference in the classification task, thus slowing classification relative to CR faces. This experiment was similar to
800 780 760 A
m E v I-
¢
Black Unfamiliar
"-
Black Familiar
740 720 O .... White Unfamiliar
700 13
White Familiar
680 660 I
I
I
I
I
-50
-25
0
25
50
DistorUon Figure 8.
Level
Reaction times (RTs) to classifyinverted White and Black faces by race.
FACE CATEGORIES direction predicted, F(1, 18) = 5.77, MSE = 0.005, p = .0636. Participants in the low-recognition difference group showed a larger classification-time difference than the participants in the high-recognition difference group. This finding was unexpected. However, this group of participants showed no overall recognition advantage for White faces. Perhaps sorting inverted faces caused participants to use an unusual face-processing strategy, which carried over to the later recognition test. Discussion It is clear that disrupting participants' ability to encode faces configurally did not eliminate or even diminish the CR classification advantage. These results strongly suggest that the interference hypothesis is incorrect. This hypothesis predicted that disrupting configural coding through inversion should have eliminated the CR classification advantage because configural coding interferes with classifying SR faces. Although it might be possible to save the interference hypothesis by arguing that inversion leaves some aspect of configural coding unaffected, recent findings discourage this. For example, Tanaka and Farah (1993) found that facial features are better remembered if they are part of a face than if they are presented alone. This implies that configural coding sets a context that enhances the accuracy of feature coding. When faces are inverted, however, this advantage is entirely eliminated. It therefore appears that coding configural information is not related to the CR classification advantage. If the interference hypothesis is incorrect, how is it wrong? One problem is that it ignores the possibility that there are several types of configural information. For example, Carey (1992) described data showing that children as young as 6 years old show Young et al.'s (1987) configural-interference effect as much as adults do. However, the same children do not show an inversion decrement in recognition, suggesting that these effects are driven by different types of holistic coding. Perhaps the type of configural coding responsible for Young et al.'s interference effect is irrelevant to race classification and is specific to coding the identity of familiar faces. In the case of familiar faces, alignment causes a distinctly new configuration of features. To the extent that this configuration is coded, it provides information that is discrepant with stored information about each face. Thus, it is the informational mismatch resulting from an automatically coded configuration that causes slowed recognition rather than global interference with coding parts. As such, this kind of configural coding might not interfere with coding of parts that do not specify identity directly. Inversion would, therefore, not be expected to eliminate the CR classification advantage. Overall, the interference hypothesis appears to be incorrect. At a minimum, however, it was specific enough to make a clear disconfirmable prediction. This sets the stage for Experiments 5 and 6, which tested the race-feature hypothesis by using a standard visual search paradigm. Experiment 5 Experiment 5 tested the hypothesis that the CR classification advantage occurs because race is coded as the presence or
" 1375
absence of a visual race feature that specifies minority outgroup race. White participants therefore classify Black faces by coding the presence of a Black race feature, whereas they code White faces on the basis of its absence. This leads to the prediction that visual search for a Black face should be more efficient than visual search for a White face. The reasoning behind this prediction comes from Treisman and Gormican's (1988) research. Using a standard visual search paradigm in which participants detect the presence or absence of a target stimulus in a field containing varying numbers of nontargets, Triesman and Gormican found that in some cases, search was facilitated when the roles of target and distractor were reversed. For example, where the target was a straight vertical line in a field of tilted lines, search was comparatively slow. However, when the tilted line was the target among straight distracters, search was much faster. Triesman and Gormican referred to this finding as a search asymmetry and argued that it happens because the target and nontargets are defined in terms of the presence or absence of a primitive visual feature. In the above example, tilt is the primitive feature. This makes the tilted line a featurepositive target and the straight line a feature-negative target. Searching for a feature-positive target among feature-negative nontargets is easy because the visual system need only detect the presence or absence of a single feature: target-present displays contain one tilt feature, and target-absent (blank) displays contain none. Detecting a feature-negative target among feature-positive distractors is more difficult because blank displays contain as many features as there are items in the display (a set of feature-positive nontargets), whereas displays containing targets are different only because they contain one less feature (i.e., the feature-negative target replaces a feature-positive nontarget). By the same logic, increasing the display size for feature-positive targets slows search less because the difference between target-present and blank displays remains a difference of one feature to none. Increasing display size for feature-negative targets slows search relatively more because the difference between targetpresent and blank displays becomes more subtle as the number of features in the display becomes larger relative to the one-feature difference between target-present and blank displays. Thus, feature-positive targets are easier to detect, as evidenced by a shallower slope relating display size to decision RT. Treisman and Gormican (1988) used the presence of search asymmetries as a tool to assess the primitive features used by early vision to construct objects. In that series of experiments, the stimuli were simple and artificial. Features consisted of tilt added to vertical lines, dots contained by circles, and so on. In Experiments 5 and 6, the feature was the race of prototype faces. Experiment 5 was a basic search experiment that established the presence of a search asymmetry, and Experiment 6 added two important controls to the basic paradigm. The prediction was that for White participants, search for a Black target would be more rapid than search for a White target because Black faces are viewed as feature positive for race, whereas White faces are feature negative.
1376
LEVIN
Method
Results and Discussion
Participants. Eight White Cornell psychology graduate students (4 male) completed the present experiment. Stimuli. Stimuli were small gray-scale images (64 x 90 pixels) of prototype faces made from the eight White or eight Black faces used in Experiment 1. Even at this small size, the race of the two faces was plainly discriminable. Both average brightness and contrast were equalized between the two stimuli. Apparatus. Stimuli were presented on a 16-in. gray-scale monitor controlled by a Macintosh LC III computer. Procedure. Participants were tested individually in the presence of the experimenter, who presented instructions verbally. Participants were instructed to search displays containing a number of faces for a target face, which was either the Black-prototype or the Whiteprototype face. Distractor faces were multiple copies of the prototype face that was not the target. Pictures of the faces were shown to the participants before starting. Search displays contained 2, 6, or 10 randomly placed faces inclusive of the target face. Participants were told to hit the 1 key on the keyboard if the target face was present and to hit the 2 key if it was absent. The instructions emphasized the need to "respond as quickly as possible without sacrificing accuracy" and informed participants that a low error rate was necessary for their data to be useful. Trials in which participants did not respond within 3 s were automatically terminated. Feedback in the form of a plus or a minus sign was given for correct and incorrect responses. The interstimulus interval between trials was 1,500 ms. Each participant searched both for the Black prototype in a field of White-prototype distractors and for the White prototype in a field of Black-prototype distractors. The order of search conditions was counterbalanced across subjects. In both conditions, participants completed three blocks of 48 trials. The first block in each condition was considered a practice block and was not included in the data analysis. Within each block, half of the trials were target-present trials, and half were blank. Within each target condition there were 8 trials for each display size.
RTs were entered into a 2 x 2 x 2 x 3 within-subjects Target R a c e (Black-White) x Block (1 or 2) x Target Presence (present-blank) x Display Size (2, 6, or 10) A N O V A . No transformations were done on the data. Data from error trials were eliminated. The average error rate was 5.04% (range: 2.17% to 9.90%). The Target Race x Display Size interaction was significant, F(2, 14) = 10.92, MSE -- 23,040, suggesting that the number of distractors in the display differentially affected search times across the two target races (Figure 9). Search slopes are as follows: for the Black target, 53 m s / i t e m on target-present trials, 100 m s / i t e m on blank trials; for the White target, 75 m s / i t e m on target-present trials, 139 m s / i t e m on blank trials. The search asymmetry was therefore present as predicted by the race-feature hypothesis. Increases in the number of White distractors slowed the search for a Black face less than increasing numbers of Black distractors slowed the search for a White face. In addition, the main effect for target race was significant, F(1, 7) = 29.27, MSE --- 65,280. Black faces were located more quickly than w h i t e faces (993 ms vs. 1,192 ms). Neither the main effect for block nor any interactions with block were significant. The expected target-presence and display-size main effects and the Target Presence x Display Size interaction were also significant, F(1, 7) = 320.80,MSE = 13,230; F(1, 7) = 105.66, MSE = 81,677; F(1, 7) = 100.47, MSE -- 7,901, respectively. Pairwise comparisons also show that Black faces were located more quickly than White faces in target-present trials for all three display sizes (Duncan tests). This final result is important because it helps eliminate an alternative explanation for the search asymmetry. It is possible that the Black faces were easier to locate than the White faces because the
2,10o 1,900 "
Black Search Target Present
,I,
Black Search Target Absent
[]
White Search Target Present
a.
White Search TargetAbsent
1,700 A
t~
E
V
I¢¢
1,500 1,300 1,100 900 700
I
I
I
2
6
10
Display Size Figure 9. Search reaction times (RTs) for White and Black prototypical faces in a field of cross-race distracters for White participants.
FACE CATEGORIES White faces were more familiar and therefore easier to group as suggested by Wang, Cavanagh, and Green (1994). Facilitated grouping of White distractors would therefore have produced an asymmetry favoring detection of the Black targets because it would have effectively reduced the number of distractors in the display. The data do not, however, fit with this explanation. If the asymmetry was caused by facilitated distractor grouping, then Black targets and White targets should have been equally detectable when the display contained only two stimuli, one target and one distractor. Instead, Black targets were more quickly detected than White targets even when there was only one distractor in the display. Although faster detection of Black targets in small displays makes a distractor-grouping hypothesis less plausible, it is still possible that the White distractors were more quickly identified as individuals because copies of the same White face served as distractor stimuli on all trials. This would have caused an asymmetry even when the display contained only one distractor. The next experiment therefore included a task in which participants detected the White and Black averages with no distractors present. Experiment 6 The results of Experiment 5 need to be verified for two reasons. First, as mentioned above, the search asymmetry may have resulted from faster rejection of the White distractor face rather than from facilitated detection of the Black target face. This explanation for the asymmetry assumes that the prototypical White face used in this task was more quickly identified (as opposed to classified). This leads to the prediction that the White face should be more quickly identified in a perceptualidentification task using repeated presentation. This prediction was tested by having participants view a randomly alternating series of faces containing repeated presentations of the Black prototype and the White prototype. They responded by hitting a key as quickly as possible when they saw the target face and by doing nothing when they did not see it. If the asymmetry was due to speeded identification of the White distraetors, then they should be identified more quickly in this task. Another difficulty with interpreting this search asymmetry is that there may be low-level features inherent to the stimuli aside from race that are causing the effect. For example, some participants mentioned that the Black average appeared to have a faint mustache, whereas the White average did not. The finding therefore needs to be validated by including groups of participants who presumably do not code a Black race feature. For this reason, Experiment 6 included three groups of participants: a group of White American participants, a group of African American participants, and a group of Black African National participants. On the basis of prior experience, one would expect that Black participants native to Africa would have learned to recognize White faces as a minority and therefore might code a White race feature instead of a Black race feature. African American participants are likely to have experienced White faces as a majority but are also likely to know a large number of Black individuals from their own race and would, therefore, be expected to produce results intermediate between White participants and African National participants.
1377
Method Participants. Participants were 8 White Americans (4 female), 7 African Americans (2 female), and 8 Black African Nationals (4 female). The African National participants had been away from Africa (in America or Europe) for an average of 3 years (range: 3 months to 6 years). Four of the White participants were also in Experiment 5. African National and African American participants were paid between $5 and $15 to participate in the study. Stimuli. Stimuli were similar to those used in Experiment 5, with the exception that their external features (hair, ears, and jawline) were identical to one another. These features were created by averaging the two prototype faces. Procedure. The search task was identical to that in Experiment 5 and was always run before the perceptual-identificationtask, using the same apparatus as in Experiment 5. One of the African National participants had difficulty responding within the allotted 3 s so the procedure in this one case was modified to allow for longer RTs. In the perceptual-identification task, participants completed two blocks of 40 trials in which a randomly alternating series of Black and White prototype faces was presented. In one block, participants were instructed to respond as quickly as possible by hitting the 1 key when they saw the Black face and to do nothing when they saw the White face. In the other block, they responded when they saw the White face. Each group of experimental trials was preceded by 20 practice trials. The order of blocks was randomized across participants. Results Search task. Data were entered into three separate fourvariable Target Race (Black-White) x Block (1 or 2) x Target Presence (present-blank) x Display Size (2, 6, or 10) ANOVAs, one for each group of participants. The error rate was 2.7% (range: 1.1% to 4.3%) for White participants, 3.4% (range: 1.1% to 8.3%) for African National participants, and 3.1% (range: 2.1% to 6.3%) for African American participants. As Figure 10 shows, neither the African National nor the African American participants showed a significant search asymmetry. The Target Race x Display Size interaction for African National participants was not significant, F(2, 14) = 1.40, M S E -- 15,974, and the interaction for African American participants was also not significant, F(2, 12) = 1.46, M S E = 19,346. However, the White participants again showed a significant search asymmetry, F(2, 14) = 5.89, M S E = 18,636. Search slopes for each task (Black search-White search averaged across target-present and blank trials) were computed for each participant to test for an effect of participant ethnicity on the asymmetry. Each participant's slope for the Black search was subtracted from their White-search slope. The resulting difference was a direct measure of the size of the search asymmetry with positive numbers indicating an asymmetry favoring search for a Black face and negative numbers indicating an asymmetry favoring detection of the White face. These difference slopes were entered into a one-variable A N O V A with participant ethnicity as the single variable. A linear contrast was performed to test the hypothesis that African National participants and White participants would show the biggest difference in asymmetry size, whereas African Americans would show intermediate results. This contrast was nonsignificant, F(1, 20) = 1.86, M S E = 778, p = .1883, although the means were in the correct direction (African National ps: 6.28 ms/item, African American ps: 11.21 ms/
1378
LEVIN
African
National
African American Participants
Participants
•
White
Participants
BlackTarget White Target
1,800
1,800
1,600
1,600
1,400
1,400
~ 1,2oo I,-u. 1,ooo
~ 1,200 I~ t,000
800
800 i
i
0 2
4
i
i
i
1,800
/ 0
1,400
i
i
i
4
6
Display Size
E
1,200
I-. i~
1,ooo
800
2
i
6 8 1012
1,600
i
i
i
8 1012
Display Size
/ i
2
J
4
i
6
i
i
i
8 1012
Display Size
Figure I0. Mean search reaction times (RTs) for African National, African American, and White participants.
item, Whiteps: 23.32 ms/item). The reason for the small effect size is apparent in Figure 10. Search slopes for large display sizes were particularly fast for African National participants when they searched for Black faces. This suggests that when they were searching for Black faces in the largest displays, some of the African National participants forced a quicker response perhaps to avoid a timed-out trial. In fact, two of the African National participants showed negative search slopes for the large display sizes ( - 1 5 ms/item in one case and - 4 1 ms/item in another). They found the Black face faster when it was in a 10-face display than when it was in a 6-face display. The net effect of this strategy may have been to artificially speed the Black search thereby reducing the contrast with the White participants and, in addition, to increase the variance associated with the large display sizes, thereby sapping the power of the significance test. For this reason, the contrast was rerun with only data from the two smaller display sizes. This contrast was significant, F(2, 20) = 7.10, MSE -- 3,560. Pairwise comparisons show that African participants showed an asymmetry significantly more in favor of detecting White faces (slope difference: -2.01 ms) than was the case for White participants (slope difference: 27.82 ms, Duncan test), whereas the difference between African American participants (slope difference: 10.35 ms) and the other two groups was not significant. Perceptual-identification task. Data from the perceptualidentification task were analyzed with separate one-tailed t tests for each group of participants. White participants identified Black faces significantly faster than White faces (412 ms vs. 430 ms), t(1, 7) = 2.31. African National participants also identified the Black face faster (470 ms vs. 525 ms), t(1, 7) -- 1.60. African American participants identified each face equally quickly (Black: 410 ms, White: 418 ms), t(1, 6) = 0.57.
faces was observed twice in White participants. The lack of an asymmetry in African National and African American participants suggests that the asymmetry is not due to low-level feature differences in the particular stimuli used. If such features were driving the results, there would be no reason to expect anything but the same asymmetry in both groups of participants. In addition, an alternative hypothesis in which participants search more quickly for Black targets by quickly identifying and rejecting White distractors also seems untenable. Participants were not faster at identifying a repeatedly presented w h i t e face. Although the non-White participants showed different resuits from the w h i t e participants, the reversed search asymmetry in which African National participants located the w h i t e face more quickly than the Black face was not observed. Though disappointing, this result was not surprising. As mentioned before, coding an asymmetric race feature is probably caused by coding a face as belonging both to a minority group and to an out group, as is the case for white Americans viewing Black faces. If the context is changed to coding a majority out group, then coding a race feature might not occur. There is no point in coding the race of out-group individuals if they surround you. In such a case, the task of individual recognition might outweigh the tendency to immediately categorize out-group faces. For the African participants in the present experiment, extended residence in America might have provided enough experience with a White majority to eliminate White race-feature coding. This possibility is confirmed by Carroo (1986), who tested Black Africans' recognition of White faces and found their A' scores to be positively correlated with time spent in America.
Discussion
The experiments reported here tested three competing explanations for the CR classification advantage. These hypotheses actually represent two fundamental approaches. The multidimensional space model explains face categories by
Results from Experiments 5 and 6 support the race-feature hypothesis. A significant search asymmetry favoring Black
General Discussion
FACE CATEGORIES using domain-general principles based on exemplar density and psychological similarity. The importance of this model stems from its parsimony. It can explain a wide variety of empirical findings by using a simple and generalizable framework. The other two hypotheses explain face classification by referring to specific processing conflicts (in the case of the interference hypothesis) and ecological regularities (in the case of the race-feature hypothesis). Both are more domain specific in nature and, therefore, require a more detailed understanding of the circumstances in which faces are processed. Although the interference hypothesis is inconsistent with the empirical findings, the race-feature hypothesis is supported by the findings from Experiments 5 and 6. The General Discussion proceeds by first examining findings that support the race-feature hypothesis and the degree to which they are compatible with the multidimensional space hypothesis. The discussion also assesses the degree to which domaingeneral exemplar models of classification are sufficient to explain face classification.
The Validity of Visual Search for Race and the Race-Feature Hypothesis The primary support for this hypothesis comes from the visual search results. For White participants, searching for the Black face among White distractor faces was faster than searching for the White face among Black distractor faces. As mentioned before, previous visual search data suggest that search asymmetries arise because visual search for a featurepositive target is fundamentally more efficient than visual search for a feature-negative target (Treisman & Gormican, 1988). The hypothesis for faces is that when White participants view White and Black faces, race is encoded as the presence or absence of the Black race feature. The most obvious potential difficulty with these results is that there may be a low-level feature inherent to the complex face stimuli which causes the asymmetry. Perhaps the Black face was easier to locate because it had some low-level feature such as a faint mustache that distinguished it from the White face. (Recall, however, that average darkness and contrast were equalized between the Black and White faces.) If this were the case, however, African participants should also have shown a search asymmetry favoring the Black face. They clearly did not. In addition, I have found that White participants who did not show the typical CR recognition disadvantage showed a siguifieantly reduced asymmetry as compared with participants who did show this deficit (Levin, 1995). These findings strongly suggest that the asymmetry is due to participants' particular face-processing experience as opposed to some low-level feature that happens to be different between the two stimuli. The more difficult question is, can race really be considered a feature, and if so, what is the exact nature of the feature? Detecting race is clearly much more difficult than detecting a simple feature such as the presence of slant added to a vertical line. With the slant feature, detection of a feature-positive target can occur almost without regard to the number of distracters, implying that all stimuli in the field are being searched in parallel. The slope of the function relating search
1379
time to display size for such stimuli is typically less than 10 ms (Theeuwes, 1993). In the present case, the search was comparatively slow, and the ratio of slopes in the target-present and blank conditions was approximately 2:1. Both of these results are signs of a serial self-terminating search, although the comparatively slow speed of the search might also have resulted from a series of parallel searches of subgroups of stimuli in the larger display (Pashler, 1987; Treisman & Gormican, 1988). Essentially, though, all signs do point in the direction of a serial search, and previous research suggests that the complexity of the stimuli alone does not preclude parallel search (Wolfe, 1994). As such, the mechanism responsible for the asymmetry should be able to cover a serial search. One promising alternative is proposed by Duncan and Humphreys (1989), who explain search asymmetries by appealing to differences in the complexity of the target template (i.e., the internal description of the information that must be present to allow display stimuli access to response processes) necessary to describe feature-positive and feature-negative targets. They suggest that a feature-negative template is more complex because it must specify a conjunction of the feature-negative standard and the absence of the critical feature, whereas the template specifying a feature-positive target need specify only the feature itself. This would allow a faster serial scan in the feature-positive search without the necessity of appealing to activations on a spaciotopic map of visual primitives. Another important question that awaits further exploration is the possibility that the observed search asymmetry is being driven by novelty acting as a primitive feature rather than by a race feature. Wang, Cavanagh, and Green (1994) found that search slopes were nearly fiat when the target was a mirrorreversed letter among correctly oriented versions of that letter. Search slopes were much greater when the target was a correctly oriented letter among mirror-reversed letters. Wang et al. argued that the mirror reversal changed a familiar shape into a novel one with the same low-level features. Therefore, the search facilitation observed when the mirror-reversed letter was the target occurred because novelty acted as a primitive feature. Although CR and SR faces probably do not represent such a clear-cut novel-familiar distinction, it is plausible that the rarity of CR faces causes the asymmetry by itself. However, Wang et al. argued that novel targets are more quickly located because they induce an orienting response so they can receive additional processing resources. This is compatible with their data in part because target-present responses to displays with no distractors appear faster for familiar targets than for unfamiliar targets (see leR panels of Wang et al.'s Figures 5 and 6). This crossover supports the idea that the search advantage for novel stimuli is based on the need to give them extended processing because displays with no distractors eliminate the search advantage while retaining the processing extension given the novel stimuli. This finding is quite different from the pattern observed in Experiments 5 and 6 where response to the novel stimulus was faster even in the perceptual-identification task (and, for that matter, in the classification tasks), which included no distractors. Also, the findings presented here that a subgroup of White participants who showed no CR recognition deficit also showed no CR classification advantage suggest that this novelty is
1380
LEVIN
quite subjective and is related to the individual's particular view of SR and CR individuals. Presumably Whites who can accurately recognize Blacks do not do so because they happen to live in an environment where there are a majority of Blacks (a circumstance that does not necessarily eliminate the CR recognition deficit; Ng & Lindsay, 1994). More likely is the possibility that these individuals have had some experience that causes them to view Blacks with an eye toward individuating them as in Li et al.'s (1994) research where White basketball fans showed no deficit in recognizing Black faces. In such individuals, the absence of a novelty-based search advantage would be the result of their subjective view that features defining a Black person are not novel despite the fact that they live in a setting where Blacks constitute a small minority. Whether facilitated detection of CR faces in the visual search task is novelty based or based on a specific race feature, the most important aspect of the visual search data is that they imply a particular relationship between CR faces and SR faces that is not explainable under the multidimensional space hypothesis. Detecting a CR face involves determining the presence of race-specifying information, and detecting an SR face is a question of determining the absence of such information. Trying to explain the search results without appealing to this relationship is difficult at best. If one assumes that search is entirely serial and that participants c~assify each face by race as they scan through the display, the multidimensional space model seems to predict a search asymmetry favoring the detection of White faces, w h e n searching for a Black face, increasing the display size increases the number of difficult-todetect white faces, whereas the reverse is true for detecting a White face in a field of Black faces. One could try to fit the search data with the multidimensional space model by assuming that the process of rejecting a face in a search display is different from the process of classifying it. Perhaps distractor faces are rejected during a scan by assessing the degree to which they activate the target's population of exemplars. The less a distractor face activates representations of target exemplars, the easier it would be to reject. Again, however, the prediction seems to favor the white search. The average distance of target-group exemplars from a distractor face is likely to be equal for Black and White targets (see Figure 1 again). Therefore, the sum of activations in the target group caused by a nontarget face is proportional to the number of stored exemplars in the target group. For White participants, Black distractors will produce more overall target activation than White distractors because the White category presumably contains more exemplars. This greater activation will increase the difficulty of rejecting the Black distractors, again slowing the Black search relative to the White search. One way of reconciling the visual search findings with the multidimensional space hypothesis would be to suggest that the multidimensional space hypothesis allows for different feature weightings across different groups of faces and even across different task contexts. This is an assumption common to many exemplar models (i.e., Medin & Schaffer, 1978; Nosofsky, 1984). Valentine and Endo (1992) discussed this possibility in terms of selective attention. As such, the multidimensional space hypothesis could simply assume that features
specifying race are dimensions of the CR face space but not of the SR face space. Alternatively, individuals could simply attend more closely to race-specifying features in CR faces. Both of these assumptions are, however, essentially ad hoc patches to a model that does not specify important processes a priori. Most of the interesting work is being done by the add-on concept of selective attention and not by the idea that exemplar density controls classifiability, which was the original point of the model. The fact that the multidimensional space model leaves the particular information coded in a face unspecified allows it to adjust to almost any result by simply positing that the effect lies in variation in feature weightings. Appealing to selective attention has another problem as well, not only for the multidimensional space model, but also for any model that attempts to explain recognition and classification by using an exemplar-density framework. The problem is that if attention selects different features to code in different situations, then there is no reason to assume that the structure of exemplar space is going to be the same for a given set of stimuli across situations (Murphy & Medin, 1985). To take a concrete example, Roberts and Bruce (1988) found that the facial features used to judge sex and those used to identify a face are different. Presumably, then, when an individual classifies by sex he or she selectively attends to only those features that specify sex. The face space defined by these features is where exemplar density will be measured. This space will be different from the one used when an individual is recognized, because it will include different features. In fact, it could be completely orthogonal to the sex face space if nonoverlapping sets of features are used for each judgment. Thus, if selective attention is given free reign over the features used in face space there is no compelling reason to assume that the effective structure of face space remains the same across different tasks. This is, however, exactly the assumption the multidimensional space hypothesis makes when it uses the same exemplar space to explain both the CR classification advantage and the CR recognition deficit. In fact, the same could be said about the exemplar-density gradients that serve to unify the findings that typical faces are more difficult to recognize but are easier to classify than distinctive faces. The model again assumes that different classification and identification tasks are driven by similarly structured exemplar spaces despite the fact that they are probably driven by different sets of features. This kind of flexibility might be constrained by specifying the effects of a set of broadly applicable task contexts (e.g., Medin, Goldstone, & Gentner, 1993), but doing so would seem to require the same understanding of the natural structure of face categories as is represented in the race-feature hypothesis. In this context, the idea of exemplar similarity remains an important tool for understanding object categories, but it is not an adequate theory to explain their structure. According to the above analysis, the CR classification advantage arises not from simple differences in the psychological similarity among SR and CR faces, but rather because CR and SR face categories are specified in a feature-presentfeature-absent manner. This relationship may be best understood as the result of the particular cognitive tasks we engage in when coding faces from in groups and out groups. When we
FACE CATEGORIES come across a member of a visually identifiable out group, the feature that signals group membership becomes an access point for further cognition and judgment. The same does not happen for a member of an in group. The data from African American and African National participants also suggest that the out group must also be a minority race in order for race-feature coding to occur. This finding emphasizes the information that category-specifying features can contain. Not only do they mark group membership in a face, but they can also be useful in identifying individuals. For example, imagine a White professor with a large class containing 150 students, 4 of whom are Black. To efficiently recognize the Black students, coding their race along with to one or two additional features would be highly effective. A Black professor in front of the same class, on the other hand, would find no advantage in coding the race of his or her White students despite the fact that they represent an out group. In such a case, this professor might also start coding the race of his or her Black students. These examples are consistent with Rothbart and John's (1985) suggestion that solo status in a group increases the salience of category information and are also consistent with the idea that the category information can be useful for individuation. Thus, the objective layout of different groups interacts with the subjective structure of in groups and out groups to produce differences in how people code facial features, The race-feature hypothesis, therefore, connects the structure of face categories with the specific context in which faces are recognized.
S u m m a r y and Conclusions This research speaks to several issues. First, the CR classification advantage appears to be the result of facilitated processing of a visually derived race feature that specifies CR faces. If this is true, the CR classification advantage arises not from simple differences in the internal structure of face categories but rather from the specific context in which faces from different groups are encoded. Second, controlled variation in facial typicality does not lead to the kind of variation in classification RT that might be expected if classification were based on exemplar activation within a category with graded exemplar density. Taking a broad view, faces would seem to be the ideal real-world stimuli for an exemplar model to cover. The variations that people code in faces are similar to those available in the abstract forms used in previous research validating such models. Also, just about everyone has numerous face exemplars that could make up a face space with clear density gradients. As such, the multidimensional space model makes good sense as an extension of research on classification of abstract stimuli. However, the inability of the model to explain some aspects of face classification points out the danger of making this leap. Exemplar models of abstracted psychological similarity spaces are just that: abstract. They function well, but only within the confines of arbitrary, shortterm learning in which the only means participants have to make classifications are the ones provided by the experimenter. By treating the particular features that are used to categorize objects as arbitrary weights, exemplar models miss
1381
much of what it means to classify an object and are forced to proliferate add-on rules when they do not explain simple shape-based classifications such as the ones reported here. As Armstrong, Gleitman, and Gleitman (1983) put it, "All hope of an economical theory of classification, even rough and ready categorization, is gone unless we can given an account of the feature set that learners and users will countenance." (p. 297). Exemplar models (and other similarity-based models) also suffer from having nothing to say about why people have certain categories and not others (Medin, 1989). In the ease of face categories, there is nothing inherent to the shape of faces of one race or another that makes them categories. Hair color, face size, and skin texture are all perceptually salient features of faces that might be the basis for meaningful face categories. Without specifying how the context of face coding influences the particular features that are selected for face categories there is no principled way of structuring face space. For example, the idea that the CR face space is more dense does not arise from the basic nature of exemplar-based classification. It is, rather, an assumption based on known effects that the model attempts to explain. As such, we are left without an understanding of why White participants recognize Black individuals so poorly, whereas SR individuals who have dark hair, small heads, or rough skin seem to pose little problem. Instead, theories of object classification and identification should explicitly model the interaction between the cognitiveperceptual system and the structure of the environment in which it operates. The idea that theories of categorization should explicitly relate regularities in the environment to internal representations is, of course, the basis of much of the most influential research on concepts. Rosch, Mervis, Gray, Johnson, and Boyes-Braem (1976) and Roseh and Mervis (1975) fundamentally changed our idea of conceptual structure by pointing out that patterns of concurrence of features in the environment favor classification at a particular level of generality. Researchers can, therefore, understand the form of internal-concept representations by referring to the real-world regularities that they reflect. In the same spirit, the present research attempts to explain how one particular and important object feature (the race of a face) is defined by an environment in which individuals are parts of socially meaningful in groups and out groups that interact with objective informational demands of situations where faces are recognized. References Armstrong, S. L., Gleitman, L. R., & Gleitman, H. (1983). What some concepts might not be. Cognition, 13, 263-308. Bern, S. L. (1993). Lenses of gender: Transforming the debate on sexual inequality. New Haven, CI': Yale University Press. Benson, P. J., & Perrett, D. I. (1991). Perception and recognition of photographic quality facial caricatures: Implications and the recognition of natural images. European Journal of Cognitive Psychology, 3, 105-135. Brennan, S. E. (1985). Caricature generator: The dynamic exaggeration of faces by computer. Leonardo, 18, 170-178. Carey, S. (1992). Becoming a face expert. Philosophical Transactions of the Royal Society of London: Biological Sciences, 335, 95-103. Carey, S., & Diamond, R. (1977, January 21). From piecemeal to confignrational representation of faces. Science, 195, 312-314.
1382
LEVIN
Carroo, A. W. (1986). Other race face recognition: A comparison of Black American and African participants. Perceptual and Motor Sk//ls, 62, 135-138. Diamond, R., & Carey, S. (1986). Why faces are and are not special: An effect of expertise. Journal of Experimental Psychology: General, 115, 107-117. Duncan, J., & Humphreys, G. W. (1989). Visual search and stimulus similarity. Psychological Review, 96, 433-458. Fallshore, M. F., & Schooler, J. W. (1995). The verbal vulnerabilityof perceptual expertise. Journal of Experimental Psychology: Learning, Memory, and Cognition, 21, 1608-1623. Farah, M. J., Tanaka, J. W., & Drain, H. M. (1995). What causes the face inversion effect? Journal of Experimental Psychology: Human Perception and Performance, 21, 628-634. Frable, D. E. S., & Bern, S. L. (1985). If you are gender schematic, all members of the opposite sex look alike. Journal of Personality and SocialPsychology, 49, 459--468. Going, M., & Read, J. D. (1974). Effects of uniqueness, sex of participant, and sex of photograph of facial recognition. Perceptual and Motor Skills, 39, 109-110. Homa, D., Sterling, S., & Trepel, L. (1981). Limitations of exemplarbased generalization and the abstraction of categorical information.
Journal of Experimental Psychology: Human Learning and Memory, 7, 418-439. Johnston, R. A., & Ellis, H. D. (1995). Age effects in the processing of typical and distinctive faces. Quarterly Journal of Experimental Psychology: Human Experimental Psychology, 48(A), 447-465. Levin, D. T. (1989). Effect of stimulus type and degree of familiarity on prototypicality of responses. Unpublished undergraduate thesis, Reed College, Portland, OR. Levin, D. T. (1995, May). V'tsualsearch for a complex feature: Group membersh~ offaces. Poster session presented at the annual meeting of the Association for Research in Vision and Ophthamology, Fort Lauderdale, FL. Li, J. C., Dunning, D., & Malpass, R. (1994). Cross racial identification
among European-Americans: Basketball random and the contact hypothesis. Unpublished manuscript, Cornell University, Ithaca, NY. Light, L. L., Kayla-Stuart, F., & Hollander, S. (1979). Recognition memory for typical and unusual faces. Journal of Experimental Psychology: Human Learning and Memory, 5, 212-228. LinviUe, P. W., Fischer, G. W., & Salovey, P. (1989). Perceived distributions of the characteristics of in-group and out-group members: Empirical evidence and a computer simulation. Journal of Personality and Social Psychology, 57, 165-188. Medin, D. L. (1989). Concepts and conceptual structure. American Psychologist, 44, 1469-1481. Medin, D. L., Goldstone, R. L., & Gentner, D. (1993). Respects for similarity, PsychologicalReview, 100, 254-278. Medin, D. L., & Sehaffer, M. M. (1978). Context theory of classification learning. Psychological Review, 85, 207-228. Mullen, B. (1991). Group composition, salience, and cognitive representations: The phenomenology of being in a group. Journal of Experimental Social Psychology, 27, 297-323. Murphy, G. L., & Medin, D. L. (1985). The role of theories in conceptual coherence. PsychologicalReview, 92, 289-316. Ng, W., & Lindsay, R. C. L. (1994). Cross-race facial recognition: Failure of the contact hypothesis. Journal of Cross-Cultural Psychology, 25, 217-232. Nosofsky, R.M. (1984). Choice, similarity, and the context theory of classification. Journal of Experimental Psychology: Learning, Memory, and Cognition, 10, 104-114. Omohundro, J. (1981). Recognition vs. classification of ill-defined category exemplars. Memory & Cognition, 9, 324-331. Pashler, H. P. (1987). Detecting conjunctions of color and form:
Reassessing the serial search hypothesis. Perceptionand Psychophys-
ics, 41, 191-201. Rae, G. (1976). Table of A'. Perceptual and Motor Skills, 42, 98. Rhodes, G., Brake, S., & Atkinson, A. P. (1993). What's lost in inverted faces? Cognition, 47, 25-57. Rhodes, G., Brennan, S., & Carey, S. (1987). Identification and ratings of caricatures: Implications for mental representation of faces. Cognitive Psychology, 19, 473-497. Rhodes, G., & Moody, J. (1990). Memory representations of unfamiliar faces: Coding of distinctive information. New Zealand Journal of Psychology, 19, 70-78. Rhodes, G., Tan, S., Brake, S., & Taylor, IC (1989). Expertise and confignral encoding in face recognition. British Journal of Psychology, 80, 273-283. Roberts, T., & Bruce, V. (1988). Feature saliency in judging the sex and familiarity of faces. Perception, 17, 475-481. Rosch, E., & Mervis, C. B. (1975). Family resemblances: Studies in the internal structure of categories. Cogniave Psychology, 7, 573--605. Roseh, E., Mervis, C. B., Gray, W. D., Johnson, D. M., & BoyesBraem, P. (1976). Basic objects in natural categories. Cognitive Psychology, 8, 382-439. Rothbart, M., & John, O. P. (1985). Social categorization and behavioral episodes: A cognitive analysis of the effects of intergroup contact. Journal of Social Issues, 41, 81-104. Schooler, J. W., & Engstler-Schooler, T. Y. (1990). Verbal overshadowing of visual memories: Some things are better left unsaid. Cognitive Psychology, 22, 36--71. Shapiro, P. N., & Penrod, S. (1986). Meta-analysis of facial identification studies. PsychologicalBulletin, 100, 139-156. Suzuki, S., & Cavanagh, P. (1995). Facial organization blocks access to low level features: An object inferiority effect. Journal of Experimental Psychology:Human Perceptionand Performance, 21, 901-913. Tanaka, J. W., & Farah, M. J. (1993). Parts and wholes in face recognition. Quarterly Journal of Erperimental Psychology: Human Experimental Psychology, 46(A), 225-245. Theeuwes, J. (1993). Visual selective attention: A theoretical analysis. Acta Psychologica, 83, 93-154. Treisman, A., & Gormican, S. (1988). Feature analysis in early vision: Evidence from search asymmetries. PsychologicalReview, 95, 15-48. Valentine, T. (1991). A unified account of the effects of distinctiveness, inversion, and race in face recognition. Quarterly Journal of
Experimental Psychology: Human Experimental Psychology, 43(A), 161-204. Valentine, T., & Bruce, V. (1986a). The effect of race, inversion and encoding activity upon face recognition. Acta Psychologica, 61, 259-273. Valentine, T., & Bruce, V. (1986b). Recognizing familiar faces: The role of distinctiveness and familiarity. Canadian Journal of Psychology, 40, 300-305. Valentine, T., & Endo, M. (1992). Toward an exemplar model of face processing: The effects of race and distinctiveness. QuarterlyJournal
of E.werimental Psychology: Human E.~erimental Psychology, 44(A), 161-204. Wang, Q., Cavanagh, P., & Green, M. (1994). Familiarity and pop-out in visual search. Perception and Psychophysics, 56, 495-500. Wolfe, J. M. (1994). Visual search in continuous naturalistic stimuli. Irtslon Research, 34, 1187-1195. Yin, R. K. (1970). Face recognition by brain injured patients: A dissoeiable ability?Neuropsychologia, 8, 395--402. Young, A. W., Hellawell, D., & Hay, D. C. (1987). Configural information in face perception. Perception, 16, 747-759. Received December 12, 1994 Revision received April 8, 1996 Accepted April 9, 1996 •