The Online Journal of Science and Technology - October 2016 Volume 6, Issue 4
CLASSIFYING HAND SIGNS USING IMAGE PROCESSING Ozan AKI Trakya University Turkey
[email protected] Aydın GÜLLÜ Trakya University Turkey
[email protected] Abstract: In this study, we aimed to classifying basic hand signs with image processing techniques. Hand images were obtained from a camera and each signs were classified manually for creating learning samples. Gabor wavelets were used to extract features of each hand sign image. Meaningful features were selected for teaching machine learning algorithms while weak features were rejected. Some well-known machine learning algorithm results were compared and best one were selected for real time testing. Keywords: Hand Sign, Image Processing
Introduction Hand movements and hand signs has become a novel way to interact smart devices. Many time these methods are just funny and alternative ways to use devices such computers, smartphones, smart TV sets and game consoles. But on the other hand, these alternative interact methods may aid patients, disabled people, machine operators. Patients may call nurse by simply a hand gesture. Disabled people may call elevator by a hand movement. Machine operators may work safely by checking if hands are in safe. In this study, we aim to classifying some specific hand shapes by using image processing and machine learning techniques. Hand shape images obtained by a webcam camera. Each shape of hand images were extracted from live video stream and saved as images with different orientation and different variations. We stored each hand shape images in named subfolder. After collecting all classified images, developed application was calculate Gabor wavelet transformation for all images and built an ARFF (Attribute Related File Format) file using by Weka (Machine Learning Group at the University of Waikato) machine learning application. ARFF file format was used for selecting meaningful features and evaluating machine learning algorithms. Finally, most successful machine learning algorithm was selected by comparing each other.
Materials and Methods Image Database In this study, only five group of specific hand shape images were used. For simplicity, each group of hand shape shows numbers with fingers. Hand shape images were obtained from solid black background platform using Microsoft LifeCam camera. Sample images were grabbed from camera every 10 frame interval with different angle and variations. Thus total 1569 images collected. Each group has 300 images approximately.
Figure 1: Hand shape groups that indicate numbers Each group of hand shape images will used for machine learning afterwards. Thus hereafter each group will be called as class. Each classes of hand shape images were saved in sub-folders that named as class name. Thus, hand shape images database were created.
Feature Extraction
www.tojsat.net
Copyright © The Online Journal of Science and Technology
32
The Online Journal of Science and Technology - October 2016 Volume 6, Issue 4
Image processing consists of several stages. Preparing images for processing is the first stage. In this stage, Gaussian filter has been applied to images for reducing noises. Then these images has been converted to grayscale that contains only illumination information instead colors (Bradski & Kaehler, 2008). Thus, image database has been prepared for feature extraction processes. Gabor filters, in other words Gabor wavelet transforms can extract time and frequency information from multidimensional signals like images. Also multi-resolution analysis can be done with adjustable kernel sizes. Gabor filters are mostly using in image processing applications such as facial expression classification, face recognition, texture classification (Chao, 2011; Ilonen, Kämäräinen, & Kälviäinen, 2005). A two dimensional Gabor wavelet defined as in Equation 1 and Equation 2.
Where
,
,
∙
,
∙
defines center frequency and
∙
∙
,
∙
(1)
∙
(2)
the spread of the Gaussian window (Derpanis, 2007).
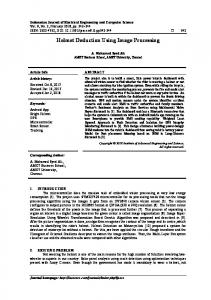
Figure 2: Eight angles and five scale Gabor kernel images In this study, Gabor wavelet transforms were used for extract features of images for learning and classification. Five different scale for eight different angle (0°, 22,5°, 45°, 67,5°, 90°, 112,5°, 135°, 157,5°) Gabor kernels has been calculated for each images. Gabor kernels were shown in Figure 2. Convolving each kernel with image results real, imaginary, amplitude and phase components. Thus 160 feature per image has been calculated.
Figure 3: Input image convolving with Gabor kernel Gabor wavelet transforms are calculating by convolving whole image with Gabor kernel and resulting an image. Figure 3 shows a result of convolving input image with a specific Gabor kernel. Each kernel transforms calculates separately for an image. Developed application scans all sub directories and calculates all 160 feature for each image automatically. At the same time, this application builds an ARFF file that each calculated image features has been a data line. ARFF files are using by Weka application for machine learning processes (M. Hall et al., 2009). Figure 4 shows developed application's screen capture while working. This application detects number of core of CPU (Central Processing Unit) and processes same number of images concurrently.
www.tojsat.net
Copyright © The Online Journal of Science and Technology
33
The Online Journal of Science and Technology - October 2016 Volume 6, Issue 4
Figure 4: Developed application for automated feature extraction Machine Learning Machine learning is simply described as turning data into information (Bradski & Kaehler, 2008). For doing this, machine learning looks for patterns within data by training and afterwards we can ask questions about new upcoming data never seen before (Witten & Frank, 2005). Classifiers are machine learning algorithms. These algorithms are using for classifying unknown data based on trained data before. Evaluation of classifiers results some metrics. Most of these metrics calculates from confusion matrix. Confusion matrix shows number of correctly and incorrectly classified data for each classes. In confusion matrix, number of correctly classified positive data are called as TP (True Positive) and number of incorrectly classified positive data are called as FP (False Positive). Similarly, number of correctly classified negative data are called as TN (True Negative) and number of incorrectly classified negative data are called as FN (False Negative). Hereby, accuracy is calculated as in Equation 3. (3) Accuracy shows percentage of correctly classified instances both positive and negative (Kılıçaslan, Güner, & Yıldırım, 2009). Precision is calculating as in Equation 4.
(4)
Precision rate shows errors which are caused by classifying negative instances as being positive (Kılıçaslan et al., 2009). Recall is calculating as in Equation 5. (5) Recall rate shows errors which are caused by classifying positive instances as being negative (Kılıçaslan et al., 2009). f-measure is calculating as in Equation 6.
∙
∙
(6)
The f-measure combines precision and recall by calculating their harmonic mean (Kılıçaslan et al., 2009). ROC (Receiver Operating Characteristic) area is a calculated area under curve that plot recall versus FPR (False Positive Rate). FPR is calculating as in Equation 7.
(7)
Gabor wavelet transformation results used for evaluation some well-known classifiers. Weka (version 3.6.11) application were used for evaluation of machine learning algorithms. Weka is an application that have collection of machine learning algorithms for data mining tasks (M. Hall et al., 2009).
www.tojsat.net
Copyright © The Online Journal of Science and Technology
34
The Online Journal of Science and Technology - October 2016 Volume 6, Issue 4
Results and Conclusions Gabor wavelet transforms or Gabor filters are useful for extract image features. In this study, all possible Gabor kernels were used for experimental purposes. Extraction all possible features from all images needs much processor power and takes much longer time. Using all possible features will not be practical for real time classifying. For efficient calculation and saving time, less-meaningful features can be ignored. Therefore, there are two different experiments in this study. In the experiment 1, all the features that total of 160 were calculated for each image in the image database. In the experiment 2, only selected features that total of 34 were calculated for reduce computing time. Features were selected by using CFS (Correlation-based Feature Selection) attribute evaluator and best first search algorithm with default parameters in Weka application (M. A. Hall, 1999). Results of experiment 1 and experiment 2 and difference between experiments were shown in Table 1. All classifiers were used with default parameters as defined in Weka application. Cross-validation fold was used as 10. Only high rated classifiers were accepted for comparing. Table 1: Evaluation of classifiers Classifier Naïve Bayes
IBk
J48 Decision Tree
RBF Network
Bagging
Random Forest
Experiment 1 2 ∆ 1 2 ∆ 1 2 ∆ 1 2 ∆ 1 2 ∆ 1 2 ∆
Accuracy (%) 81.47 88.09 +6.62 99.49 99.30 -0.19 96.56 95.92 -0.64 93.82 95.92 +2.10 97.77 96.88 -0.89 98.98 98.85 -0.13
Precision 0.820 0.885 +0.065 0.995 0.993 -0.002 0.966 0.959 -0.007 0.939 0.959 +0.02 0.978 0.969 -0.009 0.990 0.989 -0.001
Recall 0.815 0.881 +0.066 0.995 0.993 -0.002 0.966 0.959 -0.007 0.938 0.959 +0.021 0.978 0.969 -0.009 0.990 0.989 -0.001
f-Measure 0.814 0.880 +0.066 0.995 0.993 -0.002 0.966 0.959 -0.007 0.938 0.959 +0.021 0.978 0.969 -0.009 0.990 0.989 -0.001
Kappa 0.7644 0.8491 +0.0847 0.9935 0.9911 -0.0024 0.9564 0.9483 -0.0081 0.9217 0.9483 +0.0266 0.9718 0.9605 -0.0113 0.9871 0.9855 -0.0016
ROC Area 0.972 0.986 +0.014 0.998 0.996 -0.002 0.984 0.982 -0.002 0.987 0.993 +0.006 0.998 0.998 0.000 0.999 0.998 -0.001
By ignoring eliminated features with selection algorithm, Naïve Bayes and RBF Network classifiers’ accuracy were increased while others decreased. When inspecting the changing rates of accuracies, it is evident that the decreasing accuracies' changing rates are quite small. On the other hand, serious computation power savings (78.75%) are obtained by reducing number of features from 160 to 34. By inspecting Table 1, most accurate classifier is IBk algorithm and can be used for real time testing with only selected attributes.
References Bradski, G., & Kaehler, A. (2008). Learning OpenCV: Computer vision with the OpenCV library: " O'Reilly Media, Inc.". Chao, W.-l. (2011). Gabor wavelet transform and its application. R98942073. Derpanis, K. G. (2007). Gabor filters. Hall, M., Frank, E., Holmes, G., Pfahringer, B., Reutemann, P., & Witten, I. H. (2009). The WEKA data mining software: an update. ACM SIGKDD explorations newsletter, 11(1), 10-18. Hall, M. A. (1999). Correlation-based feature selection for machine learning. The University of Waikato. Ilonen, J., Kämäräinen, J.-K., & Kälviäinen, H. (2005). Efficient computation of Gabor features: Lappeenranta University of Technology. Kılıçaslan, Y., Güner, E. S., & Yıldırım, S. (2009). Learning-based pronoun resolution for Turkish with a comparative evaluation. Computer Speech & Language, 23(3), 311-331. Witten, I. H., & Frank, E. (2005). Data Mining: Practical machine learning tools and techniques: Morgan Kaufmann.
www.tojsat.net
Copyright © The Online Journal of Science and Technology
35