Histograms of Infinitesimal Neighbourhoods Lewis D. Griffin King’s College, London
[email protected]
Image analysis methods that use histograms defined over non-zero-sized local neighbourhoods have been proposed [1-4]. To better understand such methods, one can study the histograms of infinitesimal neighbourhoods. In this paper we show how the properties of such histograms can be derived through limit arguments. We show that in many cases the properties of these histograms are given by simple expressions in terms of spatial derivatives at the point analyzed.
1 Introduction Assorted results, that build on previous work on the use of local histogram methods for image processing [2-5], are reported. The introduction reviews relevant background material and establishes some formalism. The body of the paper contains new results on: averages and moments of local histograms, analytic solutions of the mode filtering equation, and information theoretic measures applied to local histograms 1.1 Structure at a Point The observation that ‘structure at a point’ is seemingly essential for Physics and yet apparently incoherent can be traced back to Zeno’s discussion [6] of the paradox of how an arrow in flight could at any given moment be both motionless and possessing of a particular velocity. Proposed resolutions of this paradox include the method of limits [7], instrumental approaches to physical theory [8], and formalisations of infinitesimals [9]. A modern formulation of the instrumental approach is the method of distributions [10] in which, in a logical positivist spirit, only the results of measurement are dealt with, rather than idealised physical quantities themselves [11]. Scale space analysis is a particular version of the distributional method, founded upon the use of Gaussian apertures as operators for measuring physical scalar functions [12]. 1.2. Differential Point Structure In the scale space framework, as in the standard calculus of infinitesimal neighbourhoods, local structure can be probed through analysis of derivatives at the point of interest [13-19]. In the scale space approach these values are obtained by application
of derivatives of the aperture function. Raw derivatives are poor descriptors of image structure as they vary with the coordinate system. Instead, satisfactory descriptors can be obtained through combination of derivative values into coordinate system inde-
pendent quantities such as the gradient magnitude L2x L2y
1 2
.
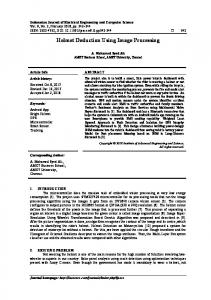
When the emphasis is on invariant quantities, it is convenient to employ gauge coordinates. In particular, in w,v-gauge coordinates where the w-direction is uphill along the gradient and the v-direction is tangent to the isophote, the expression for the gradient magnitude simplifies to Lw . The w,v-system will be used in what follows. 1.3. Statistical Point Structure An alternative way to probe local structure is consider the histogram of values visible within an aperture [2-4] (see figure 1). For a Gaussian aperture ( Gs r 4 s e 1
H s L p :
r r 4s
) of scale s centred on the origin, the histogram is given by
G r . L r p dr . In so far as this histogram depends upon the s
2
underlying image, it is dependent upon the image derivatives at the origin, but in a complex manner. The relationship does, however, simplify in the limit as the aperture size goes to zero [5].
Figure 1 – The left panel shows an example image region centred on a regular point. The central panel shows a gaussian aperture. The right panel shows the histogram of the image at left within the aperture shown in the centre. The mean, median and mode of the histogram are marked, as are the corresponding isophotes in the underlying image on the left. The median isophote divides the image into two regions with equal integral of the aperture weighting.
As scale tends to zero, the histogram tends to a delta function (i.e.
lim H s L p p L 0 ), which obscures analysis of its limiting form. To better s 0
study the limit, we can use the trick of fixing the aperture scale and resizing the image in the spatial and intensive dimensions. Following this procedure one discovers that in
the zero scale limit, the local histogram is Gaussian in form with a width related to the gradient (i.e. the coordinate-invariant part of the 1st order differential structure): 1 1 lim H1 s 2 L s 2 . _ p GLw2 p L 0 s 0 The first-order manner in which this histogram evolves as the scale is increased from 0 is captured by an expression that depends upon the second order structure: 1 1 12 1 2 H1 s 2 L s 2 . _ p 2Lw Lvv 2Lww p 2 .Lww .GL 2 p L 0 s 2 w s s 0 4 Lw
2 Averages and Moments of Local Histograms As has been presented elsewhere [5], from the equations in section 1.4 one can compute the mean ( 2 H s L L 0 Lvv Lww s o s 2 ), median
H L L 0 L
( 1 H s L L 0 Lvv s o s 2 ) ( 0
s
vv
and
mode
2Lww s o s 2 ) of local histograms for small s. It is also
possible to calculate moment-based measures of local histograms for small s. For example, the variance (second moment) depends on the local gradient
v s 2Lw s o s3 , while the skewness (third moment normalized by the second) 2
depends on the second derivative in the gradient direction k s 6Lww s o s 2 . These results can be used for the troublesome task of estimating the median and the mode of sparse image histograms (such as result from 33 neighbourhoods). Consider, for example, the discretized aperture with values
100 40 25 79 44 13 59 28 0
1 4 1 1 4 16 4 36 1 4 1
[20], applied to a patch of image
, resulting in the histogram shown in figure 2. Using a standard
approach, the mean would be calculated to be 42.4, but both the median and mode would be 44. Instead the skew of the histogram can be calculated to be 12.6 and this can be used to adjust the mean and arrive at 40.3( 42.4 16 12.6 ) for the median and 36.1( 42.4 12 12.6 ) for the mode. Alternatively, the skewness and the mean can be used to estimate Lww and Lvv . To do this, the scale of the aperture must be known, but this can be readily calculated
using the expression s
1 4
x
2
y 2 Gs x, y dx dy ) which, applied to the mask
above, gives an equivalent scale of
Lvv
1 sd
42.4 44
1 6
12.6 22.2
sD 16 . Thus
Lww 12.6 6 sD 12.6
and
mode
median mean
Figure 2 – The sparse histogram corresponding to a 33 aperture applied to a typical image region (see text above). The mean has been calculated in the normal manner. Under a literal interpretation of the histogram, the median and mode would both be located at the main spike; however, the skew-based method described in the text places them at the marked locations.
3. Image Simplification The concept of progressively simplifying an image is well established [21]. The obvious technique is iteratively to replace simultaneously the value at each point of the image by the average of the values within an aperture around the point. The effect of such filtering will depend upon the size and shape of the aperture. To remove this dependency one can to consider the limiting process as smaller apertures are used and the number of iterations is increased. In the limit, the apertures become infinitesimal and the iteration number is replaced by a continuous time parameter. At the limit, the effect of filtering can only be dependent on differential measures of the image and so infinitesimal filtering is always describable by a partial differential equation. 3.1 Mean, Median and Mode Filtering Different definitions of average, result in different filtering schemes [22-24]. Using the mean as the averaging operator results in a scheme equivalent to linear diffusion [12], described by Lt2 Lvv Lww – where t2 is the time parameter. Using the median causes the image to evolve (at regular points) according to Lt1 Lvv , also know as mean curvature flow [25]. Using the mode results in the image evolving according to Lt0 Lv v 2Lww at regular points, and Lt0 0 at critical points [5]. Mode filtering is distinctly different in effect from mean or median. As mode filtering progresses, the 2 Lww term has the effect of de-blurring and so enhancing edges, while the Lvv term stabilizes this process and prevents the developing loci of discontinuity from becoming too ragged. Away from developing edges, the image changes in value towards nearby critical points. The final result seems to be a mosaic of plateaus separated by discontinuities, though this has not been proved. At this point, the image is unaffected by further applications of the mode filtering procedure.
Figure 3 – Shows the effect of mean (left column), median (centre) and mode (right) filtering. The first row shows the original image; the other rows reading downwards show the progressive effect of repeated filtering after 4, 16 and 64 iterations. The mode-filtered image at bottom right is the final state for this image; further mode filtering has no effect.
Mean-filtering, being linear, is straightforward to implement; median- and modefiltering, being non-linear, are not. Results from attempted numerical implementations of these filtering schemes are shown in figure 3. The qualitative effect of median filtering is similar to results presented by other authors under the guises of mean curvature flow [26] as well as median filtering [25]. For mode filtering, although the results are in rough qualitative agreement with expectation, the algorithm can only truly be assessed by comparison to explicit solutions of the evolution equations. In the next section we report progress on identifying such explicit solutions.
3.2 Analytic Solutions to the Mode Filtering Equations An exact solution to the mode filtering equation is provided by a family of erf func-
tions E x; t0 c erf x 8(c t0 )
12
. Since these functions are 1D, the mode filter-
ing equation reduces to Et0 2Exx , the truth of which is easily established. As this family evolves, a blurred step edge becomes increasingly sharp until at t0 c it becomes a sharp step edge ( E x; t0 c sgn x ), after which point there is no further
change. The above solution is of some use in evaluating our numerical implementation, but it does not feature any extrema. A 1D solution that does includes extrema, but is how
ever only approximate, is S x; t0 0 2i11 e
2 2i 1 t0 2
i 0
cos 2i 1 x . As figure 4
shows, this describes the formation of a square wave (at t0 0 ) from a blurred square wave (at t0 0 ). At regular points ( x n ) the family of functions satisfy the evolution equation St0 2S xx exactly as required. Unfortunately, the extremum change value slightly with t0 , which should not occur with proper mode filtering. The movement is small though (less than 0.1% for t0 0.05,0 ).
t
0.05
t
0.04
t
0.03
t
0.02
t
0.01
t
0
Figure 4 – Shows a blurred square wave evolving into a sharp square wave. The evolution satisfies the mode filtering equations except at the extrema, which change value slightly.
4. Information Theoretic Measures Image registration methods based upon information theoretic measures are becoming common [27, 28]. In this context, information measures are used to quantify the degree to which two images are in correct registration. Optimisation routines are then used to explore an appropriate space of transformations to discover the best possible registration according to the measure.
At the heart of any information theoretic approach is Shannon’s measure (H) of the entropy of a distribution D, defined as H D D p ln D p dp [29]. Entropy measures something similar to variance, especially for unimodal distributions. For example, the entropy of a Gaussian distribution is H Gs _ 12 1 ln 4 s . For image registration purposes, a measure ‘mutual information’, that is defined in terms of entropy but that applies to joint distributions, is used. The joint distribution (J) of a pair ( U ,V : 2 ) of registered images is defined as
J u, v
1
U r u V r v dr ; where
is the region of overlap. The
mutual information (M) of J measures the degree to which a value of one variable (e.g. u) of the joint histogram is predictable from the value of the other variable (v). Good registration corresponds to high mutual information i.e. the values of one image can be well predicted from the values of the other. The formula for mutual information is: M J H J _, _ H J u, _ du H J _, v dv While mutual information gives good registration results most of the time, it has been observed that it can result in obvious mis-registration even with images not specially constructed to fool the algorithm [30]. It has been suggested that this can be prevented by using a global mutual information measure combined by multiplication with a local measure integrated across the image domain [31]. We describe below how such local measures can be understood within an information theoretic framework.
4.1. Mutual Information defined for an Infinitesimal Aperture As a preliminary result, we first build on the equations given above for (i) the entropy of a Gaussian distribution, and (ii) mutual information of a 2D distribution. These equations allow one to calculate the mutual information of a 2D gaussian distribution Au 2 2 Buv Cv2 AC to be M E 12 ln . Our next step is E u, v 1 AC B 2 e 2 AC B to consider two registered images (U and V), both regular and (for convenience) zerovalued at the origin i.e. U x, y ax by ... and V x, y x y ... . Just as we can define the histogram of a single image within an aperture, so we can define the joint histogram within an aperture of a pair of images. For a Gaussian aperture of scale s centred at the origin, the joint histogram of U and V is: H s u, v Gs r U r u V r v dr In the limit, as we reduce the scale of the aperture down to zero, the joint histogram becomes dependent upon only the first order structure of the two images and the joint histogram tends to the form of a two-dimensional gaussian: u
lim H s u, v lim 4 s a b e 1
s0
s0
2 2 a b u v a b a 2 b2 v 4 s a b
2
So, using the already stated expression for the mutual information of a twodimensional Gaussian one arrives at: a 2 b2 2 2 lim M H s u, v 12 ln 2 s 0 a b a Finally, if the angle between the two gradient vectors and is denoted , b then the expression for mutual information simplifies to: lim M H s u, v ln sin .
s 0
This expression reminds us of the expression
1 2
(1 cos 2 ) used as a measure of
local registration quality in a recently proposed [31] improvement to standard global mutual information measures. The two measures are compared in figure 5.
2
0
2
Figure 5 – Compares two measures of local registration. The sinusoidal dark curve is 1 2
(1 cos 2 ) , the paler curves are our alternative ln sin .
5. Concluding Remarks In this paper, we have defined local histograms as the limit of histograms defined for gaussian apertures as the scale of the aperture tends to zero. We have shown how properties of these local histograms are, in many cases, given by simple expressions in terms of spatial derivatives of the image at the aperture centre. We have given examples of the use of local histogram operations in three areas: image measurement, image filtering and image registration. In all three cases, the details of the actual implementation of these methods on a discrete grid of pixels is ad hoc. Several questions are raised by this approach. Consider, for example, the following. The equation that was presented for the first order deviation of the local histogram from gaussian form depended upon Lw , Lww and Lvv but not Lwv . Which other derivatives is the form of the local histogram unaffected by? Or to turn the question around,
what characterizes the portion of the differential structure at a point that is discoverable from examination of the local histogram at the point?
References [1] Noest, A.J., Koenderink, J.J.: Visual coherence despite visual transparency or partial occlusion. Perception 19((1990) 384 [2] Griffin, L.D.: Scale-imprecision space. Image Vis. Comput. 15(5) (1997) 369-398 [3] Koenderink, J.J., Van Doorn, A.J.: The structure of locally orderless images. Int. J. Comput. Vis. 31(2-3) (1999) 159-168 [4] van Ginneken, B., ter Haar Romeny, B.M.: Applications of locally orderless images. J. Vis. Comm. Imag. Rep. 11(2) (2000) 196-208 [5] Griffin, L.D.: Mean, Median and Mode Filtering of Images. Proc. Roy. Soc. A 456(2004) (2000) 2995-3004 [6] Russell, B.: The Principles of Mathematics. Routledge, London (1903) [7] Newton, I.: Principia. (1687) [8] Leibniz, G.W.: Mathematical Works. Open Court, London (1920) [9] Diener, F., Diener, M., ed.: Nonstandard Analysis in Practice. Springer-Verlag, Berlin (1995) [10] Richards, J.I., Youn, H.K.: Theory of Distributions. Cambridge University Press, Cambridge (1990) [11] Florack, L.M.J., ter Haar Romeny, B.M., Koenderink, J.J., Viergever, M.A.: Images: Regular Tempered Distributions, In: Shape in Picture. vol. 126 (O, Y.-L., Toet, A., Foster, D., Heijmans, H.J.A.M., Meer, P., eds.), Springer-Verlag, Berlin, pp. 651-660. [12] Koenderink, J.J.: The Structure of Images. Biol. Cybern. 50(5) (1984) 363-370 [13] Koenderink, J.J.: What is a feature? J. Intell. Syst. 3(1) (1993) 49-82 [14] Koenderink, J.J.: Operational Significance of Receptive-Field Assemblies. Biol. Cybern. 58(3) (1988) 163-171 [15] Koenderink, J.J., van Doorn, A.J.: Receptive Field Assembly Specificity. J. Vis. Comm. Imag. Rep. 3(1) (1992) 1-12 [16] Koenderink, J.J., van Doorn, A.J.: Generic Neighborhood Operators. IEEE Trans. Patt. Anal. Mach. Intell. 14(6) (1992) 597605 [17] Koenderink, J.J., van Doorn, A.J.: Receptive-Field Families. Biol. Cybern. 63(4) (1990) 291-297 [18] Koenderink, J.J., van Doorn, A.J.: Representation of Local Geometry in the Visual-System. Biol. Cybern. 55(6) (1987) 367-375 [19] Romeny, B.M.T., Florack, L.M.J., Salden, A.H., Viergever, M.A.: Higher-Order Differential Structure of Images. Image Vis. Comput. 12(6) (1994) 317-325 [20] Lindeberg, T.: Scale-Space for Discrete Signals. IEEE Trans. Patt. Anal. Mach. Intell. 12(3) (1990) 234-254 [21] Marr, D.: Vision. W H Freeman & co, New York (1982) [22] Davies, E.R.: On the noise suppression and image enhancement characteristics of the median, truncated median and mode filters. Patt. Recog. Lett. 7(2) (1988) 87-97 [23] Evans, A.N., Nixon, M.S.: Mode filtering to reduce ultrasound speckle for feature extraction. IEE Proc. Visual. Image & Sig. Process. 142(2) (1995) 87-94 [24] Torroba, P.L., Cap, N.L., Rabal, H.J., Furlan, W.D.: Fractional order mean in image processing. Opt. Eng. 33(2) (1994) 528533 [25] Guichard, F., Morel, J.-M.: Partial differential equations and image iterative filtering, CEREMADE, Université Paris IX, Paris. [26] Weickert, J.: Anisotropic Diffusion in Image Processing. Teubner, Stuttgart (1998) [27] Viola, P.A.: Alignment by Maximization of Mutual Information, In: Artificial Intelligence Laboratory, Massachusetts Institute of Technology, pp. 156. [28] Maintz, J.B.A., Viergever, M.A.: A survey of medical image registration. Med. Image Anal. 2(1) (1998) 1-36 [29] Cover, T.M., Thomas, J.A.: Elements of Information Theory. John Wiley & sons(1991) [30] Studholme, C., Hill, D.L.G., Hawkes, D.J.: An overlap invariant entropy measure of 3D medical image alignment. Pattern Recognit. 32(1) (1999) 71-86 [31] Pluim, J.P.W., Maintz, J.B.A., Viergever, M.A.: Image registration by maximization of combined mutual information and gradient information. IEEE Trans. Med. Imaging 19(8) (2000) 809-814