3 â University of Leipzig - Department of Computer Engineering .... Machine learning algorithms are essential tools for an online-classification of learning.
ESANN 2011 proceedings, European Symposium on Artificial Neural Networks, Computational Intelligence and Machine Learning. Bruges (Belgium), 27-29 April 2011, i6doc.com publ., ISBN 978-2-87419-044-5. Available from http://www.i6doc.com/en/livre/?GCOI=28001100817300.
Classifying mental states with machine learning algorithms using alpha activity decline Carina Walter1,3, Gabriele Cierniak2, Peter Gerjets2, Wolfgang Rosenstiel1, Martin Bogdan3,1 1 - Eberhard-Karls University Tuebingen - Department of Computer Engineering Sand 13, 72076 Tuebingen - Germany 2 - Knowledge Media Research Center Konrad-Adenauer-Str. 40, 72072 Tuebingen - Germany 3 – University of Leipzig - Department of Computer Engineering Johannisgasse 26, 04103 Leipzig - Germany Abstract. This publication aims at developing computer based learning environments adapting to learners’ individual cognitive condition. The adaptive mechanism, based on Brain-Computer-Interface (BCI) methodology, relays on electroencephalogram (EEG)-data to diagnose learners’ mental states. A first within-subjects study (10 students) was accomplished aiming at differentiating between states of learning and non-learning by means of EEG-data. SupportVector-Machines classified characteristics in the EEG-signals for these two different stimuli on average as 74.55% correct. For individual students the percentage of correct classification reached 92.22%. The results indicate that continuous EEG-data combined with BCI methodology is a promising approach to measuring learners’ mental states online.
1
Introduction
As generally known, learning is not only dependent on the learner itself but also on the presentation of the material to learn. According to the individual different principles of each learner, learning materials should be developed in such a way that they can adapt to learner’s mental states including prior knowledge, mental workload etc. Such adaptive learning materials are thought to promote learners during learning in an individual, and hence, optimal way. In the future characteristics in EEG-signals might be used for online classification of mental states to adapt computer based learning environments for each learner individually. The adaptive mechanism will be based on BCI methodology. According to the mental workload, learning environments can be adjusted to prevent overstrained or underchallenged mental states. This work is engaged in classifying different mental workload states during learning and non-learning tasks with the help of EEG-data [1]. Frequencies in EEGdata can be subdivided into different frequency bands. Together with the locality of their occurrence these can be correlated to specific mental states. A pilot-study with ten students (12-14 years) was conducted, aiming at differentiating between states of learning and non-learning by means of EEG-data. A learning stimulus (angle theorems = high mental workload) and non-learning stimulus (comic-strips = low mental workload) were presented to each subject alternately. Neurophysiologic studies [2] postulated that the mental workload could be detected in a decrease of alpha band activity (8-13Hz) in the parietal, occipital brain area.
405
ESANN 2011 proceedings, European Symposium on Artificial Neural Networks, Computational Intelligence and Machine Learning. Bruges (Belgium), 27-29 April 2011, i6doc.com publ., ISBN 978-2-87419-044-5. Available from http://www.i6doc.com/en/livre/?GCOI=28001100817300.
Klimesch et al. [3] also discovered a decrease of alpha band activity during a learning task. Therefore it was suggested that during the learning stimulus the alpha band activity decreases in comparison to the non-learning task. To classify the mental states optimally, a non-learning stimulus (comic-strip) was required, which was used to compare to the mental states during learning stimulus. By means of a pre-test it was guaranteed that the students had no knowledge of angular geometry prior to the study. After learning, a post-test showed that they had acquired knowledge of angle theorems. On the basis of these two different stimuli, angle theorems and comic strips, EEG-data was determined on different characteristics in the EEG frequency bands. The differences were used to classify the two mental states during learning and non-learning stimuli with the help of machine learning algorithms on EEG-data.
2
Materials and Methods
2.1 Participants and Experiment Design Subjects were ten students (12-14 years) without knowledge of angular geometry who participated voluntarily in the experiment. None of the subjects had participated in an earlier-performed EEG study. The experiment is a within-subject design and comprises four phases. First, subjects had to solve a pre-test to assure they had no knowledge of angular geometry prior to the study. Phase 2 consisted of three learning cycles, 11min each. In each cycle participants were asked to study five angle theorems and watch five comicstrips. Each theorem and comic-strip was presented for 45s. Comic-strips and angle theorems were presented alternately. All participants studied 15 (3x5) angle theorems and 15 comic-strips. In phase 3, students applied the theorems to geometrical exercises with a German version of the Carnegie Learning’s Cognitive Tutor provided by Schwonke et al. [4]. Finally, a post-test had to be accomplished. Participants had to solve the same problems as in the pre-test, to achieve a direct comparison of their knowledge before and after the learning cycles. The whole experiment took approximately 3 hours for each subject.
2.2 Apparatus and EEG recordings A set of sixteen electrodes, attached to the scalp, were used to record EEG-signals. The electrodes were placed according to the International Electrode (10-20) Placement System. An electrooculogram (EOG) was recorded through three additional electrodes; two placed horizontally at the outer canthi of both eyes and one placed in the middle of the forehead between the eyes. EEG and EOG signals were amplified by two 16-channel biosignal amplifier systems (g.USBamp Generation 3.0). Sampling rate was 256Hz. The impedance of each electrode was under 10k . EEGdata was high-pass filtered at 0.1Hz and low-pass filtered at 100Hz during the recording. Furthermore a notch-filter was disposed between 48-52Hz to filter the noise of the electric circuit.
Ω
406
ESANN 2011 proceedings, European Symposium on Artificial Neural Networks, Computational Intelligence and Machine Learning. Bruges (Belgium), 27-29 April 2011, i6doc.com publ., ISBN 978-2-87419-044-5. Available from http://www.i6doc.com/en/livre/?GCOI=28001100817300.
2.3 Data preprocessing Artifact removal is one of the most important signal preprocessing steps for EEGdata. EEG-signals could be adulterated because of blinks, eye movements or head movements. The EOG-signals were used to detect and to remove blinks and eye movements. The other accessory artifacts were also manually removed. With the aid of an experiment protocol it was ensured that the noise in the data aroused from head movement or other artifacts. Neuronal activities were unaffected by filtering. Because of the low number of trials the artifact free recordings were segmented in consecutive epochs of 15s for each subject and each stimulus. For each subject and each condition 45 (5x3x3) trials occurred which were used for classification, after preprocessing and visual analysis. This segmentation was possible because no significant variation was detected in the signal over a full trial. Furthermore a Common Average Reference Filter was applied to generate a better reference. Additionally a FIR-Filter was used as a low-pass filter at 25Hz because the frequency of interest was within the alpha band (8-13Hz) [2, 3]. With application of a detrend function a linear drift of the baseline was removed in the EEG-signals. The feature extraction was done by Autoregressive Coefficients. The autoregressive model was calculated with the Burg-Algorithm [5].
2.4 Analysis and Classification Before classifying, a visual analysis was made to determine whether differences in EEG-data during learning and non-learning stimuli are distinguishable. 2.4.1 EEG-data analysis Data was visually analyzed using BCI2000 Offline Analysis*, an open source MATLAB toolbox developed for neurophysiological data analysis. This Toolbox is suitable to detect features in EEG-data which can be used for classification. First the data of every subject was analyzed individually. Secondly the data of all subjects was averaged and analyzed. For the visual analysis a power spectral density plot was generated and r²-values of the two conditions (learning, nonlearning) were calculated. The plot showed the energy as a function of frequency. 2.4.2 Machine learning algorithms Machine learning algorithms are essential tools for an online-classification of learning and non-learning tasks, which is the aim of this project. In this project a Support Vector Machine (SVM) with Radial-Basis-Function Kernel was used to classify mental states in EEG-data during learning and non-learning tasks. As postulated in [6], this is the promising Kernel for analyzing EEG-data. Therefore the toolbox LIBSVM† was used. The Kernel parameter γ = 0.5 had to be specified by the user before training. A 10-fold cross validation was accomplished to verify the accuracy of the trained SVM. The accuracy served as a quality criterion for the frequency interval and the specified electrodes. Since a SVM was used as classifier, the EEG-data was scaled with the zscore function from Statistics Toolbox in MATLAB. * †
BCI2000: www.bci2000.org http://www.csie.ntu.edu.tw/~cjlin/libsvm/
407
ESANN 2011 proceedings, European Symposium on Artificial Neural Networks, Computational Intelligence and Machine Learning. Bruges (Belgium), 27-29 April 2011, i6doc.com publ., ISBN 978-2-87419-044-5. Available from http://www.i6doc.com/en/livre/?GCOI=28001100817300.
4
4
x 10
12 non−learning learning
10
Power/Frequency (µV/sqrt(Hz))
Power/Frequency (µV/sqrt(Hz))
12
6 4 2
10
20
30
40
non−learning learning
10
8
0
x 10
50
8 6 4 2 0
10
Frequency (Hz)
20
30
40
50
Frequency (Hz)
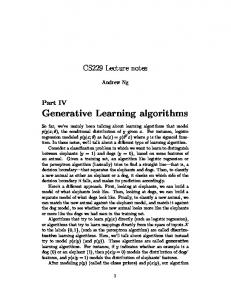
Fig. 1: Power spectral density plot, left: over all subjects, electrode Oz; right: Subject AS, electrode Po8.
8Hz 10Hz 12Hz 14Hz
4Hz 69.09 74.55 73.64 71.82
6Hz 65.45 73.64 74.55 73.64
8Hz 66.82 67.73 70.91
10Hz 8Hz 10Hz 12Hz 14Hz
62.73 61.36
4Hz 66.67 72.22 74.44 77.78
6Hz 58.89 82.22 86.67 87.78
8Hz
10Hz
75.56 82.22 86.67
86.67 86.67
Table 1: Classification accuracy in % over all channels (column: starting-; row: endingfrequency); left: results over all subjects; right: results for subject AS
3
Results
First, the results over all subjects are presented followed by the results of subject AS, which showed the best results. Because of the individual brain signals and the imprecise frequency boundaries between subjects the hypotheses is that each subject reaches higher results individually than data averaged over all subjects.
3.1 Visual Analysis To detect the frequency band and the positions of electrodes which had to be used for classification, a visual analysis of the frequency power was done first. The analysis was done with the help of a power spectral density plot, constructed with BCI2000 Offline Analysis. The plots are shown in Fig. 1. The continuous line represents the energy as a function of frequency during learning stimuli (angle theorems) and the dashed line during non-learning stimuli (comic-strips). 3.1.1 All Subjects The power spectral density averaged over all subjects is shown in Fig. 1, left. A decrease of alpha band activity could be recognized during the learning stimulus in
408
ESANN 2011 proceedings, European Symposium on Artificial Neural Networks, Computational Intelligence and Machine Learning. Bruges (Belgium), 27-29 April 2011, i6doc.com publ., ISBN 978-2-87419-044-5. Available from http://www.i6doc.com/en/livre/?GCOI=28001100817300.
comparison to the signal during the non-learning stimulus, as Klimesch et al. [3] postulated. The r²-value is highest in the parietal, occipital brain area in alpha frequency band, with r² = 0.025. 3.1.2 Subject AS Consistent with literature [3], in 9 out of 10 subjects the alpha band activity decreases during angle theorem tasks which require higher mental workload than comic reading tasks. In Fig. 1 right, the power spectral density plot of subject AS is presented, because it reached best results. The energy during learning stimulus decreased in the frequency interval of 8-13Hz in comparison to energy during non-learning stimulus. The r²-value was highest in the right parietal, occipital brain area with r² = 0.35.
3.2 Classification In previous analyses it was detected, that most differences between the two mental states during non-learning and learning tasks appear in the alpha frequency band in the right parietal, occipital brain area [2, 3, 7]. The boundaries of frequency bands are not exactly definable between different subjects, thus the frequency interval between 4-14Hz was analyzed. Because geometrical processing is located in the right hemisphere [7] electrodes were reduced on the left to enhance computing time. 3.2.1 All Subjects The maximal classification accuracy, averaged over all subjects, amounted to 74.55% in frequency interval 6-12Hz and 4-10Hz, as shown in Table 1, left. A reduction of electrodes during analysis did not achieve higher accuracy values. The reasons therefore are characteristics in brain activity, specific for each individual during mental effort and relaxation. Averaged over all subjects constraints became inexact. 3.2.2 Subject AS In 9 out of 10 subjects a decrease in alpha band activity was detected during learning task. Highest accuracy rates were reached for subject AS. The rates over all 16 electrodes are presented in Table 1, right. EEG-data classification, in frequency range of 6-14Hz, yields the maximal classification accuracy, with 87.78%. For each subject it was possible to enhance the accuracy by reducing electrodes. Subject AS reached 92.22% classification accuracy by classifying EEG-data in 6-14Hz range and under employment of electrodes Fz, Cz, C4, Pz, Po8 and Oz.
3.3 Recapitulation The classification of two mental states in EEG-data during non-learning and learning tasks using machine learning algorithms has been proven here. A desynchronisation of the alpha band activity during learning geometrical theorems in comparison to comic-strips was detected in the right parietal, occipital brain area. This is consistent with literature [7], which shows geometry being processed in the right hemisphere. These differentiations were successfully classified by using a SVM with RBF-Kernel. The mental states during learning and non-learning tasks for 7 out of 10 subjects could be classified for each individual subject with an accuracy of at least 80.00%.
409
ESANN 2011 proceedings, European Symposium on Artificial Neural Networks, Computational Intelligence and Machine Learning. Bruges (Belgium), 27-29 April 2011, i6doc.com publ., ISBN 978-2-87419-044-5. Available from http://www.i6doc.com/en/livre/?GCOI=28001100817300.
During the classification over all subjects a loss of accuracy was observed, reaching 74.55%. Imprecise frequency band boundaries and individual cognitive treatments of each subject are reasons that the difference between mental states over all subjects, is not as significant as for each subject individually. The classification accuracy as well as the r²-value decreased. Therefore it is advisable to train each classifier for each subject individually, to get the best classification accuracy to guarantee an optimal adaptive learning environment for each subject individually. A post-test showed that a learning success of 90% took place for each subject.
4
Conclusion
Desynchronisation of the alpha band activity could be measured during learning compared to non-learning tasks, which have been classified by a SVM. In the future a comparison of the used algorithm with existing techniques and classification methods has to be accomplished. There is no comparative study in literature, because it was an individual design and not a benchmark test. To ensure the features measured in EEG are based on mental states while learning geometrical theorems, continuative studies will be done comparing grammar vs. comic and comic vs. comic stimuli. The hypotheses are that these studies will provide no differences in the power spectrum of the right parietal brain area, thus the classification should not be successful. In the future detected characteristics in EEG-signals could be used for online classification of learners’ mental states using SVMs and BCI methodology, to optimize computer based learning environments for students individually.
Acknowledgments This work was supported by grants from the BMBF funded Bernstein Center BFNT Freiburg-Tübingen and the WissenschaftsCampus Tübingen.
References [1]
P. D. Antonenko, F. Paas, R. H. Grabner, T. van Gog. Using electroencephalography (EEG) to measure cognitive load, Educational Psychology Review, 22: 425-438, Springer, 2010.
[2]
A. F. Kramer. Physiological metrices of mental workload: A review of recent progress, In D. Damon (Ed.), Multiple Task Perfomance, pages 279-328, London, Taylor& Francis, 1991.
[3]
W. Klimesch. EEG alpha and theta oscillations reflect cognitive and memory performance: a review and analysis, Brain Research Reviews, 29:169-195, Elsevier, 1999.
[4]
R. Schwonke, J. Wittwer, V. Aleven, R. Salden, C. Krieg, A. Renkl. Can tutored problem solving benefit from faded worked-out examples? In S. Vosniadou, D. Kayser and A. Protopapas (Eds.), Proceedings of the 2nd European Cognitive Science Conference, pages 59-64, New York, NJ: Erlbaum, 2007.
[5]
T. M. Cover, J.A. Thomas. Elements of information theory, Hoboken, NJ: Wiley-Interscience, 2006.
[6]
S. Halder. Online Artifact Recogniton and Removal for Brain Computer Interface, diploma thesis, Tuebingen: Eberhard-Karls University, 2006.
[7]
R. F. Schmidt, F. Lang. Physiologie des Menschen: Mit Pathophysiologie, Heidelberg, Germany: Springer Medizin Verlag, 2007.
410