To Main Proceedings Document
Client Involvement in Simulation Model Building: Hints and insights from a case study in a London hospital David C. Lane and Camilla Monefeldt London School of Economics and Political Science - University of London Management LSE (Operational Research Department), London School of Economics and Political Science, Houghton St., London WC2A 2AE, United Kingdom Telephone: (UK)20-7955-7336 E-mail:
[email protected] This paper describes the collaborative process of building a simulation model to understand patient waiting times in an accident and emergency department. The purpose is to explore the issues that arise when involving health care professionals in the process of model building. The study background is presented, along with some general process themes which can be seen to run through the account that follows. That detailed account of the modelling process then forms the core of the paper. The general process themes are revisited in order to suggest some hints and insights on how the standard system dynamics methods for involving clients may apply in the health care context. Further collaborative studies are encouraged, since system dynamics has much to offer health care policy, whilst the process of building such models can be rewarding for all concerned. 1. Introduction This paper describes the process used to build a system dynamics simulation model. The aim of the model was to understand patient waiting times in the Accident and Emergency Department of a central London hospital. However, the purpose of this paper is to explore some of the issues that arise when MS/OR practitioners try to involve health care professionals in the process of model building. Because health care systems involve the co-ordination of interacting resources and human activities it is natural that they generate a range of organisational problems that are ripe for tackling by the scientific approaches of MS/OR (Smith, 1995; Ozcan and Smith, 1998). One such approach is simulation modelling (for some examples see Davies and Davies, 1986; Millard and McClean, 1996; El-Darzi, Vasilakis, Chaussalet and Millard, 1998). Validation of such simulation models has long been a concern (Naylor and Finger, 1967; Horn, 1971; Sargent, 1982). However, even proper attention to such technical matters did not always prevent worthwhile models being ignored by those they intended to assist (Watt, 1977). Concern therefore turned to the twofold aim of creating simulation models which are both technically accurate and actually used as decision aids (Gass, 1983; Tilanus, 1985; Roy, 1993); the latter occurring because model recommendations are accepted by problem owners as offering meaningful solutions (Eden, Sims and Jones, 1979; Checkland, 1985). Similar issues arise in the field of system dynamics modelling, the approach used in the accident and emergency (A&E) study considered here. System dynamics is a form of simulation modelling in which feedback loops, non-linear relationships and accumulation processes are used to understand the structural sources of dynamic behaviour (Forrester, 1961; 1987; 1968). To create technically accurate models which influence decision makers, the system dynamics field has long emphasised the need to involve clients in the modelling process. The two reasons for this are simply stated. Firstly, much information exists only in the heads of decision makers; to build credible models it is therefore necessary to access these ‘mental databases’ (Forrester, 1961; 1992). Secondly, model recommendations are only This paper has been accepted for publication by Health Care Management Science.
implemented by clients familiar with the reasoning behind them; clients must understand model assumptions and themselves learn why insights make sense (Roberts, 1972; Geus, 1988). Work on client involvement in system dynamics modelling is currently more craft than science (c.f. Andersen, Richardson and Vennix, 1997), structured research being at an early stage (Rouwette, Vennix and Mullekom, 1999). Generally, the emphasis has been on business applications (Morecroft, 1992; Lane, 1992) and what knowledge has arisen so far is normally presented tentatively - not as results but as hints and insights, or sometimes ‘scripts’ (Andersen and Richardson, 1997). This state of affairs motivates the present paper. Interest is not in the completed model, or the experiments conducted with it since these are reported elsewhere (Lane, Monefeldt and Rosenhead, 2000). Instead, the micro-sociological approach of ‘participant-as-observer’ is used to give a detailed account of some of the trials and tribulations of the process which produced that model (Morison, 1986). This approach has been employed previously to illuminate the detailed workings of modelling exercises (Lane, 1993; Vennix, 1995; Lane, 1997; Vennix, 1996). The specific aim here is to examine tentatively some process themes that arise when involving health care professionals in system dynamics model building. The paper proceeds as follows. In Section 2 the motivation and context for the modelling study are presented, along with some general client involvement themes that can be seen to run through this paper. The core of the paper, Sections 3 to 5, then present an account of the modelling process. These sections are primarily structured around the main meetings of the study (the preparations for these as well as associated activities also being described) and the specific observations that may be derived from those meetings. In Section 6 the subsequent use of the model is briefly discussed but the main interest returns to the more general process themes introduced in Section 2. The aim is to suggest some hints and insights on the best means of involving clients in model building. 2. Background and process themes of the study 2.1 Background to the A&E study This modelling study deals with delays experienced by patients at A&E departments in National Health Service hospitals, a source of considerable public concern. Because A&E sorts through a wide range of clinical conditions, waiting times are dependent on the extent of treatment given to a patient. However, particular concern has fallen on that minority of patients (15-20% (Audit Commission, 1996)) whose conditions merit admission. The wait from the ‘decision to admit’ until admission onto a hospital ward should be no more than two hours (Department of Health, 1996) but this guideline is routinely broken and reports are widespread of patients waiting overnight prior to admission. Such delays are produced by the interaction of a number of factors: demand level, bed capacity, interacting patient flows, bed allocation procedures, staff availability and timely production of clinical test results. Bed capacity became an issue of particular importance because of the previous government’s moves to reduce what was seen as excess bed numbers in inner London. The British Medical Association estimated that 9000 acute beds were closed in England 1991-5; and the Labour Party (in opposition) produced figures of 13,000 acute bed closures between 1989/90 and 1995/6 - some 11% of the total (Guardian 12.1.96, 14.1.97). The present government also espouses the view that bed reductions can increase efficiency of usage without deleterious effects on waiting times and concern on this issue, and the state of the National Health Service in general, persists (Independent, 16.8.97, Daily Telegraph, 5.5.99). The authors’ involvement in this issue resulted from an approach by Casualty Watch, an organisation funded by various London health authorities which collects ‘snapshot’ data of
patient waiting times. The result was a 1995 MSc project at LSE, conducted by CM under the supervision of DCL. Using the iThink software (Richmond, Vescuso and Peterson, 1990), a model of the detailed processes within A&E was constructed, including patient inflows (self referrals and referrals from GPs), physician activities (involving both A&E doctors and Specialty doctors) and support activities (blood tests, radiography etc.). However, the study quickly broadened its concerns beyond A&E to include aspects of ward management and the processes by which patients scheduled for non-urgent, elective treatment are admitted to hospital or have their treatments cancelled (such patients are effectively in competition for beds with those A&E patients requiring admission). The study purpose was therefore twofold: to understand the structural causes of A&E waiting times and to examine the effect of reductions in bed capacity on those waiting times. This work produced a prototype model. Further work - undertaken in 1996 by MSc student Rachel O’Carroll under DCL’s supervision - used information from various London hospitals to check the model. However, the model remained incomplete in some respects, requiring both refinements and elaboration. Between October 1996 and March 1997, CM worked as a Research Assistant at LSE under the supervision of DCL, with assistance from Professor Jonathan Rosenhead. Funding was provided by Casualty Watch and LSE. The aim of this work was to complete the model and make it capable of simulating the performance of an A&E department. Since A&E departments differ in their operation (NHS Confederation Royal College of Physicians, 1997), it was thought important to establish a strong collaborative link with a single hospital. It was believed that with access to information held by hospital staff and the hospital databases, the model structure could be calibrated to fit a particular hospital, the relationships within it checked and parameters in the model estimated. In December 1996, Prof. Rosenhead arranged a meeting with the Clinical Manager of the A&E department at a London hospital to discuss collaboration. The subsequent agreement began the process described in the following sections. 2.2 Process themes of the paper Sections 3-5 describe the phases of this study. To help to generalise the particular details given there it is useful to track various process themes. These themes are described below and their relevance to the study phases indicated in Table 1 The theme ‘Purpose and benefits of the study’ concerns client reactions to the broad thrust of the modelling work. The purpose may seen to be threatening, counter-productive or supportive of existing concerns. The client view of the benefits of the work is important too: a client is more welcoming if obvious personal benefits are expected to flow from the work, whilst a lack of benefits may lead to the study being seen as an irrelevant imposition. The theme ‘Aggregation’ relates to the system dynamics urge to adopt a stance of ‘conceptual distance’ which “blurs events into patterns of behavior and perceives policy structure in the flow of decisions” (Richardson, 1991, p.342). There are sound reasons for considering the use of such continuous, aggregate system dynamics models in a health care context. However, an understandable focus on individual patients has meant that discrete event simulation has appeared to be the more natural simulation approach to use. This theme therefore addresses the difficulties and reactions that result from trying to use a modelling approach which takes an aggregated perspective, observable in the variables considered and parameters sought. The theme ‘Mental database’ concerns the need to obtain knowledge held only in the heads of system actors. It also treats the difficulty of doing this and clients’ response to the process. With ‘Busy health care professionals’, two ideas are conflated. Model building involves the acquisition of information by quite technical questioning of clients. Firstly, very few clients have spare time on their hands; all are busy and this time pressure may effect a modelling
study in various ways. Secondly, and more specifically, all of the staff dealt with in this work were qualified health care professionals. This raises issues about how to mesh the expertise of modellers with that of those familiar with the problem domain. The theme ‘Ownership and confidence’ concerns the degree of acceptance that a model has from a client. A model may be seen to be a ‘black box’, but still command confidence because of the scientific approach used to construct it (Pidd, 1992). In contrast, the assumptions of the model may have been exposed, quizzed and confirmed throughout, so that face validity has been checked by the client. Finally, the theme ‘Walk the system’ explores the standard advice that the best way to obtain some knowledge of the system being modelled is to observe it at first hand (Graham, 1980). The practicality and benefits of adopting this view are considered here. Whilst particular observations are made throughout the account that now follows, these themes can be seen to run through and to illuminate all of the phases and they are therefore revisited in Section 6. SP 1 Purpose And Benefits Of The Study Aggregation Mental Database Busy Health Care Professionals Ownership And Confidence Walk The System
9 9 9
Phase 1
SP 2
9 9 9 9 9
Phase 2
Misc. 1
9 9 9 9 9
Misc. 2
SP 3
9 9 9
9 9
9 9
Phase 3
Table 1. The various process themes and their relevance to the study stages, marked as correspond to the three phases of the work but are further broken down as follows: SP 1: first meeting with Dr. Parkinson (Section 3.3) SP 2: second meeting with Dr. Parkinson (Section 4.1) Misc. 1: miscellaneous consultations with other system actors (Section 4.2) Misc. 2: miscellaneous activities involved in working at a distance (Section 5.1) SP 3: third meeting with Dr. Parkinson (Section 5.2).
9.
Columns
3. Phase I: Establishing support This section presents an account of the early stages of the study; how the nature of the study was agreed and how the first meeting with the Dr. Parkinson, the study’s ‘gatekeeper’ progressed. 3.1 Terms of the collaboration The terms of the collaboration were agreed at St. Danes’ in a meeting in December 1996 with Dr. Pettit (Clinical Manager of the A&E department) and Dr. Rylands (an A&E consultant). Since it was agreed that the identity of the hospital would not be disclosed, all individual’s names - and that of the hospital itself - are pseudonyms. The LSE aim was to obtain three things. Firstly, from discussion with experienced staff members; confirmation/amendment of the model structure and relationships. Secondly, from written hospital data; best available estimates of typical values of model parameters. Thirdly, from experienced staff members; judgmental estimates of parameter values for which hard data was unavailable. This information would be gathered by field research by CM, supervised by DCL. It was anticipated that CM’s work at St. Danes’ would not make demands on Dr. William’s staff exceeding two hours per week.
Dr. Pettit and Dr. Rylands suggested Dr. Susan Parkinson, a Registrar in A&E, as the coordinating link throughout the collaboration since she had the required overview and knowledge of A&E activities. Dr. Parkinson was subsequently informed of the agreement with LSE and a meeting was arranged for 20 January.
Patients Scheduled for Elective Admission Drop Out Rate
Elective Admission Rate
Scheduling Rate
Elective Cancellation Rate
Rate of Accepted Admissions via GP
Patients in A&E
Patients on Hospital Wards
A&E Admission Rate to Wards
Arrival Rate of Post Registrated Patients
Ward Discharge Rate
A&E Discharge Rate
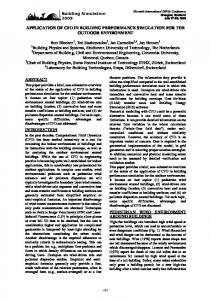
Figure 1. The over-view diagram of the system dynamics model. This was used in the initial meeting and shows the main flows of patients. The underlying model has 194 equations.
3.2 Agenda for the first meeting with Dr. Parkinson Together DCL and CM prepared the following agenda for the meeting: 1. Explain the background, aims and current stage of the study. 2. Talk through the prototype model, explaining the different building blocks. 3. Confirm and/or modify structure to fit St. Danes’ A&E. 4. Discuss current situation in A&E, including any problems and potential solutions. (This will suggest simulation experiments to conduct.) 5. Describe data needed to complete model; clarify what is available from hospital databases and what needs to be estimated through discussions with staff. 6. Arrange new meeting. This list was long for one meeting but would signal what we hoped to do during the whole collaboration. Beyond this was the aim of gaining Dr. Parkinson’s trust and establishing a good relationship between us, the model-builders, and her, the study ‘gatekeeper’ (Richardson and Andersen, 1995). Armed with portable computer and printouts of the model structure, CM arrived in good time for the 14:00 meeting. The paper now switches to her contemporaneous description. 3.3 First meeting with Dr. Parkinson, 20 January Dr. Parkinson was 10 minutes late but showed me into her office where we sat and I gave her a copy of the agenda. She had received little detail about the study and clearly did not see how we could help her department. Fortunately, we had prepared for this situation. I told her that although LSE brought skills in modelling, our knowledge of A&E was limited. However, I emphasised that by collaboration we hoped to get information about how the system operated. By exchanging ideas, together we would be able to build a model which gave a realistic representation of A&E. The model should help to improve everyone’s understanding of the causes of problems experienced in A&E. Moreover, experimentation might suggest alternative ways of deploying resources in order to improve performance. Dr. Parkinson exclaimed that simulations and model runs meant little to her, that her knowledge in computing was very limited. Our plan had been to use our prototype to draw her into the modelling process but with this reaction it seemed unwise to introduce the full computerised version. Instead I decided to keep things simple and so showed her the overview diagram, representing only the main flow of patients through the system (figure 1). Dr. Parkinson was clearly very unimpressed with the simplicity of this map, “You have to look at the individual patient. Any model using averages and aggregated patient groups will be a useless simplification.” My attempts to convince her of the benefits of a ‘first cut’ model had no effect. By 14:30 we were locked into a vicious circle of incomprehension and blinkered self-advocacy (Argyris, 1990). Our idea of having a fruitful working relationship with Dr. Parkinson was sliding away rapidly. I decided to show her the rolled-down version of the model on paper, hoping that she would realise that the simplified picture nevertheless incorporated the most important factors influencing A&E (figure 2). It worked! Sudden Dr. Parkinson was willing to listen and to try to understand the current version of the model. She pointed out areas needing modifications but commented approvingly on many parts of the current structure. The value for the number of A&E doctors (‘Senior House Officers’ or ‘Registrars’) on duty in A&E interested her particularly. She indicated that this varies over the day and that she was in the middle of re-
working the rostering schedule. She gave me a sheet of numbers showing the A&E doctors on duty at any given time. Perhaps unsurprisingly, there was no change in Dr. Parkinson’s stance that one cannot use averages when analysing health services. For example, she stressed that patient diagnose time in A&E varies with both patient and physician. She expressed doubt that an average could be useful. However, she was willing to arrange meetings with other staff to get more detailed information on their work. By 15:20 Dr. Parkinson claimed that her brain had had enough for one day so we moved to close. I thanked her profusely and she received with enthusiasm my one page summary of system dynamics flow symbols. “Talking about the model forces me to think through these issues as well, which is something I really ought to do”, she commented. She agreed to arrange for me to talk to St. Danes’ bed co-ordinator and staff in the test laboratories and we scheduled a time for the next meeting. Pointing to the agenda, Dr. Parkinson noted that we had covered points 1, 2 and 6 and done parts of 3-5. “Not bad for the first meeting” she observed, with evident satisfaction. 3.4 Observations after the first meeting After each meeting the authors discussed how things had gone. General remarks relating to the themes in Section 2.2 are considered in Section 6.2, but two observations are specific to this meeting. The prototype model was a crucial starting point for a discussion, since it acted as a ‘preliminary model’ (Vennix, 1996), or a ‘reality check model’ (Senge, 1990). Having some detailed ideas on paper was a vital trigger for further discussion. Without this tangible representation of ideas to discuss the meeting would have floundered on an adversarial, and purely theoretical exchange. Establishing a good relationship with the study ‘gatekeeper’ was important. A gatekeeper, “carries internal responsibility for the project ... The locus of the gatekeeper in the client organisation will significantly influence the process and the results.” (Richardson and Andersen, 1995, p. 115). Whilst Dr. Pettit appointed Dr. Parkinson to this role, it is clear that an effective first meeting was vital in persuading Dr. Parkinson to accept that role.
Total Waiting Time from Registration up to A&E Dr Consultation
Total Waiting Time from Registration up to Referral to a Specialty Dr
Patients Awaiting Consultation by an A&E Dr
Patients Awaiting Tests and Plan For Treatment
Initial Consultation Rate
Arrival Rate of Post Registrated Patients
Rate of Referrals
A&E Dr Utilisation
Implied A&E Dr Diagnosis Processing Time
Immediate Discharge Rate
~ Delay For Tests Normal A&E Dr Time per Patient
A&E Discharge Rate
Immediate Discharge Fraction
Proportion of Referred Patients
A&E Dr Capacity
~
Hour of Day
Max Feasible A&E Dr Consultation Rate
A&E Crowding
~ Effect of Congestion On A&E Dr Work
Total Number of Patients in A&E Major's
Max No. of Patients in Cubicles in A&E
Figure 2. Excerpt from the detailed diagram of the system dynamics model (as indicated, the model continues to the right of this segment). Such diagrams were used in all three main meetings of the study.
4. Phase II: Making progress This section describes how the modelling work was consolidated, primarily via a second meeting with Dr. Parkinson but also via some other meetings. We move again to CM’s contemporaneous description. 4.1 Second meeting with Dr. Parkinson, 30 January Dr. Parkinson collected me at 11:00 (as arranged in our call yesterday) but was tied up in A&E for a period. When we got started she made it clear that she had little time to see me. The re-worked rostering schedule was needed for 12 February, when new A&E doctors would arrive, so the next meeting would have to be after that date. Fortunately, although she had not arranged meetings, she had prepared a list of names and telephone extensions of other staff to contact. The aim that DCL and I had agreed was to work further on the detailed diagram of the model (see figure 2) to confirm its structure and to get parameters. I therefore brought the model up on the computer - moving to this format seemed fine now - and started by clarifying the rostering schedule for A&E doctors. I showed Dr. Parkinson that the model contained a graph drawn from the sheet of numbers that she gave me at the last meeting (figure 3). She liked what she saw, observing that she had been too busy to do the same herself. We moved on to patient arrivals. On the hospital computer system the total number of attendances were only recorded per month. However, to help her with her rostering duties Dr. Parkinson had wanted to compare roughly the A&E doctor schedule with the actual workload. She had therefore collected data of arrivals over a 3 month period, recorded in hourly slots, grouped by days of the week. She confirmed that the distribution was the same today, though with an overall increase of 7%. She also showed me a book, which is filled out by the triage nurse in the reception, recording the number of GP referrals per day. (From this data we subsequently derived distributions - in the first case an average, see figure 4 - that were included in the model.) Things were going well until we moved on to the Specialty doctors that are called in to A&E when required. “It’s not possible to try to generalise and look at averages when it comes to specialties”, was her response. To emphasise the point she rapidly reeled off a list of 15 different specialties that might be involved. I stressed that we knew we were simplifying matters but that by starting off considering the most normal cases we could nevertheless gain insight. I gently reminded Dr. Parkinson of her own comparison of workload and staff. On most days the arrival pattern was different from average but she had still got insight into the balance between the two by considering only the average situation. Her response quite startled me; “Yes, you’re right. You have to start somewhere”. She stopped criticising the aggregate formulation in the model and indicated that I might be able to get hold of some averaged information. The meeting ended at 11:50, with Dr. Parkinson photocopying her A&E arrivals data for me and my handing over copies of the detailed diagram for her to look at further. She agreed that I could use the telephone in the reception area to call the people she had referred me to. I moved on to talk to other people working in the system.
8
7
6
5
4
3
2
1
24.00
23.00
22.00
21.00
20.00
19.00
18.00
17.00
16.00
15.00
14.00
13.00
12.00
11.00
10.00
9.00
8.00
7.00
6.00
5.00
4.00
3.00
2.00
1.00
0.00
0
Time of Day
Figure 3. Rostering schedule for A&E doctors. This graph was derived from data provided by Dr. Parkinson at the first meeting and showed to her at the second meeting to indicate that the information had been included in the model.
4.2 Consulting other system actors The contacts provided by Dr. Parkinson were followed up, some on the same day, others on subsequent days. These meetings are described here, again from the perspective of CM. 4.2.1 Meetings the same day January 30th yielded four further contacts. The first was with Norma Newcombe in the haematology laboratory. It was interesting to see how other parts of the hospital works, how blood samples are tested and the interpretation of results returned to A&E. From her I obtained figures on the normal processing time and the processing capacity for this work. Unable to reach Polly Vaughan, my contact in radiography, my second meeting was with two doctors who I found when I visited the X-ray laboratory. They were very busy but I did get information regarding test procedures: the average processing times: and laboratory capacity. I will contact Polly Vaughan to confirm this information. I tried to call the bed co-ordinator, Mike Cook. He was busy but agreed to a meeting on 4 February. However, I did managed to confirm that St. Danes’ does not categorise beds as being geriatric or acute. This supports our aggregation of the bed capacity in the model. The fourth contact resulted from my visiting A&E to ask staff about their working procedures. A Dr. Blake, a Senior House Officer, had a little time to talk and we sat down in a cubicle (note: crowding is not a significant factor at 12:35 on a Thursday). Without showing him any diagrams, I was able to get confirmation of the different pathways that A&E patients can follow, e.g. immediately treated and discharged, referred on to Specialty doctors etc. He was also able to give rough figures for the proportions taking each pathway. This was my final contact of that day.
4.2.2 Two later meetings On February 3 I telephoned Radiography. Polly Vaughan was absent but I was able to talk instead to her colleague, Stephanie Harvey, who was very friendly and helpful. I outlined the purpose of our study and she quickly realised that I was interested in an overview of the test procedures. I got durations for: logging on to the system, preparing the patient, checking for pregnancy, performing the x-rays, checking quality and returning results to A&E. The total, along with the capacity of the Radiography laboratory, strengthens our view that we can consider all ‘cases awaiting tests’ as one stock. On 4 February I returned to St. Danes’ for two meetings. The first was with Mike Cook, the hospital bed co-ordinator and started around 14:45. Mr Cook spent the first 15 minutes of our meeting asserting the complexity of his job and, by implication, establishing his expertise. It seemed necessary - and, in fact, appropriate - for me to acknowledge these facts. This recognition from me, combined with a statement of what our model hoped to do, and what we were clear it would not do, seemed to establish that we were ‘on the same side’. Over the next half hour I gathered a lot of information about processes in St. Danes’. These included values for scheduled elective admissions per day and emergency admissions per day (this triangulated with Dr. Parkinson’s data). Mr. Cook thought it would be difficult to get many of the values that we sought. However, using the information he gave me during the meeting it was actually possible to calculate most of the values we needed to run the model. For example, average length of stay was calculated using the daily number of admissions and typical occupancy level of the hospital. Mr. Cook was ‘bleeped’ and had to leave. I told him that I wanted “to walk around” A&E again and he suggested I seek out Dr. Terry Eilbeck. This very valuable meeting ended at 15:30. The second meeting of 4 February was an informal chat in A&E with Dr. Eilbeck. This confirmed the information from Dr. Blake. Additionally, we subsequently saw how to model Specialty doctor capacity in A&E by aggregating the 15 branches of Specialty medicine. I left the hospital at 16:00. 4.3 Observations after Phase II Unsurprisingly, the second meeting with Dr. Parkinson and the various other consultations together illustrate most of the general themes considered in Section 2.2 and revisited in Section 6.2 (see table 1). However, three specific observations merit recording. It is noteworthy that Dr. Parkinson’s enthusiasm and trust were increased considerably by showing her the graph of A&E doctors based on the information she had provided. This seemed to signal to her that her input to the study was crucial for the development of a credible model and that her views were going to be taken into account. This also created a willingness to give more information. The importance of this point is further emphasised by the subsequent meetings, for which Dr. Parkinson’s role as a gatekeeper was crucial. She knew the system being modelled and the actors within it and had the power and overview to identify relevant people to consult. With the authority of Dr. Parkinson (and Dr. Pettit) backing the work, other hospital staff were both trusting and willing to share useful information. At the start of the meeting with the bed co-ordinator it seemed particularly important to admit - even overstate - a lack of expertise and acknowledge the intrusion into a system owned and understood by others. Signalling appropriate modesty was very important here in establishing a relationship and settling the roles in the collaboration.
Figure 4. Data collected by Dr. Parkinson showing A&E arrival rates over a 3 month period, recorded in hourly slots, grouped by days of the week. The average rate (thick line) was the basis of the data used in the model.
5. Phase III: Securing confidence
This section presents an account of the closing stages of the study: a range of consultations and a final meeting with Dr. Parkinson’s which demonstrably secured her confidence in the model. Contemporaneous description by CM is used for the last time to describe these activities. 5.1 Working at a distance Dr. Parkinson’s non-availability before 12 February was unfortunate; funding considerations meant that the St. Danes’ work had to be completed by the end of March. However, when I called her on 13 February Dr Parkinson dropped something of a bombshell; she had to prepare for a meeting on 27 February and would not be available before then. “I am sorry. I do realise the time pressure that you are under but I have got other more important things to do”, she remarked. She seemed reluctant to allow me to consult other staff during the delay. We compromised by agreeing to my talking to some of her colleagues but without showing them the computer model. We agreed to have a long meeting on 28 February to which I would aim to bring a completed, simulating model. Over the next week I spoke by telephone with an A&E doctor and three Specialty doctors. As a result, the main structure of A&E was checked and the aggregate representation of the Specialty doctors confirmed as appropriate. Parameter values such as average Specialty doctor diagnosis time and the proportion of patients requiring hospital admission were also obtained. By 19 February, the time pressure of the project was obvious. Before any policy experiments could be done we needed a model which had passed the basic validation tests and in which we and St. Danes’ had confidence (Forrester and Senge, 1980). Dr. Parkinson’s feedback was needed before the 28 February. Gingerly, I telephoned her to explain this. Her meeting preparations were going well and she agreed to our suggestion that we fax her some information for comment. The resulting fax contained model output for patients’ average waiting times for various activities in A&E (figure 5) and also a list of parameter values. This was the first time Dr. Parkinson saw modelgenerated system behaviour; our first attempt at a ‘behaviour reproduction test’ (Forrester and Senge, 1980; Richardson and Pugh, 1981). The format of the output was cause for concern: real world figures had to be extracted by hand using a ‘Y=X’ line (see figure 5). The fax tried to explain this but it seemed complex to us. (The authors later found an improved way of presenting this data (Lane and Rosenhead, 1998).) Dr. Parkinson’s answering fax arrived on 21 February. She confirmed that the waiting times looked reasonable and also accepted most of the parameter values. She made it clear that there would be no historical data to match model output with and closed with some minor corrections to our use of medical terminology. Buoyed up by this response we incorporated her minor changes and began to plan policy experiments in more detail.
Figure 5 (next page). Model output for patients’ average waiting times for various activities in A&E. This data is from the finalised model but a graph of the same format was faxed to Dr. Parkinson for comment. The graph shows the average time taken to complete each stage of the process, plotted against the hour of the day when that stage is completed. Real world figures may be extracted using a ‘Y=X’ line, as exemplified by patients arriving at 12:00.
5.2 Third meeting with Dr. Parkinson, 28 February With the expectation that this would be the last meeting with Dr. Parkinson, we had planned for it carefully. The broad intention was to gain her support for the model structure, parameter values and behaviour. With that in place, we would be able to move on to understanding what the model might tell us about the system. Dr. Parkinson was as good as her word regarding the time she said she would give to the study after her presentation on 27 February; starting at noon she spent nearly three hours with CM, whose account now takes over the narrative. With coffee in hand we sat in Dr. Parkinson’s office, near to her colleague, Dr. Terrence Edwards. Using the portable computer, Dr. Parkinson and I started to discuss the model, looking at its detailed stock/flow diagram. Dr. Edwards asked: “What is that?” and Dr. Parkinson proudly answered, “it is a computer model of an A&E department. We are trying to look at different activities affecting waiting times, in order to improve efficiency”. She definitely has a feeling of ‘model ownership’! We started off confirming the representation of the arrival process of patients to A&E, showing how the plot of her data had been included in the model. Dr. Edwards joined in the discussion about arrival rates, admiring the graph of patient arrivals (figure 4). “I didn’t realise the peak was there”, he observed, indicating the late morning. After some thought he added, “of course, it varies a lot”. Dr. Parkinson replied, “We have to average out a bit here”. I still don’t quite believe this happened - what a change in attitude from our first meeting. We then moved on to look at the behaviour that the model generated, using the average waiting times. Dr. Parkinson decided that one of the two components was too low. Since she had approved the same graph when it had been faxed only a few days previously this was a surprise. However, I probed her concern further and we had a lengthy discussion about ‘turnover interval’, the amount of time between one patient leaving a bed and another being able to use it. Having clarified her ideas on this, some hands-on modelling included her assumptions in the model. Dr. Parkinson confirmed that the new output reproduced, in both phase and magnitude, what she witnesses every day. So, behaviour reproductions from a model that is definitely not a black box to its client! Sometime, while we were making changes to the model and simulating the response to analyse the effect of system performance, Dr. Parkinson said: “I’m fascinated by this computer model. And you actually built this?” Dr. Parkinson particularly liked the way that the iThink software allowed us to look at a high level map of the model (figure 1) whilst the equations were hidden underneath, readily available but only when needed (Peterson, 1994). There had been an unusual surge of A&E attendees only the previous day, producing long queues and keeping everyone very busy. Dr. Parkinson wondered whether we could simulate this and so we ran the model with an appropriate increase in arrivals. The waiting times increased, as did the backlog of patients and the utilisation of the A&E doctors. Because it had reproduced this observed anomalous behaviour (Forrester and Senge, 1980) this test visibly increased the credibility that the model had in Dr. Parkinson’s eyes. Additionally, she used this simulation to explore further both the structure and the various output screens of the model Having completed the model validation we made a plan for further work. Dr. Parkinson expressed a wish to meet me at LSE one day after Easter to sit down and play with the model. She had seen enough now to “get saliva on my tongue”. As we wrapped up, I said we had got more out of the meeting than I expected. Dr. Parkinson replied: “That’s why I suggested to have the meeting today. I knew I would have time to sit down and discuss things over with you without being interrupted. I’ve been a bit vague at these meetings. I think we have got quite far, considering this is only our third meeting. And you have obviously done lot of research and talked to different staff. I mean, look at this diagram, we have done a lot of changes from when we first started, haven’t we?”.
Her change in attitude towards the model was very pleasing. She continued, “We now have data for all these different parameters. Just think, when I first saw this diagram, I was going: you can’t average that, and: there is no way you will get such data and information.” She ended by saying: “I think it is a very credible model. You know, seeing the results when we increased arrival rate - ahh! The model and its results make sense!” I departed having great confidence in our model. I am looking forward to experimenting with it over the weekend and to working on its policy implications. 5.3 Observations after the third meeting This last phase of the study gives rise to three specific observations The first concerns Dr. Parkinson’s reluctance to allow the model to be worked on by others whilst she was too busy (telephone call, 13 February). It was never clear whether this was because, at that point, she had little confidence in the model and wanted to limit the parading of an embarrassment, or whether she had concluded that it had value and so wanted to reserve it to herself. Confronted with a similar client reluctance modellers should perhaps not despair; the latter explanation could hold and should still be worked towards. The second point is that it was worth taking the risk to contact Dr. Parkinson on 19 February. Whilst we had not lost focus by spreading model ownership amongst too many people, there was a risk that the authors’ modelling work could have parted company from the interests of the main contact. The exchange of faxes reconnected modellers with client. Finally, the checking of model output with historical experience - conducted by fax and during the last meeting - offers a lesson for model validation. We had requested any historical data series held on hospital databases but Dr. Parkinson’s faxed reply included, “I have no idea where you would get 10 years data. Certainly A&E has only been computerized since about 1992”. In system dynamics we should always aim to conduct statistical tests of behaviour reproduction (Sterman, 1984; 1997) but the absence of quantitative data should not prevent a more judgmental assessment being made. Such an assessment can add to the credibility of a model. 6. Closing Comments 6.1 Subsequent work with the model Beyond the crucial period described above, further work was done on the model after Easter 1997. This primarily dealt with the structures representing bed co-ordination and scheduled and cancelled elective admissions. Additionally, after the formal end of the project DCL visited St. Danes’ to see Mike Cook (28 and 31 October) and Dr. Parkinson (4 and 11 November) to confirm further details. The result of this work was a model calibrated for St. Danes’ with which policy experiments could be conducted with confidence. Three policy lessons, of potentially wider applicability, were obtained. Firstly, the present system harbours few efficiencies to be squeezed out. Small demand increases can only be recovered from at some cost to staff and patients alike in the case of single crisis days, and would overwhelm the system if permanent. Secondly, some small scope for improvement exists. The careful re-allocation of staff to different processes in A&E may be able to ‘de-bottleneck’ the system. However, scope for improvement is very limited without additional staffing provision. Finally, reduction in bed capacity does not increase A&E waiting times but it threatens to increase the cancellation of elective treatments. This illustrates that the use of a single performance indicator in a complex system simply transfers the problem elsewhere (Smith, 1995). While A&E waiting times may be excellent measures of the effectiveness of acute treatments, using them alone to judge the effect of bed reductions is systematically naive.
A report on this work was provided to St. Danes’ and full details may be found in Lane et. al. (2000). This work came to the notice of the U.K. Department of Health. As a result a related study was commissioned (Lane, 1999) and follow-up work is at the planning stage. 6.2 Hints and insights on collaborative health care model building In this sub-section the themes presented earlier are re-visited. Drawing on the entirety of the modelling work described in the paper, some hints and ideas for future collaborative health care modelling exercises are tentatively proposed. 6.2.1 Communicating the purpose and benefits of modelling The purpose and benefits of modelling work may be conveyed in two ways: by persuasion and by authority. With some the latter may be sufficient; the various subsidiary meetings undertaken in Phase II were legitimised by the authority that Drs. Pettit and Parkinson had by then given to the study. But before this comes persuasion. As illustrated by the meeting on 20 January, because health care professionals are busy people, understandably resistant to additional calls on their time, it is worth having ready a crisp statement of the purpose and benefits of a study, even it is can only be somewhat theoretical in style. However, as illustrated at the close of that meeting, and by Dr. Parkinson’s subsequent comments, it is quite possible to help clients to see the value of modelling, particularly when the benefits shift from being theoretical (“forces me to think through the issues”) to being self-evidently practical (“to improve efficiency”). When clients assert such purposes and benefits themselves - as Dr. Parkinson did with Dr. Edwards - communication has been achieved. 6.2.2 Dealing with aggregation The aggregated view of systems central to system dynamics does not come easy to most people. This may be particularly true for health care workers because of their focus on individual patients; “useless simplification”, observed Dr. Parkinson at the first meeting. Thinking in averages does not seem natural and even when the information is to hand - as in the meeting with Mr. Cook - it may take a modeller’s skill to see it for what it is. However, is illustrated in the final meeting, it is possible for clients to become comfortable with an aggregated view and accept it as a sensible way of beginning to think about a situation. An alternative perspective on this issue is perhaps indicated by the response to figures 1 and 2. The first was rejected whilst the second conveyed the modeller’s in more detail. Perhaps health care workers particularly value the ability to move between different levels of aggregation. Dr. Parkinson’s remarks in the last meeting hint at this. 6.2.3 Probing the ‘mental database’ The value of consulting those working in a system is plainly shown in this case study. Most activities yielded information that would have been unavailable via any other means than talking to the people doing the job. Whilst the lack of objective, quantitative data may be a source of some regret, it does not and should not stop modelling - supported by the careful collection and triangulation of judgmental estimates - from taking place. 6.2.4 Dealing with busy health care professionals Health care workers are busy, sometimes literally for life and death reasons (in a follow-on study (Lane, 1999) a nurse arrived very late to a meeting with DCL and explained that she had been attempting - unsuccessfully - to save the life of a car crash victim). Modellers need to be particularly patient, flexible and persevering when seeking time with collaborators. Health care workers are also professionals. They are due respect and may demand acknowledge of their expertise. In most cases it will probably be appropriate to offer such acknowledgement. It is appropriate to reject the ‘expert consulting’ relationship (Lane, 1992)
since modellers will very seldom understand the system being modelled as well as those in it. However, to practise the contrasting ‘facilitation consulting’ requires a mutual understanding of what each participant brings to the study. Due modesty on the part of the modeller should not topple into worshipful submission but should be combined with confidence in what modelling has to offer. 6.2.5 Creating ownership and confidence A system dynamics truism is that representing collaborators’ ideas in the model ensures ownership and confidence. This study reinforces the idea that more is needed. Dr. Parkinson’s response to being shown that her data for the A&E doctors roster had been included illustrates the maxim, “Clients’ ideas must not just be in a model, they must be seen to be in a model” (Lane, 1992, p.68). In simulation this is ‘face validity’ (Pidd, 1992) but in system dynamics a distinction is made between the ownership and confidence derived from looking at model structure and that produced by examining resulting behaviour (Forrester and Senge, 1980; Richardson and Pugh, 1981). Both must be sought since they are ineluctably linked and together can produce the desired effect. In this case, the fact that a structure examined throughout the study produced, in the last meeting, convincing behaviours in the normal and in an anomalous case lead to the extraordinarily supportive comments made by Dr. Parkinson. Her combination of understanding and vocal advocacy for the model are what most system dynamicist aim for. This study indicates that it can be achieved. 6.2.6 ‘Walking the system’ It is not always possible or pleasant to visit the system being modelled. A system dynamicist confronted by a patient trickling blood onto the floor (this has happened to both authors) can feel impotent. However, at the risk of getting in the way, such close up examination is highly recommended. This is an effective data collection method allowing basic information to be collected quickly, along with details which might be difficult to elicit (Graham, 1980). Beyond this functional point, the authors would recommend such visits simply for motivation: in the midst of a technical problem it can be greatly encouraging to be reminded of quite what ‘system improvements’ might mean to the individual human beings inhabiting that system. 6.3 Conclusion Collaborative health care modelling presents many challenges but the standard system dynamics methods for involving clients stand up well to this unusual application domain. More structured research is needed but the hints and insights here should give encouragement to future modellers. System dynamics has much to offer health care policy and the process of building such models can be rewarding for all concerned.
Acknowledgements The authors would like to thank: those who contributed to this work at LSE - Prof. Jonathan Rosenhead and Rachel O’Carroll; staff at Casualty Watch; all of the staff at ‘St. Danes’, particularly ‘Dr. Pettit’ and ‘Dr. Parkinson’, for their time and support. References Andersen, D. F. and G. P. Richardson. 1997. Scripts for Group Model Building. System Dynamics Review 13(2), 107-129. Andersen, D. F., G. P. Richardson and J. A. M. Vennix. 1997. Group Model Building: Adding more science to the craft. System Dynamics Review 13(2), 187-201. Argyris, C. 1990. Overcoming Organizational Defenses: Facilitating organizational learning. Boston, MA: Allyn and Bacon. Audit Commission. 1996. By Accident or Design: Improving A&E Services in England and Wales. London: HMSO. Checkland, P. B. 1985. Achieving 'desirable and feasible' change: an application of soft systems methodology. Journal of the Operational Research Society 36(9), 821-831. Davies, R. and T. davies. 1986. Using Simulation to Plan Health Service Resources: A discussion paper. Journal of the Royal Society of Medicine 79(?), 154-157. Department of Health. 1996. The Patient's Charter. London: HMSO. Eden, C., D. Sims and S. Jones. 1979. Policy analysis and organisational politics. European Journal of Operational Research 3,207-215. El-Darzi, E., C. Vasilakis, T. Chaussalet and P. H. Millard. 1998. A Simulation Modelling Approach to Evaluating Length of Stay, Occupancy, Emptiness and Bed Blocking in Hospitals. Health Care Management Science 1(2), 143-149. Forrester, J. W. 1961. Industrial Dynamics. Cambridge, MA: MIT Press. Forrester, J. W. 1968. Principles of Systems. Cambridge, MA: MIT Press. Forrester, J. W. 1987. Fourteen 'Obvious Truths'. System Dynamics Review 3(2), 156-159. Forrester, J. W. 1992. Policies, decisions and information sources for modelling. European Journal of Operational Research 59(1), 42-63. Forrester, J. W. and P. M. Senge. 1980. Tests for building confidence in system dynamics models. In System Dynamics: TIMS Studies in the Management Sciences eds. A. A. Lagasto, J. W. Forrester and J. M. Lyneis, pp. 209-228. Oxford: North-Holland. Gass, S. I. 1983. Decision-aiding models: validation, assessment, and related issues for policy analysis. Operations Research 31,603-631. Geus, A. d. 1988. Planning as Learning. Harvard Business Review 66(2), 70-74. Graham, A. K. 1980. Parameter Estimation in System Dynamics Modelling. In Elements of the System Dynamics Method ed. J. Randers, pp. 143-160. Cambridge, MA: MIT Press. Horn, R. L. v. 1971. Validation of simulation results. Management Science 17(5), 247-258. Lane, D. C. 1992. Modelling As Learning: A consultancy methodology for enhancing learning in management teams. European Journal of Operational Research 59(1), 64-84. Lane, D. C. 1993. The road not taken: observing a process of issue selection and model conceptualization. System Dynamics Review 9(3), 239-264. Lane, D. C. 1997. Diary of an Oil Market Model: How a system dynamics modelling process was used with managers to resolve conflict and to generate insight. In Systems Modelling for Energy Policy eds. D. W. Bunn and E. R. Larsen, pp. 205-240. Chichester: Wiley. Lane, D. C. 1999. System Dynamics Modelling of Patient Flows Through Acute Hospitals. London: Report for the NHS Executive. Lane, D. C., C. Monefeldt and J. V. Rosenhead. 2000. Looking in the Wrong Place for Healthcare Improvements: A system dynamics study of an accident and emergency department. Journal of the Operational Research Society 51(5), to appear. Lane, D. C. and J. V. Rosenhead. 1998. Emergency - But No Accident - A system dynamics study of casualty waiting times in the British NHS. euroHealth 4(1), 34-36. Millard, P. H. and S. I. McClean (eds.) . 1996. Go With The Flow: A systems approach to healthcare planning. London, Royal Society of Medicine Press. Morecroft, J. D. W. 1992. Executive knowledge, models and learning. European Journal of Operational Research 59,9-27. Morison, M. 1986. Methods in Sociology. London: Longman.
Naylor, T. H. and J. M. Finger. 1967. Verification of computer simulation models. Management Science 14(2), B92-101. NHS Confederation Royal College of Physicians. 1997. Tackling NHS Emergency Admissions: Policy into practice. Birmingham: NHS Confederation. Ozcan, Y.A. and P. Smith. 1998. Towards a Science of the Management of Health Care. Health Care Management Science 1(1), 1-4. Peterson, S. 1994. Software for model building and simulation: an illustration of design philosophy. In Modeling for learning organizations eds. J. D. W. Morecroft and J. D. Sterman, pp. 291-300. Portland, OR: Productivity Press. Pidd, M. 1992. Computer Simulation in Management Science (3rd ed.). Chichester: Wiley. Richardson, G. P. 1991. Feedback Thought in Social Science and Systems Theory. Philadelphia: Univ. Pennsylvania. Richardson, G. P. and D. F. Andersen. 1995. Teamwork in group model building. System Dynamics Review 11(2), 113-137. Richardson, G. P. and A. L. Pugh. 1981. Introduction to System Dynamics Modelling with DYNAMO (republished edition). Cambridge, MA: Productivity. Richmond, B. M., P. Vescuso and S. Peterson. 1990. iThink™ Software Manuals. Hanover, NH: High Performance Systems, 145 Lyme Road, Hanover, NH 03755, USA. Roberts, E. D. 1972. Strategies for effective implementation of complex corporate models (1978 collection). In Managerial Applications of System Dynamics ed. E. B. Roberts, pp. 77-85. Cambridge, MA: Productivity Press. Rouwette, E. A. J. A., J. A. M. Vennix and T. v. Mullekom. 1999. Group Model Building: A review of assessment studies. In Proceedings of the 1999 International System Dynamics Conference (Wellington, NZ) eds. R. Y. Cavana, J. A. M. Vennix, Etienne A.J.A. Rouwette, M. Stevenson-Wright and J. Candlish, pp. (CD based). Albany, NY: System Dynamics Society. Roy, B. 1993. Decision science or decision-aid science? European Journal of Operational Research 66(2), 184-203. Sargent, R. G. 1982. Verfication and validation of simulation models. In Progress in Modelling and Simulation ed. F. E. Cellier, pp. 159-169. London: Academic Press. Senge, P. M. 1990. Catalyzing systems thinking within organizations. In Advances in Organization Development ed. F. Massarik, pp. 197-246. Norwood, NJ: Ablex. Smith, P. 1995. Large Scale Models and Large Scale Thinking: The case of the health services. Omega 23(2), 145-157. Sterman, J. D. 1984. Appropriate summary statistics for evaluating the historical fit of system dynamics models. Dynamica 10(2), 51-66. Sterman, J. D., N. Repenning and F. Kofman. 1997. Unanticipated side effects of successful quality improvement programs: exploring a paradox of organizational improvement. Management Science 43(4), 503-521. Tilanus, C. B. 1985. Failures and successes of quantitative methods in management. European Journal of Operational Research 19,170-175. Vennix, J. A. M. 1995. Building consensus in strategic decision making: System dynamics as a Group Support System. Group Decision and Negotiation 4,335-355. Vennix, J. A. M. 1996. Group Model-building: Facilitating team learning using system dynamics. Chichester: Wiley. Watt, K. E. F. 1977. Why won't anyone believe us? Simulation 28(1), 1-3.