CloudScope: Diagnosing and Managing Performance Interference in Multi-Tenant Clouds Xi Chen, Lukas Rupprecht, Rasha Osman, Peter Pietzuch, William Knottenbelt
Felipe Franciosi
Imperial College London {xc311, lr12, r.osman, prp, wjk}@imperial.ac.uk
Citrix
[email protected]
Abstract—Virtual machine consolidation is attractive in cloud computing platforms for several reasons including reduced infrastructure costs, lower energy consumption and ease of management. However, the interference between co-resident workloads caused by virtualization can violate the service level objectives (SLOs) that the cloud platform guarantees. Existing solutions to minimize interference between virtual machines (VMs) are mostly based on comprehensive micro-benchmarks or online training which makes them computationally intensive. In this paper, we present CloudScope, a system for diagnosing interference for multi-tenant cloud systems in a lightweight way. CloudScope employs a discrete-time Markov Chain model for the online prediction of performance interference of co-resident VMs. It uses the results to optimally (re)assign VMs to physical machines and to optimize the hypervisor configuration, e.g. the CPU share it can use, for different workloads. We have implemented CloudScope on top of the Xen hypervisor and conducted experiments using a set of CPU, disk, and network intensive workloads and a real system (MapReduce). Our results show that CloudScope interference prediction achieves an average error of 9%. The interference-aware scheduler improves VM performance by up to 10% compared to the default scheduler. In addition, the hypervisor reconfiguration can improve network throughput by up to 30%.
I.
I NTRODUCTION
The demand for cloud computing has been constantly increasing during recent years. Millions of servers are hosted and utilized in data centers every day and many organizations deploy their own, private cloud services to be able to better manage their own computing infrastructure [1]. By 2013, more than 75% of enterprise workloads were running on virtualized environments [2]. Virtualization enables cloud providers to efficiently allocate resources to tenants on demand and consolidate tenants’ workloads to reduce operational cost. Successful management of a cloud platform requires the optimal assignment of incoming virtual machines (VMs) or guests to available physical machines (PMs) or hosts. This scheduling problem is constrained by both the tenants’ Service Level Objectives (SLOs) and the available resources. Coresident VMs are desirable for the cloud provider as this means utilizing available resources more efficiently. However, the more VMs are consolidated on a single machine, the more instances compete for resources and the hypervisor capacity. As a result of this interference, guest systems may experience high performance variations which lead to unpredictable system behavior and SLO violations [3], [4] such as a drop in application throughput or an increase in the response time of a web service.
Recognizing this problem, researchers have developed many methods to identify and predict performance interference. This work can be categorized into two groups: (1) machine learning-based approaches [1], [4], [5], [6], [7], [8], [9], [10] and (2) queuing model-based approaches [11], [12], [13]. The first group uses sophisticated micro-benchmarks and online training to predict the performance interference of different applications. As prediction is based on historical data, adaptation to unknown workloads becomes difficult. Also, continuously updating the models is computationally expensive. The second group relies on unified queuing models and system attributes such as service and arrival rates which are usually difficult to obtain due to system complexity and varying workloads. In addition, these methods support only specific hardware configurations and existing applications. They do not provide a method which is general and efficient enough for complex cloud environments where applications change frequently. In this paper, we consider this co-residency problem and present CloudScope, a system that diagnoses the bottlenecks of co-resident VMs and mitigates their interference based on a lightweight prediction model. The model is a discretetime Markov Chain that predicts performance slowdown when compared to an environment without hypervisor overhead and resource contention, represented by a virtualization-slowdown (V-slowdown) factor. The key feature of CloudScope is its ability to efficiently characterize the performance degradation by probing the system behavior which includes both the behavior of the hypervisor layer and the hardware characteristics of different workloads. Current systems [1], [4], [6], [7], [9] do not explicitly consider these factors in an analytical model. CloudScope’s model parameters can be easily obtained via hypervisor profiling utilities such as xentop. As these values are by default reported from the hypervisor, no overhead is introduced. CloudScope employs its model to control guest instance placement and reduce SLO violations by minimizing interference effects. It also manipulates the hypervisor to achieve an optimal configuration by, for example, increasing the CPU share available to the hypervisor. Because of the practicality of this analytical model, adaptive hypervisor control and migration or consolidation of VMs becomes a lightweight and fast operation that does not require complex training or micro-benchmarking. We implement CloudScope and evaluate its accuracy and effectiveness using a wide spectrum of workload scenarios including a set of CPU, disk, and network intensive benchmarks and a real workload using Hadoop MapReduce [14].
CloudScope’s interference prediction model can achieve a minimum prediction error of 4.8% and is less than 20% for all our test workloads. We illustrate the feasibility of CloudScope’s interference-aware VM scheduler by comparing it to the default scheduler of a CloudStack [15] deployment and achieve an overall performance improvement of up to 10%. In addition we show how CloudScope can be applied to self-adaptive hypervisor control to answer questions such as: which configurations can best serve the guests performance requirements? We make the following contributions: •
•
•
We introduce a lightweight analytical model solely based on available system parameters to predict the impact of co-residing VMs on performance. We combine both the behavior of the hypervisor and the specific hardware requirements of different workloads in our model for fast and accurate predictions. We implement an interference-aware scheduler for a CloudStack deployment and illustrate the effect of a self-adaptive Xen control domain.
The rest of the paper is organized as follows. Section II demonstrates the performance degradation caused by hypervisor overhead and resource contention using benchmarking experiments. We present CloudScope’s system design and its performance model in Section III and discuss details on interference handling in Section IV. The validation and experimental results are presented in Section V. Section VI compares our work with existing approaches and Section VII concludes the paper. II.
P ERFORMANCE I NTERFERENCE IN PARAVIRTUALIZATION
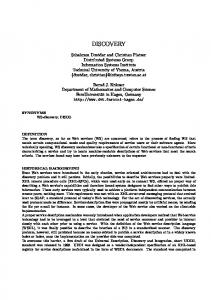
Performance interference in multi-tenant data centers is well studied both in the context of prediction and measurement. Many benchmarking studies are devoted to understanding the performance of EC2 VM instances [1], [16], their network [3], [6], [17] and applications deployed in them [18], [19]. These studies found that virtualization and multi-tenancy are the major causes for resource contention as multiple VMs are placed on a single host. This leads to performance variation in EC2 instances. In this section, we show that these performance bottlenecks depend on different workload parameters and quantify the impact on the underlying system. A. Virtualization Background The Xen hypervisor is widely used as the basis of many commercial and open source applications. It is also used in the largest clouds in production such as Amazon and Rackspace. We picked Xen as the basis for our model in this work as it is the only open source bare-metal hypervisor. Xen provides a spectrum of virtualization modes, where paravirtualization (PV) and full virtualization are the poles. The main difference between PV and full virtualization is that the PV guest kernel (the user domain or DomU) will issue hypercalls, which are direct calls to the hypervisor’s control domain (Dom0), instead of privileged system instructions. This relationship is detailed in Figure 1. For example, instead of issuing a system call to allocate memory address space for a process, the PV guest will make a hypercall to Xen, requesting the address space. PV
Client
A
Control Domain (Dom0) blkback
Shared Memory
Client
Client ... (VM)
Guest Domain (VM) blkfront
B Virtual Switch
Client ...
C netfront
netback
...
Disk Driver
N/W Driver
Event Channel Hypervisor(VMM) Disk
NIC
Hardware
Packets
Figure 1.
Xen hypervisor architecture with guest VMs Table I.
PM VM-CPU VM-disk VM-net
B ENCHMARKING C ONFIGURATION
Two Intel 8-core 2.9 GHz (32 hyper-threading), 256 GB Memory 4 vCPUs (1 GHz per vCPU), 2 GB Memory, 5 GB local storage 4 vCPUs (1 GHz per vCPU), 8 GB Memory, 32 GB local storage 4 vCPUs (1 GHz per vCPU), 8 GB Memory, 1 vNic
is very efficient and lightweight and hence it is more widely adopted as a virtualization solution [3], [5] which is why in this work we focus on modeling Xen’s PV mode. Although PV has significant performance benefits as demonstrated in the original Xen paper [20], the existence of an additional layer between the VM applications and the hardware introduces overhead. The overhead depends on the type of workload that is executed by the guest [21]. In general, CPU-intensive guest code runs close to 100% native speed, while I/O might take considerably longer due to the virtualization layer [21]. However, CPU oversubscription is common in cloud environments which also limits the performance of CPU-intensive jobs [22] . CPU performance is affected by the time slices allocated to the VMs which are based on a weight (the CPU share for each VM and the hypervisor), a cap (the maximum usage), and the amount of pending tasks for the physical processors [23], [24], [25]. Disk and network I/O suffer from overhead caused by moving data between the VM, shared memory, and the physical devices [17], [25]. As shown in Figure 1, Xen uses two daemon processes, blkfront and blkback, to pass I/O requests between DomU and Dom0 via a shared memory page. Similarly, netfront and netback share two pages, one for passing packets coming from the network and the other for packets coming from DomU. Xen also places upper limits on the number of requests that can be placed in this shared memory which may result in delays due to blocking. This means that not only the latency increases but also that the bandwidth is reduced. B. Measuring the Effect of Performance Interference To illustrate the problems resulting from the above described virtualization techniques, we measure the performance of CPU, disk, and network intensive applications sharing resources on one physical server. Table I gives the configurations for the PM and the VMs for each experiment.
1 0.5 0 0 5 10 15 20 25 30 35 40 45 Number of VMs
(a) CPU intensive workload
Dom0 1 DomU 2 DomUs 5 DomUs 10 DomUs 1
4
16
64 256 1k
4k
Block Size (KB)
(b) Disk intensive workload
1 0.9 0.8 0.7 0.6 0.5 0.4 0.3 0.2 0.1 0
Nor. Thro Dom0 Ave. Util
800 700 600 500 400 300 200 100 0
Ave. CPU Util of Dom0 (%)
1.5
110 100 90 80 70 60 50 40 30 20 10 0
Nor. Throughput Per VM
2
prime = 5000 prime = 3000 prime = 2000
Total Disk Throughput (MB/s)
Average Execution Time (ms)
2.5
1 2 3 4 5 6 7 8 9 10 Number of VMs
(c) Network intensive workload
Figure 2. Co-resident VM performance measurements for (a) CPU, (b) disk and (c) network intensive workloads for revealing different system bottlenecks. Figure (a) shows the average execution time of executing prime 2000, 3000, and 5000. Figure (b) shows the total sequential read disk I/O throughput of Dom0 and 1, 2, 5, and 10 guest VMs with different block sizes. Figure (c) shows the normalized network throughput of one VM co-resident with another 1 to 9 VMs and the corresponding utilization of Dom0.
To generate a CPU intensive workload we use the sysbench [26] benchmark with 4 threads to generate CPU load for a single VM. We measure the mean utilization of the VM for different prime number calculations. For prime numbers up to 2000, 3000, and 5000 we see utilization of 20%, 50%, and 90% respectively. Figure 2(a) shows the mean completion time for the jobs while increasing the number of co-resident VMs from 1 to 45. We observe that the time for calculating prime numbers up to 2000 is stable until 35 VMs and then slightly increases. For prime numbers up to 3000 and 5000, we already observe an increase in completion time for 5 co-resident VMs with a steeper increase from 25 VMs on. This behavior reflects the effects of (1) the high VM CPU load, (2) the Xen scheduling overhead and (3) CPU resource contention. Resource contention depends on the individual loads within each VM and the number of VMs running such loads. For example, when each VM runs prime 3000 it will produce an average utilization of 50% individually on each vCPU; thus we expect the physical machine to be saturated with 46 simultaneously running VMs: VMs 50 =
32 × 2.9 GHz ≈ 46 4 × 1 GHz × 50%
Hence, the results for prime 3000 in Figure 2(a) show the Xen scheduling overhead without CPU contention which can go as high as 1.7x for 45 VMs. We also observe that for prime 5000, the mean execution time is affected earlier as each VM produces 90% utilization. After 25 VMs, the increase in execution time then comes from both Xen scheduling overhead and resource contention. For the disk intensive workload, we run the fio [27] benchmark on Dom0 and individual VMs. We perform sequential reads and vary the block size from 1 KB to 4 MB. Figure 2(b) details the total disk throughput of Dom0 and 1 to 10 DomUs processing requests to read a 5 GB file simultaneously. We can split the results into three phases: (1) For small block sizes (1 KB to 16 KB), we observe a high load (80 to 90%) on Dom0 as it has to process a large number of requests in parallel. In this phase, the total
disk throughput is bounded by Dom0’s capacity. (2) After that (32 KB to 128 KB) the system is bound by the disk throughput. (3) Once the block size goes beyond 128 KB, the throughput drops for 2, 5, and 10 DomUs while the average utilization of Dom0 stays at 30 to 40%. The grant memory contention explains the drop in throughput for the VMs from a block size of 256 KB. The size of a Xen grant table entry is 4 KB [23] and the maximum number of entries is limited to 1281 [25], [24]. As a result, we have: 256 KB/4 KB = 64 table entries and 64 × 2 = 128. When the block sizes of more than two VMs are larger than 256 KB, the grant table will be locked when there are too many concurrent disk requests which causes delays and decreases the total disk throughput significantly. To produce a network intensive workload, we start 10 VMs with iperf [28] servers on the same physical machine. We then launch another 10 VMs as clients on other hosts in our local private cloud. All the VMs are connected via 10 Gbps links. Figure 2(c) shows the average normalized network throughput and the corresponding average utilization of Dom0. Throughput is normalized against the performance of when there is only one VM processing network requests. The throughput of the VMs decreases and the mean CPU utilization of Dom0 increases with a larger number of coresident VMs. The reason for the drop is a combination of the memory page locking for network requests (see Section II-A) and the scheduling and processing overhead of Dom0. III.
C LOUD S COPE S YSTEM D ESIGN
Our benchmarking results demonstrate that VM interference can have a significant impact on performance. We now describe CloudScope, a system that predicts the effects of interference and reacts accordingly to prevent performance degradation. CloudScope runs within each host in the cloud system and is complementary to current resource management components (e.g. VMware Distributed Resource Sched1 This is set in the Xen kernel via: MAX_MAPTRACK_TO_GRANTS_RATIO and gnttab_max_nr_frames
1 − pcpu
1 − pDom0
Application SLOs targets Host Resource + performance monitoring VM + application
Dom0
start
Interference Handling Manager VM/Dom0 controller
Dom0
pcpu pCPU
end
Interference prediction
(a) CPU workload Interference conflict handling
1−
p0cpu
Xen hypervisor
start Figure 3.
pDom0
Application analysis
1 − pDom0 p0cpu
pCPU
Dom0
1 − pdisk
pDom0
Disk
pdisk
end
CloudScope system architecture (b) Disk workload
uler [29] or CloudStack resource manager [15]) that handle SLO violations, dynamic VM scaling and elastic server consolidation [30], [31]. CloudScope incorporates the VM application SLO monitor and evaluator developed in our previous work [19], [32]. Figure 3 illustrates the overall system architecture which consists of three main parts: Monitoring Component. The Monitoring Component collects application and VM metrics at runtime. A daemon script reads the resource usage for Dom0 and every VM within Dom0 via xentop. The resource metrics include CPU utilization, memory consumption, disk I/O request statistics, network I/O, number of virtual CPUs (vCPUs), and number of virtual NICs (vNICs). External monitoring tools [19] are used to keep track of application SLOs in terms of application metrics such as response time, disk/network throughput, or job completion time. The resource and SLO profiling metrics are fed to the Interference Handling Manager. Interference Handling Manager. The Interference Handling Manager is composed of three main modules. The application analysis module analyses the monitoring data from each VM and obtains the application metrics. The result is an initial application loading vector for each application VM. The interference prediction module incorporates an analytical model based on the V-slowdown factor (see Section III-B) that infers the expected application performance degradation from the profile of currently running guest domains and Dom0. The interference conflict handling module provides migration-based interference-aware scheduling and adaptive Dom0 reconfiguration. Dom0 Controller. The Dom0 controller calls the corresponding APIs to trigger VM migration or Dom0 reconfiguration based on the prediction results and the SLO targets. In the rest of this section, we will provide details about our interference prediction model. A. Predicting Performance Interference Section II showed that the performance of co-resident CPU, disk, and network intensive applications may decrease due to the paravirtualization protocol, the load of Dom0, and the number of VMs competing for resources. We can view an application as a sequence of micro job slices accessing different system resources. Each application can be characterized with a certain resource statistic using a loading vector [9], [33] that represents the proportion of the time that an application
1 − p00cpu
start
1 − pDom0 p00cpu
pCPU
Dom0
1 − pnet
pDom0
Net
pnet
end
(c) Network workload Figure 4. State transition diagrams for (a) CPU, (b) disk, and (c) network intensive workloads
spends on each resource. We define the V-slowdown δj of a VM j, as the percentage of degradation in performance due to co-residency compared to no co-residency. We obtain the Vslowdown of an application VM by combining the slowdowns of each resource. Consider multiple applications running in VMs 1, . . . , n with CPU utilizations util1 , . . ., utiln on a single PM. A job is considered a sequence of job slices scheduled by the hypervisor to access the physical CPU, memory, disk and network resources. We represent the processing steps of a VM request within a PM as a discrete-time Markov Chain in which the states represent the hypervisor layer and physical resources: Dom0, pCPU, Disk, and Net as illustrated in Figure 4. In this model, we do not deal with memory as a resource as it is by default isolated and efficiently managed in Xen. Phenomenons such as memory ballooning or cache effects [35] are out of scope for this work. Each Markov Chain in Figure 4 represents the processing steps of a specific workload. Note that one job slice can only be processed in one of the four states at any one time. A job moves from state to state based on a probability that depends on the current workloads within the system. In the following we calculate these probabilities. 1) CPU workloads: When a CPU job arrives (see Figure 4(a)), the CPU scheduler has to schedule the vCPU to a runnable queue of a pCPU (physical CPU). pDom0 denotes the probability that in the next interval the job will be forwarded to a pCPU. Assume that the vCPUs of Dom0 are modeled by n M/G/1-PS queues, in which n represents the number of vCPUs and the PS (processor sharing) policy reflects the scheduling policy. In an M/G/1-PS queue, the average time spent in the
system by customers that have service time x is denoted by x T (x) = C(1 − ρ)
p0cpu
(1)
where pcpu represents the probability that a job completes service at a pCPU and leaves the state. The derivation of pcpu is based on the delay caused by oversubscribed resources presented in Section II. (
1
if CPU is not oversubscribed if CPU is oversubscribed (2) where pCPUj denotes the capacity of the j th physical CPU, vCPUi denotes the capacity of the ith virtual CPU and utili denotes the CPU utilization due to VMi . If pcpu < 1, then the CPU resources of the physical machine are oversubscribed; otherwise pcpu = 1. pcpu =
3)
P 1 i bsi c+1 b 128×4
× pcpu
bs
i i if b P 128×4 c < 1 i bsi c≥1 if b 128×4
P (3) Note that calculation of p0cpu and p00cpu differ slightly as i bsi depends on whether it relates to disk or network I/O. In the case of disk I/O, the total I/O size counts both read and write requests. However, we have to count the total I/O size of sending and receiving packets for network I/O separately because they use separate memory tables. Disk requests are served in FIFO order and thus, the arrival ρ queue length at any disk is equal to 1−ρ , where ρ is the utilization of the server. If the queue length is smaller than 1, meaning there are no queued requests, then the probability of a job accessing the physical disk is pdisk = 1 . Based on this, the probability of completing disk service is:
pCP Uj i utili ×vCP Ui j
2) I/O workloads: Recall that the guest VM has a shared memory area with Dom0 for processing I/O requests. The Xen hypervisor also has an event channel for handling the interrupts from guest VMs. This channel goes through the hypervisor and has some latency associated with it. Note that we account for this delay in our Dom0 state. When one VM needs to perform I/O, it follows these steps (see also Figures 4(b) and 4(c)):
2)
P
1
P
P
1)
=
where C is the capacity of the server [34] and ρ is the utilization of the server. As each job sees the same effective service capacity C(1−ρ), the probability of leaving the Dom0 state, i.e., going to the pCPU state is: pDom0 = 1 − ρDom0
=
p00cpu
The VM creates an I/O request and places it in the shared memory area (grant table). This process is represented by state pCPU . The VM sends an interruption to Dom0 (state Dom0) via a pre-established channel. Dom0 reads the shared memory and asks the hypervisor for access to the memory areas pointed to by this request. Dom0 submits the request either to storage or the network (see state Disk and N et). When the request completes, Dom0 places the response back in the shared memory, revokes its access to the memory areas pointed to by the request and sends a notification to the guest VM. The guest VM reads the response from the shared memory, clears the interruption channel and accepts the response as success or failure for that request.
Equation 3 P abstracts the effect of the memory map locking delay, where i bsi represents the total I/O sizes of all requests issued at the same time. When this number is larger than the maximum 128 entries × 4 KB, the memory page locks and updates itself; thus some of the requests have to be placed in the next interval. p0cpu and p00cpu represent the probability of a request successfully accessing the memory table and passing the request to Dom0 for disk and network requests respectively. They depend on pcpu because performing I/O operations also consumes CPU cycles.
pdisk =
1 − ρdisk ρdisk
(4)
where ρdisk represents the utilization of the disk channel. For block devices such as iSCSI, which are common in cloud environments, ρdisk would be the utilization of the connection between the host and the iSCSI server. In our setup, we have 10 Gbps links between the server and the storage server which comprises multiple disk volumes. We found that in this case pdisk is usually close to 1. The probability of network requests being served and leaving the system can be calculated as, ( if pNIC is not oversubscribed P 1 pNIC j pnet = P j if pNIC is oversubscribed i util i ×vNIC i (5) where pNICj denotes the capacity of the j th physical network interface, while vNIC i denotes the capacities of the ith virtual network interface. utili denotes the network utilization due to VMi . Note that we can easily obtain all these parameters, such as physical or virtual CPU utilization or network capacity, from hypervisor profiling utilities such as xentop. B. Virtualization Slowdown Factor The states of the Markov Chains of Figure 4 represent a system of inter-related geometric distributions in sequence. Thus the mean time to absorption, i.e. the mean delay for each chain is: 1 1 + E(Kcpu ) = pDom0 pcpu 1 1 1 E(Kdisk ) = + 0 + pDom0 pcpu pdisk 1 1 1 E(Knet ) = + 00 + pDom0 pcpu pnet E(Kcpu ), E(Kdisk ) and E(Knet ) represent the mean time that a VM request will take to complete execution on the CPU, disk or network given a certain workload on the virtualized system. We define E 0 (Kcpu ), E 0 (Kdisk ) and E 0 (Knet ) as the expected execution time for a VM running alone or running
with other VMs in an environment with unsaturated resources, i.e., when pDom0 , pcpu , p0cpu , p00cpu , pdisk , and pnet are equal to 1. Thus, the virtualization slowdown for each resource given a current workload on the system is: E(Kcpu ) E 0 (Kcpu ) E(Kdisk ) γdisk = 0 E (Kdisk ) E(Knet ) γnet = 0 E (Knet )
The time complexity of Algorithm 1 is the product of the number of targeted VMs and PMs, O(mn). However, the Vslowdown model runs simultaneously across the Dom0 of each PM, so in practice the time complexity is linear in the number of targeted VMs.
γcpu =
An application needs a certain proportion of CPU, disk, and network resources to run a job. For example, a file compression job might spend 58% of the total execution time on CPU and 42% on disk I/O. Without any other system bottleneck or competing job, the vector βi,j represents an application’s resource usage profile, referred to as the loading vector [9], [33], [35]. βi,j =
the time of job j spent on resource i the total completion time
(6)
Therefore, the virtualization slowdown δ of an application/VM when co-located with other VMs on a system with a known current workload is: X δj = γi × βi,j (7) i
where j denotes a particular application VM and i represents different types of resources. δj allows us to evaluate how much performance slowdown one application VM might experience if co-resident with n − 1 VMs. IV.
(see Section V-D) we acquire the loading vectors online from running monitoring tools (such as top) inside each VM. This allows us to continuously update and refine migration and consolidation decisions without prior knowledge of the applications.
I NTERFERENCE C ONFLICT H ANDLING
CloudScope can answer several key questions that arise when trying to improve VM scheduling and consolidation in cloud environments. For example: (1) among multiple VM placements which physical machine can best satisfy the required SLO; (2) what should be the right degree of VM consolidation in terms of the utilization-performance trade-off; (3) can the hypervisor be self-adaptive without having to reboot to improve the performance of applications? In this section, we illustrate how CloudScope is able to provide insight for answering these questions. A. Dynamic Interference-aware Scheduling Workload consolidation increases server utilization and reduces overall energy consumption but might result in undesirable performance degradation. By default, all newly created VMs are assigned to a PM by a load balancing scheduler that is generally based on a heuristic such as bin packing. CloudScope currently decides whether to trigger migration by comparing the V-slowdown factor among all potential PMs, and migrates VMs to the PM with the smallest V-slowdown factor as shown in Algorithm 1. The algorithm greedily finds the most suitable PM for each VM by picking the PM with the smallest slowdown when assigned the new VM. It requires the loading vectors from each VM as input. Previous work has shown how to obtain these [9], [33], [35]. In our experiments
Algorithm 1 Interference-aware Scheduling Algorithm Data: Targeted VM j , where j ∈ 1, . . . , n; Resource pool consist of PM k , where k ∈ 1, . . . , m; Obtain the workload factor βi,j for each task within VM j ; Model is the V-slowdown interference prediction model. Result: VM j to P Mk assignments 1: for j = 1 to n do 2: for k = 1 to m do 3: δj = Predict(βi,j , PM k , Model ); 4: end for 5: end for 6: P Mcandidate = minj (δj ); 7: Assign(VM j , PM candidate );
B. Local Interference Handling In some cases, CloudScope will not migrate the application VM but instead resolve the problem locally using Dom0 reconfiguration. This prevents the application from experiencing a period of high SLO violations and the destination PM from experiencing increased utilization in Dom0 due to migration. CloudScope allows adaptive Dom0 configuration to transfer unused resources for better performance without affecting application SLOs. For example, in Figure 2(c), 8 vCPUs are given to Dom0. These are needed in order for Dom0 to sustain the workload and fully utilize the hardware resource for the current guests. The same effect can be achieved by changing the CPU weight and cap of Dom0. For example, a domain with a weight of 512 will get twice as much CPU as a domain with a weight of 256 on a contended host. The cap fixes the maximum amount of CPUs a domain can consume. With different weights and caps in the system, we can modify the models by setting: wDom0 pDom0 = (1 − ρ) ∗ P wi
(8)
i n
where wDom0 and wi represent the weight of Dom0 and each guest VM respectively, and n is the number of guest VMs. We assume that the SLOs are provided to CloudScope by the users or cloud providers. Therefore, when a violation of an SLO is detected and the current host does not have a full CPU which in our model means pcpu = 1 and P utilization,P pCP U > j j i utili × vCP Ui , CloudScope will derive the Dom0 CPU weight needed by Equation 8. This will change the attributes of file /boot/extlinux.conf in Dom0 triggering a hot reconfiguration without rebooting. In Section V-E, we illustrate the effect of modifying the attributes of Dom0 on-the-fly.
1.5
prime = 5000 model prime = 3000 model
1 0.5 0 0 5 10 15 20 25 30 35 40 45
120 110 100 90 80 70 60 50 40
2 DomUs 5 DomUs 10 DomUs 32
Number of VMs
(a) CPU execution time validation
Nor. Throughput Per VM (Gb/s)
2
Total Disk Throughput (MB/s)
Average Execution Time (ms)
2.5
64
128
256
Block Size (KB)
(b) Disk throughput validation
512
1 0.9 0.8 0.7 0.6 0.5 0.4 0.3 0.2 0.1 0
Nor. Thro model 1 2 3 4 5 6 7 8 9 10 Number of VMs
(c) Network throughput validation
Figure 5. Interference prediction model validation for (a) CPU, (b) disk, and (c) network intensive workloads. Figure (a) shows the validation results for average execution time, executing prime 3000 and 5000. Figure (b) shows the validation results for the total disk I/O throughput of 2, 5, and 10 DomUs with different block sizes. Model results are shown in the same color but as dashed lines. Figure (c) shows the validation results of the normalized throughput of one VM co-resident with another 1 to 9 VMs.
V.
E VALUATION
In this section, we evaluate a variety of workloads to validate the proposed model. We use (1) the single workloads for CPU, disk, and network as presented in Section II, (2) a synthetic workload in which we combine the three, and (3) a realistic workload which consists of Hadoop MapReduce jobs. The results in this section show that CloudScope is able to accurately capture the performance degradation and the interference of VMs caused by Xen virtualization. The validation experiments are run with the same hardware configurations as introduced in Table I of Section II with the results averaged over 30 runs for each experiment. A. Experimental Setup To ensure that our benchmarking experiments are reproducible, we provide the configuration for the Xen hypervisor used in our experiments. All the experiments are running on XenServer 6.2.0 (Clearwater)2 with the following configurations: (1) we fine-tune Dom0’s vCPU to pCPU affinity before the domains boot. The reason for this is that the vCPU will run on specific NUMA nodes and try to allocate memory closer to it, so it helps Dom0 to deliver better performance; (2) we turn off power saving mode to avoid Xen adjusting the CPU clock rate dynamically3 (3) we enable hyper-threading on the test machine as the Xen and VMware hypervisors perform better with hyper-threading [7] and to emulate Amazon EC2 in which VM instances run on hyper-threaded CPUs. The system used to collect the performance data from our benchmarks is similar to the testbed setup in [32]. For disk I/O, before running the actual experiments, we create a large file on each VM to completely fill the file system and then delete this file. This ensures that the virtual hard disk is fully populated and performance metrics will be correct. We also run iostat to make sure that all the virtual block devices are active. 2 http://support.citrix.com/article/CTX137826 3 http://blogs.citrix.com/2012/06/23/xenserver-scalability-performancetuning/
B. CPU, Disk, and Network Intensive Workloads First we present the prediction results for the scenarios in which the VMs are running CPU, disk, or network intensive workloads generated by sysbench, fio, and iperf, respectively (equal to Section II). We validate our model against system measurements presented in Figure 5. Figure 5(a) shows the validation results of the average execution time of prime 3000 and prime 5000 workloads with an increasing number of VMs. The mean model prediction error is 3.8% for prime 5000 and 10.5% for prime 3000. From 1 to 25 VMs, the model deviates from the measurement data but the results are still within standard deviation of the measurements. In particular, the model underestimates execution time for the prime 3000 workload, as the performance is affected by hyper-threading overhead which is not considered in the model. The disk intensive workload validation results are shown in Figure 5(b). The dashed lines represent the model predictions. The total throughput of 2, 5, and 10 VMs running sequential read workloads with varying block sizes from 32 to 512 KB is predicted with a mean error of 7.4%. The drops at 256 KB block size in all three scenarios are precisely captured. We only present block sizes from 32 to 512 KB for the disk I/O validation. Firstly because, as shown in Figure 2(b), block sizes from 1 to 32 KB are dominated by the hypervisor overhead caused by the performance differences between nonvirtualized and virtualized domains but our model focuses on the performance interference caused by virtualization within a multi-tenant environment. Secondly, for block sizes larger than 512 KB, our model does not account for the processing of memory page locking and updating. Hence, the model cannot accurately capture the performance outside of those boundaries. Figure 5(c) represents the normalized network throughput validation with 1 to 9 VMs running iperf. The mean prediction error is 4.8%. The model follows the measurements closely and can reflect the effect of intensive Dom0 overhead and sharing network resources with other VMs.
120
Net I/O ThPut of the VM (req/s)
Disk I/O ThPut of the VM (KB/s)
Table II. Measurement Model
100 80 60 40 20 0 1
5
10
15
20
Num. of VMs running with
(a) Disk throughput
50
PMs VMs Shared Storage Network IaaS Hypervisor
Measurement Model
40 30 20
S PECIFICATIONS FOR EXPERIMENTAL ENVIRONMENT 13 Dell PowerEdge C6220 & 8 Dell PowerEdge C6220-II 250 to 270 other VMs running during the experiments NetApp + Cumulus 04 (ZFS) shared storage (iSCSI) 10Gbps Ethernet. 10Gbps switch Apache Cloudstack v4.1.1 XenServer 6.2.0
10 0 1
5
10
15
20
Num. of VMs running with
(b) Network throughput
Figure 6. Interference prediction model validation of mixed workload. Figure (a) and (b) show the disk and network throughput of a targeted VM collocated with 5, 10, 15, and 20 VMs
C. Mixed Workload Next, we apply our model to a workload consisting of a mix of disk I/O and network intensive jobs in combination with a moderate CPU workload running together within each VM. The VMs were configured with 4 vCPUs with 1 GHz per vCPU, 8 GB memory, 32 GB storage, and 1 vNIC. We refer to the network intensive workload as std-net. It comprises a set of HTTP requests over the network to the VM which runs an HTTP server. httperf was deployed to generate the HTTP client workload with clients distributed across the hosts in our private departmental cloud. The disk intensive workload is referred to as std-disk which is a sequential read of 1 GB data with block size 64 KB and without buffer access. The CPU workload is referred to as std-cpu which is a sysbench prime 2000 workload. We predict the virtualization slowdown of a VM running a mixed workload when co-resident with 5, 10, 15, and 20 VMs running the same mixed workloads. Figure 6 shows the prediction of the model for the disk and network throughput for a target VM as the number of co-resident VMs increases. The std-cpu workload (not shown) did not incur obvious degradation resulting from co-residency (also predicted by the model). The average relative prediction error is less than 8.3% and 18.4% for disk and network throughput respectively. The prediction error of network throughput is higher than disk throughput likely due to other cloud network traffic between our client and server VMs. D. MapReduce Workload In this section we investigate the accuracy of our interference prediction model based on a real workload. We deploy Apache Hadoop Yarn [14] on 4 VMs (4 2.9 GHz vCPUs, 8 GB memory, and 40 GB local disk) co-located within the same physical machine with one master node and three workers. We use Apache Pig [36] to run a subset of the queries from the TPC-H benchmark [37] on a 10 GB dataset with varying complexities. Some of the queries need several consecutive MapReduce jobs to be processed. We run the first four TPCH queries for 30 times both alone and with another 20 VMs running prime 3000 and 5000. For space reasons, we do not list all the MapReduce jobs involved during a query but rather pick individual jobs from each query in a way that we cover a
broad spectrum of different numbers of map and reduce tasks. Each job has M mappers and R reducers, written as M :R. Figure 7 presents the average performance of 1:1, 8:1, 10:2, and 58:8 jobs running alone and co-located with the other 20 VMs running either prime 3000 or 5000. The model predictions are compared to measurements. Map and reduce tasks were validated separately because they have different proportions of resource usage. The mean relative error for map and reduce tasks is 10.4% and 11.9%, respectively. The mean relative errors for each 1:1, 8:1, 10:2 and 58:8 job are 14.3%, 6.7%, 8.3% and 14.8%. The evaluation shows that in this case study, our model is able to achieve a prediction error less than 20% across all workloads. In the following, we use our model to enhance VM performance by implementing an interference-aware scheduling approach and an adaptive Dom0. E. Interference-aware Scheduling To evaluate CloudScope’s interference-aware scheduling mechanism, we compare it to the default CloudStack VM scheduler [15]. Using the experimental setup described in Table II, we utilize our private cloud consisting of 21 physical machines running Apache CloudStack. At the time of our experiments, the cloud was open to other users and was running between 250 to 270 other VMs with unknown workloads. We prepare the 34 VMs with the following workloads: 10 VMs running std-cpu, 10 VMs running std-disk, and 10 VMs running std-net and another 4 VMs running Hadoop as configured in the previous section. We launched these 34 VMs using both the default CloudStack VM scheduler and our CloudScope scheduler and measured the average execution time, throughput, and Map/Reduce job completion times for all VMs and repeated this experiment 3 times. Figure 8 details the average performance improvement of each type of VM when scheduled with CloudScope in comparison to the default CloudStack scheduler. The error bars show the standard deviation across all VMs for a single workload and all runs. The std-disk and std-net VMs show a performance improvement of 10% when scheduled with CloudScope. The std-cpu and Hadoop VMs show an improvement of 5.6% and 2.1%, respectively. Because of the grant memory management (see Section II-B), the I/O intensive VMs are more sensitive to resource contention and hence, the CloudScope scheduler achieves larger improvements in these cases. F. Adaptive Dom0 We also use CloudScope to implement an adaptive Dom0 which is able to its configuration parameters at runtime. We run the std-net workload using VM-net VMs (see Table I) using the same PM. 10 VMs running iperf server were
Reduce Map
60 50 40 30 20 10 0
1:1
8:1
10:2
70 60 50
Avg. Map and Reduce Time (sec)
Avg. Map and Reduce Time (sec)
Avg. Map and Reduce Time (sec)
70
Reduce Map Model (reduce) Model (map)
40 30 20 10 0
58:8
1:1
Dedicated
8:1
10:2
58:8
With 20 VMs running CPU job (3000)
(a) 4 MapReduce jobs on dedicated PM
(b) Map and Reduce time prediction (3000)
70 60 50
Reduce Map Model (reduce) Model (map)
40 30 20 10 0 1:1
8:1
10:2
58:8
With 20 VMs running CPU job (5000)
(c) Map and Reduce time prediction (5000)
Nor. Throughput Per VM (Gb/s)
Figure 7. Interference prediction model validation for different Hadoop workloads with different numbers of mappers and reducers. For example 1:1 represents 1 mapper and 1 reducer. Figure (a) shows each Hadoop job running dedicated within one PM. Figure (b) and (c) show the validation results of each Hadoop job with 20 co-resident VMs executing prime 3000 and 5000, respectively.
Ave. Improvement (%)
14 12 10 8 6 4 2 0 cpu
disk
net Hadoop
1 0.9 0.8 0.7 0.6 0.5 0.4 0.3 0.2 0.1 0
Dom0 weight 512 Dom0 weight 256 1 2 3 4 5 6 7 8 9 10 Number of VMs
Figure 8. CloudScope schedul- Figure 9. CloudScope self-adaping results compared to the default tive Dom0 with different vCPU CloudStack scheduler weights Table III. Approaches TRACON [4] CloudScale [38] Paragon [1] Cuanta [35] Q-Clouds [5] CloudScope
R ELATED V IRTUALIZATION I NTERFERENCE W ORK Application Data-intensive CPU contention CPU or IO-bound Cache, memory CPU contention Any application
Techniques Model training & Nonlinear Linear Microbenchmark & ML Cache pressure clone Nonlinear No microbenchmark & linear
Avg. Err. 19% 14% 5.3% 4% 13% 9%
launched on the PM. Dom0 was configured with 4 vCPUs with weight 256 and a cap of 400. CloudScope could recognize that Dom0 suffered heavy network I/O workload while handling the network traffic. CloudScope obtained the weight needed by Equation 7 and 8, calculating a new weight of > 425. Changing the weight of Dom0 to 512 provides an average performance gain of 28.8% (see Figure 9). The two presented simple use cases demonstrate that our model can be successfully applied to improve VM performance. We believe that more sophisticated scheduling and reconfiguration approaches can also benefit from CloudScope. VI.
R ELATED W ORK
CloudScope is lightweight and provides good accuracy in comparison to previous work. Table III provides a comparison of CloudScope to similar work in the literature. We discuss related work in three major parts. Hypervisor overhead benchmarking. Cherkasova et al. [23] analyzed the impact of different Xen schedulers on appli-
cation performance and discussed challenges in estimating application resource requirements in virtualized environments. Shea et al. [17] studied the performance degradation and variation for TCP and UDP traffic, then provided a hypervisor reconfiguration solution to enhance the performance. Pu et al. [25] presented experimental research on performance interference on CPU and network intensive workloads on the Xen hypervisor and reached the conclusion that identifying the impact of exchanged memory pages is important to the in-depth understanding of interference costs in Dom0. Our work makes similar findings but then uses those to guide our analytical model. Performance interference modeling. Most work on performance interference modeling is based on machine learning or heuristic methods, which are either computationally intensive (in the former case) or less accurate (in the latter case) compared to analytical solutions. Nathuji et al. [5] used online feedback to build a multiple-input multiple-output model that captures performance interference interaction. Caglar et al. [7] proposed a machine learning-based technique to classify the VMs based on their historic mean CPU and memory usage and extracted the patterns that provided the lowest performance interference while still allowing resource overbooking. Kraft et al. [13], [12] proposed a simple model to predict the performance degradation of disk requests due to storage device contention in consolidated virtualized environments. Lim et al. [33] proposed a dilation-factor, similar to the virtualization slowdown proposed in this paper, to model application slowdown in multi-resource shared systems. Govindan et al. [35] proposed a technique for predicting performance interference due to a shared processor cache. VM scheduling and consolidation. Roytman et al. [6] proposed a polynomial time algorithm which yields a solution close to the optimal to determine the best suited VM combination. Chiang et al. [4] presented the TRACON system, a task and resource allocation control framework that mitigates the interference effects from concurrent data-intensive applications and improves their performance. Kim et al. [8] presented a VM consolidation method based on the idea that a highly interference-intensive VM should be co-located with less interference-sensitive ones. By contrast to the above, CloudScope estimates the per-
formance slowdown of VMs using an analytical model that includes hypervisor overhead and resource contention. The method is simple, does not require pre-training and is applicable to any application. In addition, the models can adapt to future changes within the Xen architecture, for example, when decentralizing the Dom0 to multiple, specialized domains. VII.
[11]
[12]
[13]
C ONCLUSION [14]
In this paper, we have presented CloudScope, a comprehensive system to predict resource interference in virtualized environments, and used the prediction to optimize the operation of a cloud environment. CloudScope incorporates a lightweight analytical model for the prediction of performance degradation. To this end, we have characterized and analyzed different workload behaviors by benchmarking CPU, disk, and network intensive workloads. CloudScope predicts the completion time of jobs by a using virtualization-slowdown factor that incorporates the effect of hypervisor overhead and resource contention. Evaluation shows that CloudScope can achieve an average relative error of 6.1% for single resource intensive workloads, 13.4% for mixed resource workloads, and 11.2% for MapReduce workloads. CloudScope provides an efficient interference-aware VM scheduling mechanism which can improve job completion time on average by 7.5%. For future work, we plan to apply CloudScope to other hypervisors and more sophisticated scheduling and consolidation scenarios.
[15] [16]
[17]
[18]
[19]
[20]
[21]
ACKNOWLEDGMENTS
[22]
We would like to thank Juan P´erez and the anonymous reviewers for their time and insightful comments. We greatly appreciate the help from Thomas Joseph, Lloyd Kamara, and Duncan White with setting up the experiments on the departmental cloud. Thanks also to Yu Liu for helping us setting up the MapReduce environment.
[23]
R EFERENCES [1] [2]
[3] [4]
[5] [6] [7]
[8]
[9]
[10]
C. Delimitrou and C. Kozyrakis, “Paragon: QoS-aware Scheduling for Heterogeneous Datacenters,” Proc. ASPLOS, 2013. A. Corradi, M. Fanelli, and L. Foschini, “VM consolidation: A Real Case based on OpenStack Cloud,” Future Generation Computer Systems, vol. 32, 2014. Y. Xu, M. Bailey, B. Noble, and F. Jahanian, “Small is Better: Avoiding Latency Traps in Virtualized Data Centers,” Proc. SoCC, 2013. R. C. Chiang and H. H. Huang, “TRACON: Interference-Aware Scheduling for Data-Intensive Applications in Virtualized Environments,” Proc. SC11, 2011. R. Nathuji and A. Kansal, “Q-Clouds: Managing Performance Interference Effects for QoS-Aware Clouds,” Proc. EuroSys, 2010. A. Roytman, “PACMan: Performance Aware Virtual Machine Consolidation,” Proc. ICAC, 2013. F. Caglar, S. Shekhar, and A. Gokhale, “A Performance Interferenceaware Virtual Machine Placement Strategy for Supporting Soft Realtime Applications in the Cloud,” Proc. RTSS, 2013. S.-g. Kim, H. Eom, and H. Y. Yeom, “Virtual machine consolidation based on interference modeling,” The Journal of Supercomputing, vol. 66, no. 3, 2013. Q. Zhu and T. Tung, “A Performance Interference Model for Managing Consolidated Workloads in QoS-Aware Clouds,” Proc. IEEE CLOUD, 2012. K. Ye, D. Huang, X. Jiang, H. Chen, and S. Wu, “Virtual Machine Based Energy-Efficient Data Center Architecture for Cloud Computing: A Performance Perspective,” Proc. ACM/IEEE GreenCom, 2010.
[24] [25]
[26] [27] [28] [29] [30]
[31] [32] [33]
[34]
[35]
[36] [37] [38]
Q. Noorshams, D. Bruhn, S. Kounev, and R. Reussner, “Predictive Performance Modeling of Virtualized Storage Systems using Optimized Statistical Regression Techniques,” Proc. ACM/SPEC ICPE, 2013. G. Casale, S. Kraft, and D. Krishnamurthy, “A Model of Storage I/O Performance Interference in Virtualized Systems,” Proc. ICDCS Workshops, 2011. S. Kang, S.-g. Kim, H. Eom, and H. Y. Yeom, “Towards Workloadaware Virtual Machine Consolidation on Cloud Platforms,” Proc. ICUIMC, 2012. “Apache Hadoop Yarn,” http://hadoop.apache.org/docs/current/hadoopyarn/hadoop-yarn-site/YARN.html. “CloudStack Resource Manager,” http://cloudstack.apache.org/software/ features.html. O. Tickoo, R. Iyer, R. Illikkal, and D. Newell, “Modeling Virtual Machine Performance: Challenges and Approaches,” Proc. SIGMETRICS workshop Hotmetrics, 2009. R. Shea, F. Wang, H. Wang, and J. Liu, “A Deep Investigation Into Network Performance in Virtual Machine Based Cloud Environments,” Proc. INFOCOM, 2014. X. Bu, J. Rao, and C.-z. Xu, “Interference and Locality-aware Task Scheduling for MapReduce Applications in Virtual Clusters,” Proc. HPDC, 2013. X. Chen, C. P. Ho, R. Osman, P. Harrison, and W. Knottenbelt, “Understanding, Modelling, and Improving the Performance of Web Applications in Multicore Virtualised Environments,” Proc. ICPE, 2014. P. Barham, B. Dragovic, K. Fraser, S. Hand, T. Harris, A. Ho, R. Neugebauer, I. Pratt, and A. Warfield, “Xen and the Art of Virtualization,” Proc. SOSP, 2003. D. Gupta, L. Cherkasova, R. Gardner, and A. Vahdat, “Enforcing Performance Isolation across Virtual Machines in Xen,” Proc. Middleware, 2006. S. A. Baset, L. Wang, and C. Tang, “Towards an Understanding of Oversubscription in Cloud,” Proc. Hotice, 2012. L. Cherkasova and R. Gardner, “Measuring CPU Overhead for I/O Processing in the Xen Virtual Machine Monitor,” Proc. ATC, 2005. L. Cherkasova, D. Gupta, and A. Vahdat, “Comparison of the three CPU Schedulers in Xen,” Proc. ACM SIGMETRICS, 2007. X. Pu, L. Liu, Y. Mei, S. Sivathanu, Y. Koh, C. Pu, and Y. Cao, “Who is Your Neighbor: Net I/O Performance Interference in Virtualized Clouds,” Proc. Services Computing, 2012. “Sysbench Benchmark,” http://wiki.gentoo.org/wiki/Sysbench. “FIO Benchmark,” http://freecode.com/projects/fio. “Iperf Benchmark,” https://iperf.fr/. “Distributed Resource Scheduler,” https://www.vmware.com/uk/ products/vsphere/features/drs-dpm. P. Tembey, A. Gavrilovska, and K. Schwan, “Merlin: Application- and Platform-aware Resource Allocation in Consolidated Server Systems,” Proc. SoCC, 2014. H. Nguyen, Z. Shen, X. Gu, and J. Wilkes, “AGILE: Elastic Distributed Resource Scaling for Infrastructure-as-a-Service,” Proc. ICAC, 2013. X. Chen and W. J. Knottenbelt, “A Performance Tree-based Monitoring Platform for Clouds,” Proc. ICPE, 2015. S.-h. Lim, J.-s. Huh, Y. Kim, G. M. Shipman, and C. R. Das, “DFactor: A Quantitative Model of Application Slow-Down in MultiResource Shared Systems Categories and Subject Descriptors,” Proc. ACM SIGMETRICS, 2012. Peter G. Harrison, Nareth M. Patel, Performance Modeling of Communication Networks and Computer Architecture. Addison-Wesley, 1992. S. Govindan, J. Liu, A. Kansal, and A. Sivasubramaniam, “Cuanta: Quantifying Effects of Shared On-chip Resource Interference for Consolidated Virtual Machines,” Proc. SoCC, 2011. “Apache Pig,” http://pig.apache.org/. “TPC-H Benchmarks,” http://www.tpc.org/tpch//. Z. Shen, S. Subbiah, X. Gu, and J. Wilkes, “Cloudscale: Elastic Resource Scaling for Multi-tenant Cloud Systems,” Proc. SoCC, 2011.