arXiv:1801.01464v1 [stat.ME] 4 Jan 2018
Cluster-weighted latent class modeling Roberto Di Mari∗1 , Antonio Punzo1 , and Zsuzsa Bakk2 1
Department of Economics and Business, University of Catania, Italy 2 Leiden University, Institute of Psychology, Methodology & Statistics Unit January 8, 2018 Abstract Usually in Latent Class Analysis (LCA), external predictors are taken to be cluster conditional probability predictors (LC models with covariates), and/or score conditional probability predictors (LC regression models). In such cases, their distribution is not of interest. Class specific distribution is of interest in the distal outcome model, when the distribution of the external variable(s) is assumed to dependent on LC membership. In this paper, we consider a more general formulation, typical in cluster-weighted models, which embeds both the latent class regression and the distal outcome models. This allows us to test simultaneously both whether the distribution of the covariate(s) differs across classes, and whether there are significant direct effects of the covariate(s) on the indicators, by including most of the information about the covariate(s) - latent variable relationship. We show the advantages of the proposed modeling approach through a set of population studies and an empirical application on assets ownership of Italian households.
Key-Words: latent class analysis, latent class regression models, continuous distal outcomes, direct effects, cluster-weighted models, household wealth, assets ownership ∗
[email protected]
1
1
Introduction
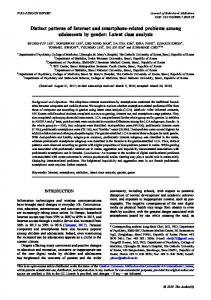
Latent class analysis (McCutcheon, 1985) is widely used in the social and behavioral sciences to locate subgroups of observations in the sample based on a set of J observed response variables Y. Examples of applications include identification of types of mobile internet usage in travel planning and execution (Okazaki et al., 2015), types of political involvement (Hagenaars & Halman, 1989), classes of treatment engagement in adolescents with psychiatric problems (Roedelof et al., 2013), a typology of infant temperament (Loken, 2004), modeling phases in the development of transitive reasoning (Bouwmeester & Sijtsma, 2007), or classes of self disclosure (Maij-de Meij et al., 2005). In many empirical studies, interest lies in investigating which external variables Z predict latent class membership X. Latent class models with covariates (Dayton & Macready, 1988) are a well-known extension of the baseline model, in which external variables are included in the latent class modeling framework as predictors of class membership (Collins & Lanza, 2010). Stegmann & Grimm (2017), for instance, discuss the inclusion of covariates in more complicated LC models. However, recent methodological development has shifted the attention towards modeling the effect in the opposite direction. That is, predicting a - possibly continuous - distal outcome based on the latent class membership (Bakk et al., 2013; Lanza et al., 2013), as depicted in Figure 1. Although there can be more than one external variable available, for sake of exposition here we describe the models with only one external variable1 . For instance, Roberts & Ward (2011) predict distal pain outcomes based on class memberships defined by patterns of barriers to pain management and Mulder et al. (2012) compared average measures of recidivism in clusters of juvenile offenders. Typically, in distal outcome models, the distal outcome and the J response variables Y’s are assumed to be conditionally independent given the latent variable X (Bakk et al., 2013; Lanza et al., 2013). A direct effect of Z on Y is therefore not allowed for, neither its presence tested. In latent variable modeling, it is well known that Maximum Likelihood (ML) estimation is subject to severe bias when direct effects are present in LC and 1 All considered modeling scenarios can be straightforwardly extended to the multiple external variables case. See, for instance, Bakk et al. (2013)
1
Z
X
Y1
Y2
YJ
Figure 1: Latent class model with distal outcome. latent trait models (Asparouhov & Muth´en, 2014, regression mixture models (Kim et al., 2016; Nylund-Gibson & Masyn, 2016), and latent Markov models (Di Mari & Bakk, 2017), and are not accounted for. Given the restrictiveness of the conditional independence assumption and the possible severity of its violation, we propose a more general model that can account for complex interdependencies between the external variable, LC membership, and the indicators of the LC model. In regression mixtures, a “circular” relation among Y-X-Z is commonly considered in the cluster-weighted modeling approach (Ingrassia et al., 2012, 2014, 2015; Punzo, 2014; Dang et al., 2017). That is, a more general model is specified, where next to modeling the class specific distribution of Z (distal outcome situation), also the direct effect of Z on Y is modeled (latent class regression). If Y are indicators of assets ownership, and Z is a measure (in euro) of net (of liabilities) wealth, the cluster-weighted modeling approach allows net wealth also to directly affect a household decision to own assets. With standard inference, the statistical significance of each effect can then be tested to see whether intermediate model specifications are more appropriate. In LC regression models (Kamakura & Russel, 1989; Wedel & DeSarbo, 1994), although the assumption of conditional independence of Y and Z can be relaxed (see Figure 2), the distal outcome’s distribution is not of interest and hence not modeled. Therefore, in the traditional LCA approach, an external variable enters the model either as a covariate (latent class re2
gression) or as a distal outcome, but never as both at the same time. We propose to extend the idea of cluster-weighted modeling in the context of latent class analysis, by proposing a generalized version of the models in Figures 1 and 2, as depicted in Figure 3, which embeds them both. X
Y1
Y2
YJ
Z Figure 2: Latent class regression model.
Z
X
Y1
Y2
YJ
Z Figure 3: Latent class cluster-weighted model. By starting from the most general model, the user can proceed backwards, testing the model assumptions of both the distal outcome and the latent 3
class regression models. In particular, in this paper we will show evidence, based on a set of population studies and an empirical application, that 1) if direct effects are present, our approach, contrary to the distal outcome model, yields unbiased estimates of the distal outcome cluster specific means and variances; and 2) if the most suitable model is one between the distal outcome model or the latent class regression model, the relative class sizes and compositions will be the same as the ones delivered under the proposed modeling approach. The paper proceeds as follows. In Section 2, we illustrate the proposed modeling approach through three population studies, in comparison with the LC regression and the distal outcome models. We give model definitions and details on the parameterizations in Section 3. In Section 4, we analyze data from the Household Finance and Consumption Survey, and conclude with some final remarks in Section 5.
2
Population studies
This Section is devoted to showing very simple and intuitive evidence, obtained by analyzing three large data sets (30000 sample units) - each drawn from the three models in Figures 1, 2 and 3 - in order to motivate the application of the cluster-weighted modeling approach in LCA (see Table 1). We set the number of latent classes S = 2, and to begin with we fit all three models assuming this value to be known. At the end of the Section, we will also show results on estimation of the number of latent classes based on BIC.
Latent Class regression Latent Class with distal outcome Latent Class cluster-weighted
Acronym Data LCreg LCreg LCdist LCdist LCcw LCcw
Table 1: Legend of acronyms used for the population models and for the generated data.
To get approximately equal (realistic) conditions on class separation, we generated the data such that the entropy-based R2 (Magidson, 1981) for the correctly specified model is about 0.7 in all the three data sets - which 4
is the minimum class separation to get a good LC model (Vermunt, 2010; Asparouhov & Muth´en, 2014). The data were generated in R (R Core Team, 2017), and parameter estimation was carried out with Latent GOLD 5.1 (Vermunt & Magidson, 2016).
2.1
LCreg data
The LCreg data set was generated from a two-class LCreg model, with class memberships of 0.7 and 0.3, six dichotomous indicators (J = 6) and one continuous Z - drawn from a standard normal distribution - loaded on all six indicators. The external variable Z is loaded on the indicators with a coefficient of -0.5, if the most likely response is on the first class, or 1, if the most likely response is on the second class, giving a large effect size. Class proportions LCreg 0.7010 0.2990 LCdist 0.7357 0.2643 LCcw 0.7018 0.2982
Entr. R2 0.7675 0.8639 0.7681
#par 25 17 29
Table 2: LCreg data. Estimated class proportions, entropy-based R2 and number of parameters for each of the three estimated models. Results from correctly specified model in bold font.
We observe in Table 2 that the LCdist model overinflates the mixing proportion on the bigger class, whereas the LCcw model yields nearly equivalent class proportions as in the correctly specified case. This at the cost of four more parameters to be estimated. Table 3 reports estimated means and variances for the variable Z based on the LCdist and LCcw models, along with standard errors and p-values of the Wald tests of equality of the means and the variances. Nothing is reported for LCreg, as Z is not modeled. In the LCdist model, both the means are wrongly estimated to be statistically different from zero. Moreover, based on the reported Wald tests, we reject the nulls of equal means and equal variances (with p-values smaller than 0.01). These findings for the LCdist model can be explained by the fact that it wrongly predicts a clustered distribution on Z in order to accommodate for a direct effect of Z on the indicators which is not accounted for. This creates an additional source of entropy in the class solution (as displayed by the relatively higher value of the entropy-based R2 ). 5
Means Wald(=) p Variances Wald(=) p LCdist 0.0525*** -0.1640*** 0.0000 1.0301 0.8846 0.0000 (0.0071) (0.0122) (0.0100) (0.0158) LCcw
-0.0010 (0.0086)
-0.0134 (0,0163)
0.9000
0.9966 (0.0114)
1.0105 (0.0208)
0.6100
Table 3: LCreg data. Estimated means (*** p-value