1
Clustering High Dimensional Sparse Casino Player Tracking Datasets clustering High Dimensional Sparse casino Player tracking Datasets ross iaci1 ashok K. Singh
Ross Iaci1 Ashok K. Singh
Abstract
The volume of customer information collected by businesses is increasing at an astronomical pace.
Ross Iaci, Department of Mathematics, The College of William and Mary, Williamsburg, VA, 23187. Email
[email protected]. Ashok K. Singh, William F. Harrah College of Hotel Administration, University of Nevada, Las Vegas, 89154-6021.
in this article, we propose an iterative procedure for clustering sparse high dimensional transaction datasets, specifically two casino player tracking datasets. a common problem in clustering sparse datasets with very large dimensions is that in addition to classical techniques of clustering being unable to provide useful results, latent variable methods used for clustering often do not lead to sufficient data reduction to yield useful and informative results either. initially, we propose a straightforward resorting of the full dataset and then define an information based sparsity index to subset the sorted data. this new dimension reduced dataset is less sparse, and thus, more likely to produce meaningful results using established techniques for clustering. Using this technique enables the clustering of two secondary datasets from two Las Vegas repeater market casino properties, which consist of the amount of money casino patrons gambled, termed coin-in, on a variety of slot machines. Key Words and Phrases: cluster analysis; transaction Data; Binary Entropy; Sparse Matrices; casino Player tracking. 1. Introduction the volume of customer information collected by businesses is increasing at an astronomical pace. in 1992 the retail store giant Walmart started with a database of one terabyte for its 3, 600 U.S. stores. this database grew to four petabytes by 2007 as the number of stores increased to a little over 6, 000. the casino industry has not lagged in this area. Harrah’s started the first nationwide player loyalty program named total gold in 1997, which transformed into the tiered loyalty program total rewards in 2000. among many of the goals for the loyalty program data is to build customer profiles based, for example, on what games casino patrons are likely to play, how much they play or even their gaming ability (Berman, 2006). currently, large retail store chains employ sophisticated forecasting and planning systems based on the clustering, or grouping, of their stores. 1
ross iaci, Department of Mathematics, the college of William and Mary, Williamsburg, Va, 23187. Email
[email protected]. ashok K. Singh, William F. Harrah of Hotel administration, University of nevada, Las Vegas, 89154-6021. UNLV Gaming Research & Review Journal ♦ Volume 16 Issue 1
21
2 Similarly, large casinos with customer loyalty programs also use customer transaction data for the segmentation of customers in order to improve marketing strategies and increase membership. the groupings of stores, or customer segments, are quite often formed by simplistic methods, such as clustering stores, or customers, in a geographic location by zip code or ranked sales. typically, these approaches ignore a large amount of the data collected by the business. a better alternative is to use statistical cluster analysis, a data mining tool that uses the correlation between different variables in a database to form store, or customer, clusters. Forecasting, or planning systems, that use this added information obtained from statistical clustering will lead to an increased potential for growth. customer transaction data is multivariate in nature, with the columns, or variables, that might for example represent the products in the store purchased by a customer. the size of the dataset to be segmented is typically very large, often hundreds of thousands of observations made on hundreds of variables and regularly, the dataset is very sparse, sometimes with over 90% zero entries. With sparse datasets of large dimensions, performing a cluster analysis and obtaining meaningful and interpretable results may not be feasible. in addition, latent variable methods for clustering, such as Principal component analysis (Pca) or Factor analysis, may not work for such datasets as the amount of data reduction is often minimal. in order to use traditional methods for cluster analysis our method first rearranges the full dataset so that there is a less sparse upper left principal matrix i.e., the upper left part of the data matrix does not have a large number of zero entries. to this end, we introduce a sparsity index based on binary entropy to extract a significantly dimensioned reduced, and less sparse, data matrix more suitable for using an appropriate and established clustering technique. Binary entropy is a measure of the variability, or randomness, in a sequence of 0’s and 1’s. Moreover, since it is to be expected that the column dimensions will still be large, it is likely that it will be necessary to use latent variable methods to characterize, and visualize, the key differences between groups, which are now more likely to provide reasonable results. this procedure can then be iterated by successively removing the extracted row observations in each principal matrix from the original dataset and repeating the method on this new dataset. our method is motivated by the need to cluster casino patrons to find groups of players that are similar, or dissimilar, in the type and frequency of the machines that they play. that is, our goal is to perform a cluster analysis on two extremely sparse casino player tracking datasets, where the rows correspond to customers and the columns to slot machines. Specifically, the first dataset consists of � � 200� 000 players � � 500 slot machines, and the second approximately � � �0� 000� � �� � 50, where the observations are the percentage of coin-in per player for each machine. Since there are nearly � � 500 and 50 machines, or columns, the datasets naturally consist mostly of zero entries; there are 96.6% zero entries for the first dataset analyzed in Section 4 and 81.25% for the second dataset studied in Section 5. of note, since the datasets are the propriety of the casinos they have been altered to maintain the structure, which is of importance to this article, yet hide the interpretable business information, which is imperative to the casino. this is accomplished by simply randomizing the order of the column labels,
22
UNLV Gaming Research & Review Journal ♦ Volume 16 Issue 1
The groupings of stores, or customer segments, are quite often formed by simplistic methods. Typically, these approaches ignore a large amount of the data collected by the business. A better alternative is to use statistical cluster analysis.
3
Our method is motivated by the need to cluster casino patrons to find groups of players that are similar, or dissimilar, in the type and frequency of the machines that they play.
withholding the specific type of slot machine, and randomly interchanging the customer row labels. there has been a significant amount of research on how to cluster large categorical datasets. in a recent article on this topic Yan, chen, Liu & Yi (2010) proposed the ScaLE technique, which provides a measure of the quality of the clustering results and importantly, does not require the manual setting of the number of clusters. an example of the type of categorical transactional datasets considered is ݐଵ ൌ ሼ݈݉݅݇ǡ ܾ݀ܽ݁ݎǡ ܾ݁݁ݎሽ and ݐଶ ൌ ሼ݈݉݅݇ǡ ܾ݀ܽ݁ݎሽ, which are a three-item and two-item transaction, respectively. Yan et al. (2010) note that, although generic categorical clustering algorithms (andritsos, tsaparas, Miller, & Sevcik, 2004; chen & Liu, 2005; Barbara, Li, & cuoto, 2002; gibson, Kleinberg, & raghavan, 1998; ganti, gehrke, & ramakrishnan, 1999; guha, rastogi, & Shim, 1999; Huang, 1998; Li, Ma, & ogihara, 2004) can be applied by transforming the data into a Boolean dataset, the two key features of high dimensionality and large volume make the existing algorithms inefficient to process the transformed data. note that our focus here is not on large categorical datasets that we can transform to Boolean data, but rather on quantitative data of very large dimension; the dimensions of the casino datasets used in our examples are significantly larger than those used in Yan et al. (2010). Most importantly, unlike these methods, we do not develop a new clustering procedure to segment the original dataset directly, rather we extract dimension-reduced datasets from the original data that can be mined using the numerous techniques for identifying clusters that have been developed in the literature. this article is organized as follows: the method developed to find a subset of sparse datasets more suitable for clustering is described in Section 2; the source of the two casino player tracking datasets is discussed in Section 3; analysis of the two casino datasets are presented in Sections 4 and 5, respectively; a general discussion follows in Section 6; and finally, a brief appendix explaining certain steps of the clustering method are given in appendix 7. 2. Methodology in this section we detail our method to subset sparse datasets of high dimension. in Section 1 we describe a simple resorting of the original dataset. in Section 2 an algorithm based on information theory is described for finding a non-sparse, or less sparse, subset of the sorted dataset more suitable for performing a cluster analysis. 2.1 Sorting algorithm Let ࡰൈ be any data matrix, with entries denoted ݀ , and let ࡰሺଵሻ be the corresponding indicator matrix of ’s and ’s for each nonzero and zero entry ሺଵሻ of ࡰ, respectively. that is, each entry ݀ of ࡰሺଵሻ , is assigned a value of if the corresponding entry ݀ Ͳ, and otherwise, for ݅ אሼͳǡ ǥ ǡ ݊ሽǡ ݆ א ሼͳǡ ǥ ǡ ሽ. also, assume that ݊ and are both large and that most entries of ࡰ are zero, i.e., assume that ࡰ is a sparse matrix. First, consider the rows of ࡰሺଵሻ that have the most nonzero entries and sort the rows of the matrix such that UNLV Gaming Research & Review Journal ♦ Volume 16 Issue 1
23
4 these particular rows are listed first. next, sort the columns in an analogous manner by sorting the rows of the transpose of the previously row sorted matrix. the resulting sorted indicator matrix, denoted ����� , has a least sparse principal matrix in an upper left quadrant of dimension �� � �� . Finally, this matrix is used to index the original sorted data matrix, denoted ���� . a method for determining the row and column dimensions ��� � �� � of this matrix is given next Section 2. a simple illustrative example of the sort algorithm is given in Section 1 of the appendix. note that in the analysis of the casino player tracking datasets in Sections 4 and 5 we do not take into account the actual value of the entries of the data matrix �. We could do so easily by placing some sort of rank on the each data value. the most basic would be to assign each entry its actual ranked value and then proceed as discussed above; this is demonstrated in Section 7.1 of the appendix. However, for large sparse datasets this may not be optimal in that a sparse row may contain only a few large values, which would cause this sparse row to be collected among the very first; an undesirable result. this would also likely be true for summing over the actual observed data values. thus, the resulting matrix would not have the most dense upper left quadrant, as is the goal here. note that after iterating our method these rows could eventually be collected with similarly typed observations. in the analysis of the casino player tracking datasets, each entry is given a weight of as initially described. this seems appropriate for the datasets considered in this work, since the observations are the percentage of coin in per player on each machine; see Section 3 for a description of the datasets. 2.2 Sparsity index to reduce the dimension of the data matrix both in the number of rows and columns, that is, to find a suitably non sparse dataset more appropriate for applying established clustering methods, we develop a procedure based on information theory. Specifically, we base our method on the well known Shannon binary entropy measure for a Bernoulli random variable � with success probability �, �
���� � � �� ��� � ���log � ��� � �� ���
� ����� � �� log � �� � �� � ���log � ����� � � ��� ���
(1)
where log � is the base 2 logarithmic function and log � ��� � �������� is a nonnegative function that is maximum, with a value ���� � �, when � � ���, and minimum, with ���� � �, when � � � or . ���� can essentially be thought of as the ability to predict the event of a or . For example, suppose that a fair coin is tossed and a head is denoted as a and a tail as , then when � � ���, the ability to predict the outcome on each toss is minimal and so the entropy is maximum. However, if � � �, then a is certain and the entropy is . For more details see, for example, Hyvärinen, Karhunen, & oja (2001), or Stone (2004). For our purposes we treat any sequence ��� � of and ’s of length � as a vector of observed realizations of a bernoulli random variable with estimated success probability �̂ � ∑���� �� /
24
UNLV Gaming Research & Review Journal ♦ Volume 16 Issue 1
Note that our focus here is on quantitative data of very large dimension; the dimensions of the casino datasets used in our examples are significantly larger than those used in Yan et al. (2010).
5 �; obviously this is not true for the observations in the datasets, but is not relevant for our method. We then define the binary entropy measure of any vector, � say, consisting only of 1’s or ’s, as ���� � �� �� � �̂ � log � �� � �̂ � � �̂ log � ��̂ ��. Extending this idea to matrices, consider any matrix ���� , where each entry ��� � � o� �, and denote any �� � �� principal matrix as ������ , �� � ��� � � ��, �� � ��� � � �. next, write the entries of � as a vector and calculate the binary entropy measure of � as � � � �� �� � �̂ � log � �� � �̂ � ��� � �̂ log � ��̂ ��� ����� �̂ ��
��
� �� ��� ���
(2)
��� . �� ��
� � � �, and thus, values of note that, if � � ������ � ������ , then ��� � � near implies that � is predominately composed of either ’s or ’s, ��� � � near imply that � has nearly an but not both. conversely, values of ��� � � can be equal number of ’s and ’s. therefore, in general the index ��� � used as a measure of the sparsity of the matrix . next, we consider all possible divisions of the sorted indicator matrix ���� ���� into four primary matrices, denoted �� � � � ��� � � ��, and calculate the � � for each. the matrices containing all possible matrix entropy values ��� entropy measures, corresponding to every possible division, are denoted �� . given the row and column dimensions, �� and �� , this can be diagrammed as follows, �
����
� � ���� ����� ����� � � �
� � ���� � � ��� ������� � � �
� ���� � ����� ��� ��� � �
� ���� � ��� ����� ��� � �
� � � �� � ��� � �� � � ��� � � � � � � �� � ��� � �� �� � ��� ���.
�
���
→
���� Here the notation � ����������� refers to the matrix determined by the first �� ���� rows and �� columns, � specifies the matrix determined by the first ����� ��� ���
�� rows and �� to � columns, etc.. thus, �� ��� � �� �, �� ��� � �� �, �� ��� � �� �, and �� ��� � �� � are the matrices with each entry corresponding to the sparsity measure of a corresponding principal matrix determined by �� and �� , �� � ��� � � ��, �� � ��� � � ��. the notation �� ��� � �� � is used here to emphasize that the size of the matrices depend on the values of �� and �� . note that, �� ��� �� � �� ��� �� � �� ��� �� � �� ��� �� � ������� �, or the total sparsity measure of the matrix ����� ; the shaded region in the far left panel of Figure 1 represents the matrix that would have corresponding entropy measure �� ��� �� (or �� ��� ��). to determine a non sparse upper left matrix for analysis, indexed by �� , we find estimates of the row and column cutoffs �� and �� in two steps. in the first step the estimated number of rows ��� is UNLV Gaming Research & Review Journal ♦ Volume 16 Issue 1
25
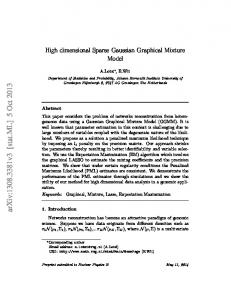
6 taken to be ��� � �������� | �� ��� � �� � �� |, where 0 � �� � �. this is equivalent to defining ��� to be the value of �� such that �� ��� � �� � �� . note that it is not necessary to fix �� � �, but we have done so because the value of �� can be chosen correspondingly for any fixed �� . For example, consider the left panel of Figure 1, the shaded region of a sorted matrix shows a possible matrix for which a value of �� ��� � �� can be calculated using ���. Further, ignoring the ellipses extending the matrix, if �� is near 1, then |�� ��� � �� � �� | would be close to for this value of �� , since there is roughly an equal number of ’s and ’s. the rationale being that the sorted ����� matrix should consist of mostly ’s in an upper most left quadrant and transition to mostly ’s in the other three quadrants. in this case, if �� is increased, more ’s are added, and the entropy of the corresponding new shaded matrix will approach , but not 1. alternatively, if �� � 0 then the resulting estimate of the number of rows would approach ��� � �. this is because there is only one nonzero entry in the last column, thus, as more zero row entries are added �� ��� � �� → 0, or |�� ��� � �� � �� | → 0, (up to a point), which implies that ��� would get closer to �. So in effect, as the value of �� is increased the number of rows determined by �� decreases. next, with the number of rows fixed, we estimate the number of columns as ��� � �������� | �� ���� � �� � � �� |, where 0 � �� � �. continuing the example, once more ignoring the ellipses, the right panel of Figure 1 shows a possible shaded matrix where |�� ���� � �� � � �� | would be near for a value of �� near . again, as �� becomes closer to then more columns would be added, with ��� near � if �� � �.
Figure 1. Explanatory example. Left panel: �� ��� � �� and Right panel: �� ��� � �� � Section 2.
26
UNLV Gaming Research & Review Journal ♦ Volume 16 Issue 1
7 ����
Succinctly, for a sorted indicator matrix ���� we introduce the sparsity index, ������� � �� , �� � � |�� |��� ��� , 1� � �� �, �� | � �� |.
(3)
in practice, for 0 � �� , �� � 1, the estimated row and column dimensions ��� and ��� are the solutions of ���� , ��� � � ������ � ������ � �� , �� �� ,��
� ������ | �� �������� | �� ��� , 1� ��
��
(4)
� �� |�, �� � � �� |, � where �� is determined first, substituted for �� , and then the outer minimization determines ��� . note that successive minimization is not necessary, but worked well for the analyzed datasets and also reduces computation time, since with �� fixed �� is determined from a smaller dimensioned indicator matrix. this reduced dimensioned dataset is then clustered. Finally, these observations are removed from the original dataset and the steps repeated until the entire dataset has been clustered. the algorithm is now shown below pictorially for one iteration for an arbitrary sorted indicator matrix �����. Moreover, this is purely illustrative in that no specific values of �� and �� , and hence, ��� and ��� , are specified. in the first step the estimated number of rows ��� is the value of �� such that |�� ��� , 1� � �� | � 0, or �� ��� , 1� � �� , for example, 1 �1 �1 � �1 �1 �0 �⋮ �0 �0
1 1 1 1 1 0 ⋮ 0 0
1 1 1 0 ⋯ 1 1 1 0 ⋯ 1 1 0 0 ⋯ 1 1 0 0 ⋯ 1 0 1 0 ⋯ 0 1 0 0 ⋯ ⋮ ⋮ ⋮ ⋮ ⋱ 1 0 0 0 ⋯ 0 0 1 0 ⋯ 1 1 1 1 1 � 1 1 1 1 1 �� 1 1 1 1 0 �� � 1 1 1 1 0 ��� → ��1 1 1 0 1 � 0 0 0 1 0 � ⋮ ⋮ ⋮ ⋮ ⋮ � 0 0 1 0 0 � 0 0 0 0 1
0 0 0 0 0 0 0 0 0 0 0 0 0 0 0 ⋮ 0 0
0 1� 0� � 0� 0� 0� 0� 0� 0���� ⋯ 0 ⋯ 0 ⋯ 0 ⋯ 0 ⋯ 0 ⋯ 0 ⋱ 0 ⋯ 0 ⋯ 0
0 � 1� � 0� � 0 � 0������ � 0 � 0 � 0 � 0 ����.
next, the estimated number of rows ��� subsets �����, and the number of columns is found in similar fashion as above in that ��� is the value of �� such that �� ���� , �� � � �� ; for example, UNLV Gaming Research & Review Journal ♦ Volume 16 Issue 1
27
8
1 �1 � �1 �1 �1
1 1 1 1 1
1 1 1 1 1
1 1 1 1 0
1 1 0 0 1
0 0 0 0 0 1 � 1 �� → ��1 � 1 ��1
⋯ ⋯ ⋯ ⋯ ⋯ 1 1 1 1 1
0 0 0 0 0 1 1 1 1 1
0 1� � ��� 0� 0� 0������ 1 1 1 1� 1 0� 1 0 0 1��������
0 0 0 0 0
⋯ ⋯ ⋯ ⋯ ⋯
0 0 0 0 0
0 � 1 � 0� 0� 0� � �
� ��.
Finally, the actual data indexed by the parenthesis in the far right bracketed matrix of the original sorted data matrix ���� is used for clustering; again we denote this matrix as �. For example, assuming the matrix indexes the same sorted data values in the example used to describe the sorting algorithm in appendix Section 7.1, the data matrix for clustering is 1 �1 � �1 �1 �1
1 1 1 1 1 1 1 1 1 1 1 1 1 1 0 200.03 �400.56 � � � � 20.17 �333.65 � 50.54
1 1� � → 0� 0� 1�������� 111.12 160.21 21.56 105.65 140.65 191.25 241.28 90.65 � � 12.65 170.26 222.87 0 � 137 180.64 124.34 0 � 155.26 205.64 0 100.26�.
naturally, other sparsity indexes involving the �� matrices can be constructed to find appropriate row and column cutoff values, which illustrates the usefulness of this technique. as previously discussed, using the sparsity index (3), values of �� and �� closer to result in the smallest number of rows and largest number of columns being selected. For the casino datasets there are an extremely large amount of rows, or customers, so �� closer to 1 results in a larger reduction in the number of customers. However, the columns have less dimension and are composed of the slot machines, which are of strong interest, so including more columns seems reasonable. these values of �� and �� generate datasets that produce distinctive clusters for the datasets studied below. in practice, and dependent on the particular dataset being analyzed, different values can be used to create various sizes of dimension reduced datasets. note that, we are assuming the original data matrices are of high dimension, for example the size of the first casino dataset analyzed in Section 4 is on the order of � � 200� 000 � � � 500. in addition to sorting such a large dataset, we also need to calculate the �� matrices for the sparsity index, which is computationally intensive assuming the given high dimensional scenario. to this end, efficient codes have been developed in MatLaB for
28
UNLV Gaming Research & Review Journal ♦ Volume 16 Issue 1
9 all calculations. 3. Data source a Las Vegas hotel casino corporation provided secondary data from two of their repeater market properties. as is the case with almost all Las Vegas repeater market properties, this casino’s primary revenue is generated by slot machines. in order to protect the confidentiality of the data source, the name of the property and the exact dimensionality of the datasets are not reported. Both of the datasets consist of coin-in from � different slot machines for � carded customers, i.e., from players who use their reward cards. the datasets consist of � rows of carded customers, and � columns of slot machines. Both datasets were first normalized by converting the coin-in values to the percentage of coin-in per player. the dimension of the first dataset analyzed in Section 4 is on the order of � � ���, ��� � � � ���. the second dataset was smaller, with dimensions around � � ��, ��� � � � ��. 4. Casino player dataset 1
compounding the large dimensions in this dataset is that most of the � carded players play at most only a few slot machines, thus, the percentage of entries is 96.6%. the method detailed in Section 2 is used to find non-sparse datasets more appropriate for clustering in Section 4.1. in Section 4.2 a cluster analysis is performed and the final results discussed in Section 4.3. 4.1 Dimension reduced datasets to reduce the dimension of the dataset to find interpretable and informative clusters of casino players and the machines they play, the number of rows and columns ���� , ��� � of the resorted dataset is obtained using the method described in Section 2.2 for various values of the pair ��� , �� �. Specifically, the following values are used: ��� , �� � � ���, �.9��� ��.99, �.96�� ��.9�, �.9���. in particular, for this dataset the non-sparsity, or density of nonzero values, was dispersed across all the � � ��� columns. thus, the transition to a large amount of zero entries in the upper right quadrant of the sorted data matrix is more gradual. this in turn also resulted in a larger number of rows being included that showed this trend across increasing columns. So, choosing a value of �� very close to 1 seemed the most probable value to produce a significantly row reduced dataset likely to provide meaningful results when clustered. now, choosing �� close to has the effect of including a large amount of columns, or machines, which is naturally deemed important. that is, we want to exclude only the machines that had the most minimal amount of play, and thus, likely to have a negative effect on the clustering results. these particular values of the parameters ��� , �� � yielded the following estimated row and column values: ���� , ��� � � �����, ��6�� �6��, ��6�� ����, �6���. that is, these values create dimension reduced data matrices, � , of size �� � ���, � � ��6�, �� � 6��, � � ��6�, and �� � ���, � � �6��. in addition, the values ���� , ��� � � ������, ����� ������, ����� ������, ����� were also included in the analysis for comparison. these row and column values are chosen to exceed UNLV Gaming Research & Review Journal ♦ Volume 16 Issue 1
29
10 the themaximum maximum of of thethe estimated estimated values values in order in order to compare to compare the results theinresults in analyzing analyzingthethe reduced reduced dimensioned dimensioned datasets datasets to onestoremotely ones remotely comparable comparable to to the thefull fulldataset. dataset.note note thatthat the last the dataset last dataset is roughly is roughly one quarter one quarter the size the of the size of the original originaldata data matrix. matrix. in subsequent in subsequent discussion discussion of the of analysis, the analysis, each of these each of these � � � datasets datasetsare aredenoted denoted� � � ��� ���� � ���� � ���in� �� order in order of introduction, of introduction, i.e. � is i.e.of � � is of dimension dimension��� ��� � ���, � ���, �� of ��dimension of dimension ��� ���� ���,� and ���,so and on. so on. 4.2 4.2Cluster Clusteranalysis analysis
For Foreach eachofofthethe sixsix dimension dimension reduced reduced datasets datasets of Section of Section 4.1 a �-means 4.1 a �-means cluster clusteranalysis, analysis,� �� �� ����� �, � �is�,performed. is performed. For each Fordataset each dataset the standard the standard deviations deviationsofof allall of of thethe � variables � variables werewere similar, similar, and thus, andthe thus, cluster theanalysis cluster analysis was wasperformed performed onon thethe rawraw datadata values. values. Specifically, Specifically, the dissimilarities the dissimilarities between betweeneach each group group areare calculated calculated usingusing the centroid the centroid method.method. the squared the squared distance, Euclidean Euclideandistance distance between between the centroids the centroids of each ofgroup, each group, or the Lor the L� distance, � often oftentermed termed thethe “city “city block" block" distance, distance, is used is in used the in �-means the �-means procedure procedure implemented implemented in in MatLaB. MatLaB. the the centroid centroid method method was chosen was chosen since, like since, the like the “nearest “nearestneighbor" neighbor" andand “group “group average" average" methods, methods, this leads thistoleads “spherical" to “spherical" clusters clustersexhibiting exhibiting high high internal internal affinity, affinity, Krzanowski Krzanowski (2001).(2001). this method this ismethod is also alsosuggested suggested byby MacQueen MacQueen (1967), (1967), with awith full adescription full description found infound the in the classic classicmultivariate multivariate texttext by Johnson by Johnson & Wichern & Wichern (2002).(2002). Letting Letting�� represent represent the the matrix matrix of within-cluster of within-cluster variation, variation, and � the and matrix � the matrix of ofbetween-cluster between-cluster variation, variation, a reasonable a reasonable method method to decide to decide betweenbetween the most the most appropriate appropriatenumber number of clusters of clusters is toischoose to choose the one thesuch onethat such thethat betweenthe betweencluster clustervariability variability relative relative to the to within-cluster the within-cluster variability variability is maximum. is maximum. a a relevant relevantmeasure measure of of thisthis ratioratio of variability of variability is the is trace theoftrace � �of����� � ������� � ���� �������� ����� ����� �� ����. ����. table table 1 gives 1 gives the values the values of thisof sample this sample trace fortrace each for each of ofthe thesix sixdatasets datasets andand eacheach of the of �the �� �� � ��� � clusters. � � � clusters.
Table1.1. Value Value trace - Example 4 Table of of thethe trace (�) (�) - Example 4 and and ���the trace trace is maximum is maximum whenwhen � � �,� and � �, excluding and excluding �� , �� , For�� For �� � the second secondlargest largest forfor thethe remaining remaining datasets. datasets. therefore, therefore, we conclude we conclude for the first for the first datasetsthat that either cluster analysis theoptimal, most optimal, datasets either a aor orcluster analysis is the is most and a and a clustersanalysis analysis dataset be best. clusters forfor thethe lastlast dataset may may be best. � � are �are � ��variables, � � variables, and thus, and nothus, directno direct However, dataset However, forfor anyany dataset � there � there way waytotovisualize visualize thethe differences differences between between the groups. the groups. in orderintoorder view to theview the clusters, clusters,and and draw draw inferences inferences visually, visually, we must we project must project them into them a subspace into a subspace of of . that is,need we need and approximate the grouped �dimension dimensionless less than than. that is, we to tryto andtryapproximate the grouped �dimensional points a lower dimension, if possible. to do this, dimensional points in ainlower dimension, if possible. to do this, since wesince we havemore morereasonably reasonably dimensioned datasets, we perform a canonical have dimensioned datasets, we perform a canonical Variate Variate
30
UNLV Gaming Research & Review Journal ♦ Volume 16 Issue 1
10
11 analysis (cVa), obtained from a Multivariate analysis of Variance (ManoVa), on the scatter matrix ��� �. the 1�� eigen-vector �� of ��� � projects the data into a one-dimensional subspace such that the between-group variability is maximum relative to within-group variability. More simply, the data is projected into a one-dimensional subspace that maximizes the separation between groups. the projections, or linear combinations, of the �dimensional data points are termed the canonical variates hereafter. the associated eigen-value, �� , gives the measure of the ratio of the betweengroup and within group variance. analogous to Pca, the eigenvectors �� , �� , � �� , � � �����, �� project the data into subspaces such that the between-group variability is the 2�� , 3�� , � , � �� greatest relative to withingroup variability. Mathematical details are summarized in Section 2 of the appendix; comprehensive details can be found in Krzanowski (2001). 4.3 Results Scatter plots of the 1�� versus the 2�� canonical variates for all datasets indicated that tight and distinctive groupings occur when � � 3 or ; scatter plots for three clusters are given in Figure 2. Based on this observation, and that the maximum values of the traces in Section 4.2 usually occur at or near � � 3, the results for three clusters are discussed hereafter. the upper most left panel of Figure 2 indicates that the most separated, or strongest, clustering occurs for �� . the plots in the next two upper panels corresponding to � � and � � show that the clusters become less separated as the number of rows are increased and the number of columns decreased. in fact, as the number of rows increases the projected clusters become less discernible from each other, which indicates that only a subset of this dataset can be grouped into strong distinct clusters; or that only these clusters of � dimensional points can be approximated in two dimensions. in addition, the separation between the groups for each of the datasets is along both the 1�� (�) and 2�� (�) canonical axes. Figure 3 gives the histogram plots of the coefficients of the eigenvectors, or loadings, corresponding to the 1�� canonical variates for all datasets. Most coefficient values are near zero with the exception of a few. thus, especially for the first two datasets, �� and �� , only a few select machines explain the greatest between group variation. For example, in the histogram plots of the loadings for dataset � � in the top left panel of Figure 3 the six largest values greater than 100 correspond to machines(loading); ������������� , ������������� , ������������� , ������������ , and ������������ , ������������ , ����������� , and �������������� . thus, the 1�� canonical variate is a contrast between the slot machines ���� , ���� , ���� , ��� and ���� , ���� , ��� , ���� , with the strongest contrast between ���� and ���� , ��� , ���� . For example, the 1�� canonical variate might distinguish players of wide area progressive machines from non-players, that is, wide area progressive players and non-players are the most distinguishable. the 2�� canonical variate results are: ����������� , ����������� , ���������� , ����������� and ������������ , ������������ , ������������ , again, analogous to the 1�� canonical variate, is largely a contrast between just a few slot machines. UNLV Gaming Research & Review Journal ♦ Volume 16 Issue 1
31
12 although the actual machines that arethat given is important although the actual machines area certain given aweight certain weight istoimportant to thethe casino, for the of illustrating our method is lessthis relevant. casino, forpurpose the purpose of illustrating our this method is less relevant. this example shows the usefulness of our technique in determining a dataset a dataset this example shows the usefulness of our technique in determining more suitable for clustering. Performing a cVa isa necessary since the since the more suitable for clustering. Performing cVa is necessary dimensions are high, and allows us to make as to whatas aretothe dimensions are high, and allows us toinferences make inferences what are the characteristics, or types of machines, that separate casino slotcasino playersslot the players the characteristics, or types of machines, that separate most. also, further iterations of our of method did not yield strong results and results and most. also, further iterations our method did not yield strong thus have beenbeen omitted for brevity. thus have omitted for brevity.
܌ܖ ܌ܖ Figure 2. 2. ܜܛvs. Figure ܜܛvs. canonical canonical variatevariate plots forplots ൌ for clusters ൌ - Casino clusters - Casino data data Example Example 4 4
32
UNLV Gaming Research & Review Journal ♦ Volume 16 Issue 1
12
13
�� canonical coefficients coefficients (loadings) (loadings) for � � for � clusters � � �- clusters Casino - Casino Figure Figure3. 3.����canonical data dataExample Example 4 4
5.5. Casino Casino Player Player Dataset Dataset 2 2
ininthis thisdataset, dataset, 10% 10% of the ofcarded the carded playersplayers played played only oneonly slot machine, one slotso machine, so these theseplayers players were were put put in one in cluster one cluster that wethat willwe refer will to as refer "loyal to customers" as "loyal customers" and andthen then removed removed fromfrom the dataset. the dataset. the steps theused steps to analyze used tothe analyze previous the previous casino casinoplayer player tracking tracking dataset dataset are then arerepeated then repeated on the dataset on theconsisting dataset consisting of the of the remaining remaining players. players. 5.1 5.1Dimension Dimension reduced reduced dataset dataset For Forthe thesame same reasons reasons discussed discussed in thein previous the previous exampleexample the following the following sequence sequence of of values values to subset to subset the dataset the dataset are used: are used: ����� �� �� ���� � �� ��1���1� 0����� 0����� �0���� �0���� 0�����0����� �0�����0���� 0�����.0�����. these values these create values create � � dimension dimension reduced reduced datasets, datasets, , of size , of��size � 10���� �� � 10���� � � ���,��������, �� � 1�0��� 1�0��� �� �� ���, ���, andand �� ���1����� � 1����� � � 1��. � �in1��. addition, in addition, the valuesthe values � � � � ���000� ���000� �� �������� ��000� ��000� ���� were ����also were included also included in the analysis in theforanalysis for �� ��� ���� ����� comparison. comparison.these these rowrow and column and column valuesvalues are chosen are to chosen exceedtotheexceed the maximum maximum number number of columns of columns and the and minimum the minimum number number of playersofin players order to in order to contrast contrastthethe analysis analysis results results from from the dimension the dimension reduced reduced datasets. datasets. in in � � subsequent subsequent discussion discussion eacheach of theofdatasets the datasets are denoted are denoted �in�1� the� � �� in the � � � � �1� � � � ���� order orderofofintroduction. introduction. 5.2 5.2Cluster Cluster analysis analysis
�� , a��-means cluster analysis, cluster analysis, � � �� � � �, � �is �� � � �, is For Foreach each of of thethe fivefive datasets, datasets, � , a �-means performed. performed.ForFor eacheach dataset dataset the standard the standard deviations deviations of all of the of all � variables of the � variables UNLV Gaming Research & Review Journal ♦ Volume 16 Issue 1
33
13
14 were similar, the cluster was performed on theraw data were similar, and and thus,thus, the cluster analysisanalysis was performed on theraw data values. before, differences groups are calculated values. as as before, differences betweenbetween groups are calculated using the using the centroid method implementing theblock" “citydistance. block" distance. to aid in centroid method implementing the “city once more,once to aid more, in deciding appropriate numbers of clusters, table givesofthe values of deciding the the mostmost appropriate numbers of clusters, table 2 gives the 2values sample � �1��� thethe sample tracetrace of �of� � �1��� � ����������� �1��� �� � �1��� 1��� for�each 1��� of for the five each of the five � � the trace is maximum trace is maximum when � � �,when � � �, datasets datasets andand � ��2,� � ,2,6 � clusters. , 6 clusters. For � For � the while while � �� 2�produces 2 produces the largest the largest trace fortrace the remaining for the remaining datasets. datasets.
Table Value the trace (�) - Example 5 Table 2. 2. Value of theoftrace (�) - Example 5 Results 5.35.3 Results again, in order to draw inferences the �-means cluster again, in order to draw inferences from thefrom �-means cluster analysis we analysis we �� �� perform a cVa �obtained � � obtained from a ManoVa from a ManoVa on each dataset. on each Fordataset. all For all perform a cVa on �on �� datasets datasets plots plots of the of1the 1�� versus versus the 2��the canonical 2�� canonical variates indicated variatesthat indicated the that the tightest tightest andand mostmost distinct distinct groupings groupings occur foroccur � � 2for and� �clusters. 2 and the clusters. the scatter scatter plots plots for two for and twothree and clusters three clusters are givenare Figures given4 Figures and 6, respectively. 4 and 6, respectively. recalling recalling thatthat the maximum the maximum value of value the traces of the in traces Sectionin5.2Section occur almost 5.2 occur almost exclusively exclusively when when � � 2, �� the2,results the results for two and for two threeand clusters three areclusters discussedare discussed hereafter. hereafter. canonical plots of the loadings the 1�� canonical ForFor � ��2�histogram 2 histogram plots of the loadings associatedassociated with the 1��with variates variates for for all datasets all datasets are given are in given Figure in 5Figure and show 5 and that show two groups that two are groups are �� �� �� �� (�) axis,(�)butaxis, not the2 but not (�)the2 axis. the (�)most axis. the most separated separated along along the 1thecanonical 1 canonical interesting interesting groupings groupings occuroccur for datasets for datasets �� and ����, and where�the , loadings where the of the loadings of the � coefficients coefficients contrast contrast half ofhalf the of � �the ���machines. � �� machines. that is, looking that is, at the looking at the middle middle andand rightright upperupper panelspanels of Figure of 5Figure we see5that wepositive see thatandpositive negativeand negative loadings loadings are are closeclose in value in value and nearly and evenly nearlydispersed evenly dispersed across the slot across the slot machines. machines. thus, thus, the two theclusters two clusters of casino ofplayers casinofor players this dataset for this are most dataset are most separated separated by whether by whether they play theya play machine a machine associatedassociated with a negative with ora negative or �� coefficient vector. vector. this grouping this of grouping positive and of positive and positive positive loading loading in thein1the 1�� coefficient negative negative weights weights that separate that separate the twothe groups twoalso groups seemsalso to apply seems to to theapply to the � � , with � � ,thewith exception the exception that many that of themany machines of the machines dimension dimension reduced reduced dataset dataset consists consists � � �� of machines, � � �� machines, areare given given weights weights near near zero. zero. note that, note��that, �� of � � are � �comprised � � �and are comprised of � � of �� �and �16 ��machines, and 16 machines, respectively.respectively. while while � and ForFor � ����clusters � clusters a similar a similar result toresult that oftothe that � �of2the clusters � �for 2 clusters �� for �� � � � � � � , � �and . the �canonical . the canonical variate plots variate are given plots in are given in occurs occurs for for datasets datasets � , ��and canonical variates invariates Figure 7.inthe Figure top 7. the top Figure Figure 6 and 6 and the loadings the loadings of the of 1��the 1�� canonical upper upper panel panel of Figure of Figure 7 corresponding 7 corresponding to the first to 3the reduced first 3datasets reduced shows datasets shows that that there there are are threethree groups groups of machines of machines that separate that the separate three clusters the three the clusters the most; most; machines machines with with a largea negative large negative weight, weight, machinesmachines with a largewith positive a large positive weight, weight, andand thosethose weighted weighted less (close lessto(close zero).to zero). toto complete complete the clustering the clustering of the this of the casino thisPlayer casino tracking Playerdata, tracking the data, the
34
UNLV Gaming Research & Review Journal ♦ Volume 16 Issue 1
14
15 observations in in thethe six six dimension reduced datasets are again from the from the observations dimension reduced datasets areremoved again removed original andand thethe above stepssteps carried out onout the on resulting dataset; the originaldata data above carried the resulting dataset; the results notnot show anyany strong groupings and thus, been omitted resultsdid did show strong groupings andhave thus, have been for omitted for brevity. brevity.
UNLV Gaming Research & Review Journal ♦ Volume 16 Issue 1
35
15
16 ܜܛ ܌ܖ Figure 4. 4.ܜܛvs. Figure vs. ܌ܖcanonical canonical variate variate plots for plots ൌfor clusters ൌ clusters - Casino - Casino data data Example Example 5 5
36
UNLV Gaming Research & Review Journal ♦ Volume 16 Issue 1
16
17 ܜܛ Figure canonical coefficients coefficients (loadings) (loadings) for ൌfor clusters ൌ -clusters Casino - Casino Figure 5. 5.ܜܛcanonical data dataExample Example 5 5
UNLV Gaming Research & Review Journal ♦ Volume 16 Issue 1
37
17
18 ܌ܖ ܌ܖ ܜܛ Figure Figure 6. 6. ܜܛvs. vs. canonical canonical variatevariate plots forplots ൌ for clusters ൌ - clusters Casino - Casino data data Example Example 5 5
ܜܛ canonical coefficients coefficients (loadings) (loadings) for ൌ for clusters ൌ - Casino clusters - Casino Figure Figure 7. 7. ܜܛcanonical data data Example Example 5 5
6.6.Discussion Discussion
ininthis this article, article, we introduce we introduce a technique a technique for clustering for clustering large and large sparseand casino sparse casino player player tracking tracking datasets. datasets. one common one common problemproblem in clustering in clustering such datasets such is datasets is that thatdata data reduction reduction methods methods on theon fullthe dataset, full dataset, for example for example Pca, typically Pca,dotypically do not notresult result in ainnoticeable a noticeable dimension dimension reduction reduction and hence, andinhence, interpretable in interpretable clusters. clusters.However, However, our clustering our clustering methodmethod for suchfor datasets such finds datasets subsets finds of the subsets of the original original data data withwith a large a large percentage percentage of non-zero of non-zero entries which entries are which more are more suitable suitable forfor the the implementation implementation of standard of standard clustering clustering techniques. techniques. that is, ourthat is, our method method extracts extracts dimension dimension reduced reduced datasetsdatasets from thefrom original thedataset original so that dataset so that appropriate appropriate clustering clustering techniques techniques can becan selected be selected from the from vast amount the vast already amount already contained contained in the in the literature. literature. Both Both casino casino datasets datasets were were of substantially of substantially differentdifferent dimensions, dimensions, but for but for each, each, ourour method method was was able able to extract to extract non-sparse non-sparse subsets ofsubsets the dataofofthe suitable data of suitable dimensions dimensions to be to clustered. be clustered. to subset to subset both datasets both datasets we used values we used of ሺܿvalues ଵ ǡ ܿଶ ሻ of ሺܿଵ ǡ ܿଶ ሻ sosothat that a larger a larger proportion proportion of slotofmachines slot machines (columns) (columns) would be would selectedbe at selected at each eachiteration. iteration. thethe initial initial reduced reduced datasetsdatasets producedproduced under thisunder this parameterization parameterization for the forfirst the casino first casino transaction transaction data example data enabled example theenabled the classical classical ݇-means ݇-means clustering clustering procedure procedure to recover to recover three strong three clusters. strongaclusters. a canonical canonical Variate Variate analysis analysis was then wasable then to able identify to identify a contrastaofcontrast a few slotof a few slot
38
UNLV Gaming Research & Review Journal ♦ Volume 16 Issue 1
18
19
Thus, these reasons, and the intuitive nature of our method, makes our procedure for clustering sparse high dimensional datasets attractive to general practitioners and gaming operators. For example, this approach can be used to cluster slot machine games based upon features such as free spin and bonus games, slot denomination, maximum number of lines, scatter and wild symbols, with a view to determine what features are associated with high coin-in values.
machines that maximized the separation between these groups. the second less sparse casino dataset produced somewhat less distinct clusters, but segmented a larger number of customers. in contrast to the first dataset, the cVa analysis determined that a contrast involving most of the machines separated the groups. although the main goal was to segment casino player transaction datasets, the procedure is adaptable to sparse datasets of different types with large dimension that need to be segmented using classical clustering techniques that might otherwise be inappropriate. our sparsity index is also flexible in that it can be parameterized to select more or less columns, or rows, dependent on the problem. thus, these reasons, and the intuitive nature of our method, makes our procedure for clustering sparse high dimensional datasets attractive to general practitioners and gaming operators. For example, this approach can be used to cluster slot machine games based upon features such as free spin and bonus games, slot denomination, maximum number of lines, scatter and wild symbols, with a view to determine what features are associated with high coin-in values. Most of the above features are binary in nature, and therefore a large dataset of coin-in values of various slot games with a binary column for each of the above features would be a sparse data matrix. the clustering of slot games based on such a dataset would identify the features of popular slot machines.
UNLV Gaming Research & Review Journal ♦ Volume 16 Issue 1
39
20 References Andritsos, P.,P., Tsaparas, P., Miller, RJ. & Sevcik, KC. (2004). Kc. Limbo: scalableLimbo: andritsos, tsaparas, P., Miller, rJ. & Sevcik, (2004). clustering of categorical data. Proceedings of international conference on scalable clustering of categorical data. Proceedings of international extending database technology, 123 146. conference on extending database technology, 123 146. Barbara, D., Li, Li, Y. &Y. Couto J. (2002). Coolcat: an entropy-based algorithm for Barbara, D., & couto J. (2002). coolcat: an entropy-based categorical clustering. Proceedings of ACM conference on information andon algorithm for categorical clustering. Proceedings of ACM conference knowledge management, 582 589. information and knowledge management, 582 589. Berman, B.B. (2006). Developing an Effective Customer Loyalty Program. Berman, (2006). Developing an Effective customer Loyalty California Program. Management Review, 49, 123. 49, 123. California Management Review, chen K,&&LiuLiu L (2005) for entropy-based categorical Chen K, L (2005) The the “best“best k” fork” entropy-based categorical clustering. clustering. Proceedings of international conference onstatistical scientificdatabase and Proceedings of international conference on scientific and management, 253 management, 262. statistical database 253 262. ganti, gehrke, & ramakrishnan, (1999). cactus: clustering Ganti, V.,V., Gehrke, J., &J., Ramakrishnan, R. (1999).r.Cactus: clustering categorical data categorical data using summaries. Proceedings of ACM SIGKDD using summaries. Proceedings of ACM SIGKDD international conference on international ondata knowledge discovery and data mining, 73 83. knowledge conference discovery and mining, 73 83. gibson D., Kleinberg J. , & raghavan, P. (1998). categorical Gibson D., Kleinberg J. , & Raghavan, P. (1998). Clusteringclustering categorical data: an data:approach an approach on dynamical Proceedings of the 24th based based on dynamical systems. systems. Proceedings of the 24th international international very large conferenceconference on very largeon data bases, 311data 322.bases, 311 322. guha S., rastogi r., & Shim, K. (1999). rock: a robust clustering Guha S., Rastogi R., & Shim, K. (1999). Rock: a robust clustering algorithm for algorithm for categorical attributes. Proceedings of IEEE international categorical attributes. Proceedings of IEEE international conference on data conference on data engineering, pp 512 521. engineering, pp 512 521. Huang Z (1998) . Extensions to the k-means algorithm for clustering large Huang Z (1998) . Extensions to the k-means algorithm for clustering large data sets datawith setscategorical with categorical values. Data Mining and Knowledge Discovery values. Data Mining and Knowledge Discovery 2(3), 283 304. 2(3), 283 304. Hyvärinen, A.,a., Karhunen, J., & Oja, E.oja, (2001). Component Analysis. New Hyvärinen, Karhunen, J., & E.Independent (2001). independent component York: John Wiley & Sons, Inc. analysis. new York: John Wiley & Sons, inc. Johnson, R.A., & Wichern, D.W. D.W. (2002). (2002). Applied Multivariate Statistical Analysis. Johnson, r.a., & Wichern, applied Multivariate Statistical Upper Saddle River, New Jersey: Prentice Hall. analysis. Upper Saddle river, new Jersey: Prentice Hall. Krzanowski, J. (2001). Principles of Multivariate analysis: a User’s Krzanowski, W.W. J. (2001). Principles of Multivariate Analysis: A User’s Perspective. Oxford Statistical Series, No. 23.Series, no. 23. Perspective. oxfordScience Statistical Science Li t,, ,Ma Ma & ogihara, M. (2004). Entropy-based in clustering. categorical Li T, S. S. & Ogihara, M. (2004). Entropy-based criterion incriterion categorical clustering. In: Proceedings of international on machine In: Proceedings of international conference onconference machine learning, 68 75. learning, 68 75. MacQueen, J.B. (1967). Some Methods for Classification and Analysis of Multivariate MacQueen, J.B. Proceedings (1967). Some for Symposium classification and analysis of Observations. of theMethods 5th Berkeley on Mathematical �� Symposium Multivariate observations. the 5 Berkeley Statistics and Probability, 1,Proceedings Berkley, CA:of University of California Press, 281on 97. Mathematical Statistics and Probability, 1, Berkley, ca: University of Stone, J.V. (2004). Independent Component Analysis: A Tutorial Introduction. california Press, 281 97. Cambridge, MA:. A Bradford Book. MIT Press. Stone, J.V. (2004). independent component analysis: a tutorial Yan, H., Chen, cambridge, K., Liu, L. & Yi, Z. (2010). SCALE: a scalable introduction. Ma:. a Bradford Book. Mitframework Press. for efficiently clustering transactional data. Data Mining and Knowledge Discovery, Yan, H., chen, K., Liu, L. & Yi, Z. (2010). ScaLE: a scalable 20, 1-27. framework for efficiently clustering transactional data. Data Mining and Knowledge Discovery, 20, 1�27.
40
UNLV Gaming Research & Review Journal ♦ Volume 16 Issue 1
21 Appendix A Data matrix sort example a simple example of the algorithm for the sort described in Section 2.1 is illustrated for a small dimensioned, non-sparse, data matrix. the less sparse example is used for ease in exposition and highlights more clearly the results of the sort. row and column interchanges are recorded in parenthesis to the far right. First, create the indicator matrix ���� of the data matrix �,
200.03 105.65 111.12 160.21 21.56 � 20.17 0 12.65 170.26 222.87� � � � � �333.65 0 137 180.64 124.34� → �400.56 90.65 140.65 191.25 241.28� � 50.54 100.26 155.26 205.64 0 � 1 1 1 1 1 row 1 �1 0 1 1 1� row 2 � � �� ���� � �1 0 1 1 1� �row 3� �1 1 1 1 1� row 4 �1 1 1 1 0� �row 5�
then, counting cumulatively by column the nonzero entries in each row, and sorting by the final column (in bold), yields
1 �1 � �1 �1 �1
2 1 1 2 2
3 2 2 3 3 1 �1 � → �1 �1 �1
4 3 3 4 4 2 2 1 1 2
� �� � �� �� �� 3 4 3 4 2 3 2 3 3 4
1 � �1 �� � � �� → �1 �1 �� �1 ��
1 1 0 0 1
1 1 1 1 1
1 1 1 1 1
1 row 1 1� �row 4� � 1� �row 2� 1� row 3 0� �row 5�.
4 4 4 4 2
1 � �1 �� � � �� → �1 �1 �� �1 ��
So far, row 4 has been moved to row position 2, with the remaining rows following in chronological order. next, we repeat the above sort based on the columns using the transpose of the resultant row sorted indicator matrix above (far right matrix) 1 �1 � �1 �1 �1
1 1 1 1 1
1 0 1 1 1
1 0 1 1 1
1 1 �1 1� � � 1� → �1 �1 1� �1 0�
2 2 2 2 2
3 3 3 3 2
1 1 1 1 1
1 1 1 1 0
1 1 1 1 0
1 col 1 1� �col 3� � 1� �col 4� 0� col 5 1� �col 2�.
UNLV Gaming Research & Review Journal ♦ Volume 16 Issue 1
41
22 Here, column (row) 2 is moved to the last position, and column (row) 5 to the next to last position; the remaining columns follow in chronological order in the top three positions. transposing and translating back to the original values of the data matrix gives the final sorted data matrix ���� , 1 1 1 1 1 �1 1 1 1 1� � � ����� � �1 1 1 1 0� �1 1 1 1 0� �1 1 1 0 1� 200.03 111.12 160.21 21.56 105.65 �400.56 140.65 191.25 241.28 90.65 � � � � ���� � � 20.17 12.65 170.26 222.87 0 � �333.65 137 180.64 124.34 0 � � 50.54 155.26 205.64 0 100.26�. note that, we are not taking into account the actual value of the entries of the data matrix D. We could however do so easily by placing some sort of rank on each value. the most basic of which would be to assign each entry its actual ranked value. that is, for D above we could write ���� as, 200.03 105.65 111.12 160.21 21.56 � 20.17 0 12.65 170.26 222.87� � � D= �333.65 0 137 180.64 124.34� � ���� � �400.56 90.65 140.65 191.25 241.28� � 50.54 100.26 155.26 205.64 0 � 17 7 8 13 3 � 2 0 1 14 18� � � �21 0 10 15 9 �, �22 5 11 16 20� � 4 6 12 18 0 � and proceed as before by summing over the rows and sorting by the last column.
42
UNLV Gaming Research & Review Journal ♦ Volume 16 Issue 1
23 Appendix B Canonical Variate Analysis (CVA) the following is a summary of cVa on grouped, or clustered data, described in Krzanowski [13]. Suppose ��� � � � 1� � � �� denotes a sample from the random vector � � ��� � � � �� �� . Let � denote the number of groups within the sample and �� � � � �1� � � ���� the number of observations in each group. the within group covariance matrix �, the multivariate analogue of the univariate within sum of squares divided by the degrees of freedom, and similarly, the between group covariance matrix � are defined as �
��
1 � �� ��� � �̄ ����� � �̄ �� ������ �� �� � �� ��� ���
�
1 � � �� ��̄ � � �̄ ���̄ � �̄ �� . �� � 1� ���
Maximizing � � �� ����� ��, with respect to the vector ���� , is after differentiation, equivalent to solving for the vector � such that �� � ��� � 0. this is equivalent to solving the following, �� � ���� � 0, ���� � � ���� � 0, or ���� ��� � ��. that is, ��� � � �� are an eigen-pair for the matrix ��� �. Since � measures the ratio between group and within variation, larger values correspond to a larger separation between clusters. Hence, after the appropriate change in interpretation, this is directly comparable to performing Pca on ��� � instead of the covariance matrix.
UNLV Gaming Research & Review Journal ♦ Volume 16 Issue 1
43
44
UNLV Gaming Research & Review Journal ♦ Volume 16 Issue 1