Malaysian Journal of Computer Science, Vol. 19(2), 2006. 105. CLUSTERING OF CPU USAGE DATA IN GRID ENVIRONMENT. USING EVOC ALGORITHM.
CLUSTERING OF CPU USAGE DATA IN GRID ENVIRONMENT USING EVOC ALGORITHM Chan Huah Yong, Kee Sim Ee, Fazilah Haron School of Computer Sciences Universiti Sains Malaysia, 11800 Penang, Malaysia. Email:{hychan, sharon, fazilah}@cs.usm.my ABSTRACT Clustering is a process of organizing objects into groups whose members are similar in some way. It is one of the data mining techniques is an unsupervised learning. In a grid environment, the number of computing nodes and users may reach up to thousands or millions. The grid is said to be dynamic in that the behaviors and values of these resources change all the time. Hence, these data are not suitable to be processed in an off-line mode. The existing clustering techniques today however emphasize more on the data’s behaviors categorization but not the data’s stability. Furthermore, the normal clustering techniques are more suitable to be used for static data type in an off-line mode. This paper addresses these issues by presenting an Evolving Clustering (Evoc Algorithm) which is an improved version of Evolving Clustering Method (ECM). We apply both methods on CPU usage to identify computers behaviors. The algorithm has been evaluated using three main criteria; that is dynamicity, accuracy and the ability to identify the stable cluster members. Our results show the improvements of the algorithm to process the data in an on-line mode in the evaluation of the algorithm’s dynamicity and accuracy criteria compare to other existing clustering techniques. Furthermore, the stability evaluation was a success where we were able to identify the stable cluster members from the filtered stable clusters. However, the result was highly affected by three factors namely threshold value, stability value and stability hour. Keywords: Clustering, Grid, Data Stability, Evolving Clustering (Evoc), Evolving Clustering Method (ECM)
1.0 INTRODUCTION Grid computing or simply grid is a generic term given to technologies designed to make pools of distributed computer resources available on-demand. It has become one of the latest buzzwords in the IT industry. Grid provides wide-spread, dynamic, flexible and coordinated sharing of geographically distributed heterogeneous networked resources, among dynamic user groups. It is an innovative approach that leverages existing IT infrastructure to optimize computer resources and manage data and computing workloads [1]. The number of computing nodes and users participating in the grid environment is in increase and may reach up to thousands or millions in a grid environment. The abundance of these resources forges new problems, such as how to collect the massive amounts of evolving resources in real time and extract the useful information from them. Furthermore, at a glance, these resources are not ordered, random and chaotic where normal user is not able to easily discover any knowledge or meaningful information from them. These resources will be useful if i)
Their implicit and underlying meaningful pattern can be extracted to form new knowledge for advanced usage,
ii)
The issues of dynamics and large amount of data are well processed in real time mode using dynamic clustering method.
In order to deal with these requirements, Evoc clustering is proposed as one of the best ways in terms of processing large set of raw data and turning these data into meaningful information. The improved version of Evolving Clustering Method is used because the nature of this resource problem is to group the similar behavior of usage pattern in the real time mode for studies. It is a discovery process that groups a set of data such that the intra-cluster similarity is maximized and the inter-cluster similarity is minimized [2]. This technique sorts through data to identify patterns and establish relationships.
105 Malaysian Journal of Computer Science, Vol. 19(2), 2006
Clustering of CPU Usage Data in Grid Environment using Evoc Algorithm pp. 105 - 116
By applying the Evoc algorithm in grid environments, the problem of processing massive amount of data in real time mode will be solved. Using these clustered data, we proposed a stability feature to identify the stable computers within a certain period of time which can give very useful information for the purpose of predicting and monitoring of resources.
2.0 MOTIVATIONS AND RELATED WORK The research in [3] concluded that unforeseen computer behavior in the systems is common. A.K. Jain considers those unexpected behavior as a “bug” or if it’s benign, it is called as a feature. However, the paper from [3] only describes the method to predict the computer behavior that it will behave within acceptable limits with the purpose of avoiding dramatic loss of life, property and money. This research is not related to our current research study. The research that has been done in [4] suggested the epochal behavior of CPU usage exist, long and significant. According to Peter A. Dinda, the load traces might seem at first glance to be random and unpredictable might be having the structure that can be exploited and the results suggested that load traces do indeed have some structure in the form of clearly identifiable properties. There is another research work [14] which discovers the grid resources usage patterns (CPU usage) using suffix tree method. This paper proposes to discover the CPU usage pattern from its historical usage data to better understand the CPU usage does show the behavior and thus its behavior for next level is believed can be predicted. Network Weather Service (NWS) [15] is one of the most popular resource prediction methods. NWS was developed for the use of schedule in a networked computational environment by using a series of forecasting methods to forecast a recourse performance and then choose the method that yields the lowest mean square error or lowest mean percentage error. CURE [5] and CHAMELEON [6] are two of the popular algorithm for hierarchical clustering technique. However, several problems are found in attempting apply these algorithm to grid resources. The major problem for this technique is it is a rigid method where it never revisits any cluster member once the clusters are constructed. Furthermore, the clustering process is a one-pass process where the data are clustered for once only without any continuously processing. This will cause the result’s accuracy affected. Apart from that, in certain situations the unrelated cluster members sometimes might join together as one cluster for the sake to get the clustering process done for all data. However, there are some good things in this technique as well. The hierarchical method better in handling any forms of similarity or distance and it is applicable to any attributes types. The advantage is suitable to be applied in grid resources but there are several arisen issues as mentioned in previous part that raise some arguments to their applicability in cluster the grid resources. Partitioning clustering is a process where it partitions the data into k clusters. Given a set of objects and a partition criterion, partition the objects into clusters based on the similarity that the objects have with each other to match the specified criterion. One of the popular algorithms for partitioning technique is PAM (Partitioning Around Medoids). The cost iteration for PAM algorithm proposed by Kaufman and Rousseeuw [7] is O (k (n-) 2) where its computationally is quite inefficient for large value of n and k; n is the number of data and k is number of clusters. According to the experimental result that was mentioned in [7], PAM works satisfactorily for small data sets only for around 100 objects in 5 clusters but does not work well for medium and large data sets. In grid environment provided with massive data which might reach until thousands of data, this algorithm for sure is not suitable as the value of n and k grows higher, the process will turn slow. Furthermore, since it is not scale well for large set of data especially grid resources, thus inaccuracy of clustering result might happen as well. CLARA (Clustering LARge Applications) algorithm which was proposed by Kaufman and Rousseeuw as well works better than PAM for large data sets but yet it is an off-line mode clustering. Thus, it is not in the consideration to become the chosen technique for our research work. CLARANS (Clustering Large Applications based upon RANdomized Search which combines PAM and CLARA algorithms) algorithm which was proposed by Ng and Han [8, 9] is better among two algorithms mentioned previously. Experimental results here shown to be more effective than both algorithms. However, same reason as CLARA, it does not perform the clustering process in real time mode which is not so suitable to be used for grid resources processing. For the k-nearest neighbor, the technique generally successful with the classifiers k=1. Just like the partitioning technique, the user needs to determine the value of parameter of K where k stands for the number of nearest neighbors to be taken into the consideration. Thus, it is not chosen by us to be applied on grid resources in our 106 Malaysian Journal of Computer Science, Vol. 19(2), 2006
Clustering of CPU Usage Data in Grid Environment using Evoc Algorithm pp. 105 - 116
research work as a very large value of k can destroy the locality of the estimation. This is due to farther examples might be taken into the consideration in the decision making which class that data sample belongs to which will cause the inaccuracy of clustered result. This method leads to a high cost of computation because the distance of each query instance to all training samples needs to be computed. Apart from the above reasons, the k-nearest neighbor is a supervised learning method and the grid resources that we will process are dynamic. We believe that the unsupervised method of clustering is more suitable to process the grid resources instead of supervised technique. Thus, k-nearest neighbor is not in our choice. The research in [10] proposed that cluster stability to be one of the criterions in determining the structure of the data. According to Jefferey, the cluster stability-method which was proposed by [11] is one of the methods in finding the optimal number of clusters. The technique samples a space of clustering for each choice of k, and uses a clustering similarity metric to generate a distribution of stability values. This distribution is then used to choose the most stable clustering. The author claimed that this method was used in their research work as it is an independent technique and furthermore does not make any assumptions as to cluster shape or density as some other methods do. The technique does not search for stable cluster members which are not related to our research mode. Furthermore, this technique only works with both hierarchical and partitioning clustering algorithms that do not work in on-line mode. Thus, it is not being chosen in our research work for the cluster members’ stability part.
3.0 EVOLVING CLUSTERING (EVOC ALGORITHM) OVERVIEW We have chosen Evolving Clustering Method (ECM) [12, 13] in our research work as the main clustering technique to be improved. It is one of the evolving clustering that can work partially in on-line mode to other off-line mode clustering techniques, for instance hierarchical and partitioning clustering. On-line mode means that the data streams keep on coming and changing, whereas off-line mode the data is well gather and won’t change for the single pass processing. The off-line mode techniques are not suitable for on-line mode processing because it would need multiple pass processing. ECM is more suitable to be used to process the grid resources due it its ability of process the evolving type data by maximizing the cluster size. However, the ECM algorithm only allows for the cluster size to increase in an on-line mode while decreasing cluster size in an off-line mode. We have incorporated the ECM with the following features: i) ii)
Ability to minimize the cluster radius size in an on-line mode Ability to identify the stable cluster members
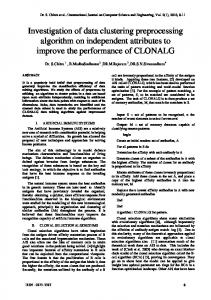
3.1 The Proposed Flow of Clustering Process in Grid Environment We divide the clustering process into two main stages. During the first stage, the system will collect the CPU usage data from all related computers. In average the data will be calculated at every hour to identify a data point which can be used as a cluster point during the clustering process. (Fig. 1) After the data has been collected, the data will be processed and clustered using the improved Evolving Clustering (Evoc Algorithm), Evolving Clustering Method (ECM). Clusters are generated according to their similar behaviors at every hour and these clusters will be used in the second part which is instance’s stability identification process. In order to identify the stable computer for a certain period of time, the stability feature will be used. Cluster size that changes less than 20% from the previous time, t-1 is regarded as a stable cluster. A stable computer node is only being considered as stable if it is belongs to a stable cluster. The purpose of this stage is to identify the stable cluster members which are computers in this case. We believe that this part is able to give a better and more accurate result of computers’ stable behavior.
107 Malaysian Journal of Computer Science, Vol. 19(2), 2006
Clustering of CPU Usage Data in Grid Environment using Evoc Algorithm pp. 105 - 116
Clustering Process
Data Collection
Data Processing using Evolving Clustering Method (ECM) Clusters of Computer nodes based on similar behavior
Identification of Stable Instance Using Stability
Different groups of computers with the similar behaviors Fig. 1: The Flow of Clustering Process in Grid Environment
3.2 Definition The concepts of our Evoc algorithm are defined as follows:
xi denotes the data from the input stream of grid resources, where i = 1,2,3,4… n of data
Ccjk denotes the cluster centre, where k = 1, 2, 3, 4… n number of items in the cluster and j = 1, 2, 3, 4… n number of clusters.
Cjk denotes the cluster, where k = 1, 2, 3, 4 … n number of items in the cluster and j = 1, 2, 3, 4 … number of clusters.
Rujk denotes the cluster radius, where k = 1, 2, 3, 4 … n number of items in the cluster and j = 1, 2, 3, 4 …n number of clusters.
R_t denotes the radius size for the previous period of time, t-1.
Rt denotes the radius size for current time, t. A data point represents a computer node.
Evoc algorithm can be divided into two main phases, where the first phase (section 3.3) place the data stream into the appropriate cluster and the second phase (section 3.4) calculates the clusters stability and provides the result of stable instance which is the stable computer node. 3.3 Clustering Process The basic principle of Evoc algorithm is that the process starts with an empty set of clusters. The cluster radius, Ru is initially set to 0 and the cluster centre, Cc is located when a new cluster is created. With the next coming in data, some existing clusters will be updated or some other actions will be taken on them. The cluster’s size may evolve in three different situations: i)
Update the cluster size by updating its cluster radius, Ru
108 Malaysian Journal of Computer Science, Vol. 19(2), 2006
Clustering of CPU Usage Data in Grid Environment using Evoc Algorithm pp. 105 - 116
ii)
Do nothing to the cluster size but a new member will be put in that cluster and,
iii)
When the data does not fit to any of the existing clusters; a new cluster will be created.
Some modifications have been made to ECM algorithm to suit the dynamicity of grid environment. We called the improved ECM algorithm as Evolving Clustering (Evoc). Evoc algorithm allows:
A more dynamic way of clustering for a longer period of time. The identification of stable cluster members from the generated clusters
Our proposed Evoc algorithm works both ways; shrink and enlarge the cluster size. Each new in coming data point will be checked whether there exist any duplicate in any of the existing cluster. If there is no duplicate, the data point will be placed in any of the existing cluster then only the clustering process can proceed. Otherwise, the data point has to be removed. For example, a previous computer node A_t exist in Cluster K, and thus when the following next point of computer node A comes in, the previous computer node A_t has to be removed from the cluster K and the re-clustering process will continue for the next point. Before removing the previous point A_t from the cluster, there are three conditions that need to be taken into consideration. A_t point needs to be determined whether it is the outermost point in that cluster.
If A_t is the outermost point for that cluster, check if the point A_t has the Extended Distance Value (Equation 3) If the point A_t has the Extended Distance Value, then the point will be removed, cluster size will be shrunk and the radius size will be calculated based on the following equation:
Ru j −1 = 2(s(i, j ) ) − d (i, j )
(1)
Else if the point A_t does not have the Extended Distance Value, then the point will be removed directly from the cluster without any changes to the value of the radius. If A_t is not the outermost point in the cluster, then this point can be removed from the cluster without affecting the cluster and the radius size.
After the point A_t has been removed from the cluster, the subsequent point A will go through the clustering process. However, if point A_t is not found in any of the existing cluster, the subsequent point A will proceed with the clustering process only, that is without removing any of the old instances from the clustering process. There is another situation where the A_t is removed from the cluster and A_t is the last member to be removed. In this case, the cluster radius size will become zero or it does not exist any longer. The clustering continues with the next data point in the data stream. The Euclidean Distance, d (i, j) between the new data point, xi an all existing cluster centers, Ccj will be calculated.(as shown in equation 2)
d (i, j ) =|| xi − Cc j ||, j = 1,2,3,4...n
(2)
The result will be used to determine which cluster data point xi belongs to. If there is a cluster Cm with its centre Ccm; cluster radius Rum and the minimum distance value min d (i , j) (which is between the cluster centre for this cluster and the new incoming point xi) is ≤ Rum, then the current data point xi is considered belongs to this cluster Cm. Given a situation where there exist three clusters and each of their cluster radius size, cluster centre size, Euclidean distance are showed as follow:
109 Malaysian Journal of Computer Science, Vol. 19(2), 2006
Clustering of CPU Usage Data in Grid Environment using Evoc Algorithm pp. 105 - 116
Table 1: Generated Result for the Euclidean Distance Calculation J
X1
Ccj
Ruj
d(1, j)
1
0.05
0.05
0.01
0.00
2
0.05
0.02
0.05
0.03
3
0.05
0.09
0.57
0.04
From the Table 1 above, we can see that the data sample, x1 is having the minimum value of Euclidean Distance for cluster 1 ( j=1 ) which is d(1,1) = 0.00, and that minimum value is d(1, 1) ≤ Ru1 (d(i, j)) ≤ Rum, where m represents the number of the cluster,
d (i, m) = min d (i, j ) = min (|| xi − Cc j ||), j = 1,2,3,...n j
(3)
j
then it is regarded that the current sample x1 belongs to the cluster C1, which is the first cluster. In this case, neither a new cluster nor any existing cluster will be updated. The sample point x1 will be added into the cluster C1 as a new member in that cluster. In the case when the minimum value of Euclidean Distance is higher than cluster radius size where d(i, m) ≥ Rum. Thus, for further process, the Extended Distance Values, s (i, j ) for all the existing cluster and the sample point will be calculated using equation (4). (4) s (i, j ) = d (i, j ) + Ru j , j = 1,2,3...n The same process applies to the Euclidean Distance calculation, the minimum value of the Extended Distance Values, equation (5) will be taken as the decision for that sample point which cluster it would fit in.
s (i, j ) = d (i, j ) + Ru j = min s (i, j ), j = 1,2,3...n
(5)
j
There are two possible situations that may occur:
When the minimum value of Extended Distance Values (5), s (i, k) ≥ 2Dthr, k represents the number of cluster, then that certain sample point xi does not belong to any existing clusters. A new cluster will be created in the same way as described above.
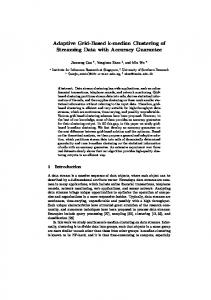
When the minimum value of Extended Distance Values (5), s (i, k) ≤ 2Dthr, then that data point xi belongs to Ca. The cluster with radius, Rua will be increasing its value and the cluster Ca will be updated by moving its cluster centre, Cca. The new updated radius Ruanew is set to be equal to
s (i, a) / 2
(6)
and the new cluster centre, Ccanew is located on the line connecting input data point xi and the old cluster centre Cca. The distance from the new centre Ccanew to the sample point xi = Ruanew (refer to x1 in Fig. 2).
110 Malaysian Journal of Computer Science, Vol. 19(2), 2006
Clustering of CPU Usage Data in Grid Environment using Evoc Algorithm pp. 105 - 116
C30, 3rd new cluster
x1
Ccanew
Ruanew. 2nd cluster, C2
C1, updated from the previous one
Fig. 2: A Brief Process of Updating Cluster Size [12]
3.4 Cluster Stability Stability is one of the new features that we have proposed in our Evoc algorithm. This feature does not exist in the ECM algorithm. To identify a stable computer from the stable clusters, we need to go through two stages of data filtering process. However, before the clustering process starts, two important values need to be determined first which are stability value and stability hour.
Stability Value: The value (in percentage) that measures the change in cluster radius. For instance, if the stability value is defined as 5%, any cluster radius that grows or shrinks less than 5% from the original size will be considered as stable.
Stability Hour: The value that defines the required amount of time in hours for a cluster member to stay in the same cluster in order for it to be considered stable. If the stability hour is set to 3 hours, any cluster member that stays in the same cluster for more than this amount of time will be considered as stable.
A cluster member can only be considered as stable if both of the factors mentioned above are fulfilled. If one of the factors is not satisfied, the cluster member will be deemed as unstable. Clusters behaviors and their members stability is important system is meant for the monitoring and resources allocations. Once the clustering process completes in the first phase, there will be many clusters created according to different computer’s behaviors in every hour. However, up to this level, we cannot make any conclusion on the stability of the data based on this information. Thus, we propose the stability feature to identify the stable cluster members. Since the clustering process is dynamic, it is hard to detect the stable cluster as well as the stable computer nodes in the process. The result from the clustering process will only show groups of similar behavior of computer nodes in an interval of time but not the stable computer nodes. Thus, the stability feature is being added into the original ECM algorithm to identify stable computer nodes that belongs to stable clusters. A cluster’s stability can be calculated by equation (7): Stability =
| R _ t − Rt | × 100% R _t
(7)
where R_t stands for radius in the previous hour, h-1 and Rt stands for the current hour’s cluster radius size. The smaller the value of the stability, the more stable the cluster is. In our research, we set the value of