Clustering signatures classify directed networks 1
2
S. E. Ahnert1 Theory of Condensed Matter, Cavendish Laboratory, JJ Thomson Avenue, Cambridge CB3 0HE, UK
3
T. M. A. Fink2345∗
INSERM U900 and CNRS UMR144, 4 Curie Institute, Paris F-75248, France and 5 Ecole des Mines de Paris, ParisTech, Fontainebleau, F-77300 France
We use a clustering signature, based on a recently introduced generalization of the clustering coefficient to directed networks, to analyze 16 directed real-world networks of five different types: social networks, genetic transcription networks, word adjacency networks, food webs and electric circuits. We show that these five classes of networks are cleanly separated in the space of clustering signatures due to the statistical properties of their local neighbourhoods, demonstrating the usefulness of clustering signatures as a classifier of directed networks.
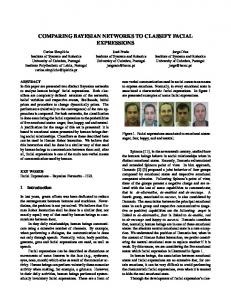
Many types of complex networks have been studied over the past decade [1], ranging from social collaboration networks [2] and the internet [3] to genetic regulatory networks [4] and transport networks [5]. This research has revealed remarkable similarities in the properties of many different types of real-world networks, such as scale-free topologies [6] and small-world connectivity [7]. However, with a few exceptions [8–11], most of the research thus far has concentrated on undirected networks, that is, networks in which the edges between nodes are not oriented. This is partially because directed networks allow a much more complicated connectivity. For example, in an undirected network there is only one way to form a triangle between three unlabelled nodes, whereas directed networks allow seven distinct triangles (see Figure 1). The relative frequency of these seven triangles in real-world networks has been studied in the context of network motifs [12], which have been used to identify superfamilies of networks [13]. In each of these superfamilies, particular motifs occur either more frequently or less frequently, compared to the null case, and the combination of overand under-expressed motifs is unique to a given superfamily.
I.
distinct regions in this tetrahedron, revealing the different roles played by the nodes in these networks. For undirected networks the clustering coefficient of a node i is defined [7] as ! ! j,k aij ajk aik j,k aij ajk aik = ! ci = di (di − 1)/2 j,k aij aik
where j < k and j "= i "= k, and di is the degree of node i. This corresponds to the number of triangles in the network which include node i, divided by the number of pairs of bonds including i, which represent potential triangles. In the past the task of defining a clustering coefficient in directed networks has proven difficult, as there is more than one way of forming a triangle (see Figure 1). However, in the very recent literature [11], advances have been made in this direction, and we use a classification of triangles which is equivalent to that introduced in [11]. Consider three nodes, of which one is labelled. For these there are four distinct ’basis’ triangles with a single edge between each pair of nodes. Furthermore there are three types of edge pairs for these nodes which can connect the labelled node to its two unlabelled neighbours. These are the three potential triangles of directed
CLUSTERING SIGNATURE
Here we use a clustering signature to classify a wide range of complex directed networks. The components of this four-dimensional quantity consists of a recent generalization [11] of the undirected clustering coefficient [7] to directed networks. By normalizing it we can map this quantity to the interior of a tetrahedron, thereby providing an effective means for visualizing and comparing the local connectivity of directed networks. We find that different types of directed real-world networks cluster in
∗ Electronic
address:
[email protected]; URL: http://www.tcm. phy.cam.ac.uk/~tmf20/
FIG. 1: Directed networks are much more complex than undirected ones. In undirected networks three unlabelled nodes can only form one sort of triangle (left), whereas in directed networks there are seven distinct triangles (right).
2
FB A FFA B FFB C FFC
FIG. 2: The three potential triangles (left column) and four basis triangles (right column) for one labelled node (black). The basis triangles divide into a feedback (FB) loop and three feed-forward (FF) loops. Note that all seven triangles shown in Figure 1 can be recreated by superposing feed-forward and feedback loops.
As the clustering signature is a point in fourdimensional space, and thus is hard to visualize, we normalize the signature and omit the first dimension. In the resulting three-dimensional space each signature – represented as a point – lies inside a tetrahedron, the vertices of which are located at the origin (0,0,0) and the points (1,0,0), (0,1,0) and (0,0,1). Hence this tetrahedron is spanned by orthogonal unit vectors, which represent the three normalized feed-forward loop components. The magnitude of the fourth component, representing the feedback loop, is given by the perpendicular distance between a (111) plane running through that point and the origin (with √ the actual component of the normalized signature being 3 times that distance). The normalized signature is defined by (i) ˜ (i) = C C (i) T
where (i)
(i)
networks. We show these four basis triangles and the three potential triangles in Figure 2. One of the four basis triangles is the feedback (FB) loop and the remaining three are feed-forward (FF) loops. The three feedforward loops differ in the in-degree of the labelled node (shown black): the labelled node has in-degree 0 for FFA , in-degree 1 for FFB and in-degree 2 for FFC . Thus one can construct four clustering coefficients for each node, one for each type of loop [11]. Based on the clustering coefficient for undirected networks, the number of triangles N is divided by the number of potential triangles M . This gives a clustering signature for each node C(i) given by " # (i) (i) (i) (i) N N N N FF FF FF A B C FB C(i) = , , , (i) (i) (i) (i) MB MA MB MC
MA =
$
(i)
aij aik ; MB =
j,k
(i)
NFB =
$
aij ajk aki
!
(i)
j,k
aij aki ; MC =
(i)
$ j,k
aji aki
j,k
(i)
NFFA =
j,k
NFFB =
$
$
aij akj aik
j,k
aij akj aki
(i)
NFFC =
$
aji akj aki
(1)
j,k
and where aij signifies a directed connection from node i to node j. The sums now run over all possible j, k such that i "= j "= k "= i and there is no longer a constraint of (i) (i) j < k. Note that MA and MC involve double-counting, which corresponds to the two possible ways in which both (i) (i) FFA and FFC can be formed from MA and MC . The set of these four quantities forms the clustering signature of a directed network.
NFB (i)
MB
+
NFFA (i)
MA
(i)
+
NFFB (i)
MB
(i)
+
NFFC (i)
MC
Note that this normalization is not the standard vector normalization which divides by the modulus of the vector. It is equivalent to the normalization discussed in eq. (18) in [11]. We can then calculate the average normalized clustering signature over all N nodes i of a given network as N $ ˜ = 1 ˜ (i) C C N i=1
In the following we will refer to the four components ˜ as C˜FB , of the average normalized clustering signature C ˜ ˜ ˜ CFFA , CFFB and CFFC . II.
where (i)
T (i) =
CLASSIFICATION OF DIRECTED NETWORKS
We calculate the clustering signatures of 16 directed real-world networks. These networks fall into five different classes: electric circuits, genetic transcription networks, social networks, language networks and food webs. We show that these five classes are clearly separated in the space of normalized clustering signatures. To measure how tightly the groups are clustered we employ a kmeans clustering algorithm which cleanly separates these networks into their respective classes, with 89% of total variance explained. These k-means centroids thus provide an effective classifier of directed networks. All kmeans clustering is done in the three dimensional space of (C˜FFA , C˜FFB , C˜FFC ), which corresponds to the interior of the tetrahedron. The location of the 16 networks in the clustering signature tetrahedron can be see in Figure 3. In the following we describe the results for the different classes in detail.
3
networks
k-means centroid ˜FF , C˜FF , C ˜FF ) (C A B C
Food webs (3)
0.283, 0.445, 0.195
dominant component(s)
> 0.42
Transcription (2)
0.145, 0.232, 0.622 > 0.62
Language (3)
0.160, 0.321, 0.178 > 0.32 > 0.31
Social (5)
0.372, 0.295, 0.183 > 0.30
Circuits (3)
(C˜FFC > 0.62). This signifies a markedly increased likelihood that, if gene C is regulated by genes A and B, then gene A also regulates gene B, or vice versa. Feedforward loops have been shown to occur frequently in transcription networks [18]. The reason why the FFA component of the clustering signature is suppressed is because many genes which are located at the top of a feed-forward hierarchy (i.e. in the FFA position), regulate many other genes, which increases MA and dilutes the FFA component. If a gene is regulated by two other genes, however, as represented by the FFC scenario, the probability that all three form a feed-forward loop is large, since the indegrees in these transcription networks are small. Language networks – These three word-adjacency networks for English (N = 7724, E = 46281), French (N = 9424, E = 24295) and Japanese (N = 3177, E = 8300) [13] show increased FB (with C˜FB > 0.32) and FFB (with C˜FFB > 0.31) components. This reflects the fact that words fall into several categories such as nouns,
circuits transcription social language foodwebs
FB
— = 1.0
TABLE I: Comparison of the clustering signature properties of 16 networks of five types. The food webs, transcription networks, language networks and social networks are distinguished using k-means clustering with 89% of variance explained. Electric circuits were not included in the k-means clustering as they form an infinitely tight cluster. The kmeans centroids in the space of normalized clustering signatures are given in the table. Due to the normalization the fourth component of the normalized signature is implicitly ˜F B = 1 − C ˜F F − C ˜F F − C˜F F . given by the other three: C A B C Note that the neutral point, corresponding to undirected networks, lies at (0.25, 0.25, 0.25, 0.25).
Food webs – The three food webs studied represent a variety of ecosystems [14]: the Chesapeake Bay Mesohaline Net (N = 39 nodes, E = 177 edges) [15], the Everglades Graminoid Marshes (N = 69, E = 916) [16] and the Florida Bay Trophic Exchange Matrix (N = 128, E = 2106) [17]. In the clustering signature of these food webs the FFB component is particularly prominent, with C˜FFB > 0.42. This translates into an increased likelihood that, if species B is eaten by species A and eats species C (a scenario corresponding to B in Figure 2), then species A also eats species C – in a food web, this is a plausible scenario. Transcription networks – In the two transcription networks, from the species E. coli (N = 423, E = 519) and S. cerevisiae (N = 688, E = 1079) [12], the clustering signature shows a highly dominant FFC component
FFA FFB
FFC
FIG. 3: Clustering signature tetrahedron with the positions of the 16 networks of five different types (see legend). K-means clustering separates these classes perfectly. The tetrahedron corresponds to the feed-forward subspace of the normalized ˜FFA , C˜FFB , C ˜FFC ), so that the clustering signatures, i.e. (C FB vertex corresponds to (0, 0, 0), and the FFA , FFB and FFC vertices correspond to the (1, 0, 0), (0, 1, 0) and (0, 0, 1) points respectively. If a network only has feedback loops and no feed-forward loops (such as the electric circuits studied in this paper), it will be located at the FB vertex. Conversely, a network without any feedback loops will be located at the base of the tetrahedron. The location of a network relative to the FFA , FFB and FFC vertices signifies the relative dominance of the given node roles (see Figure 2). As an illustration, consider the transcription networks (black squares) which have a k-means centroid of (0.145, 0.232, 0.622). The normalization ˜FB = 1 − 0.145 − 0.232 − 0.622 = 0.001 so that implies that C these networks will be located at the base of the tetrahedron. The FFA component is also negligible, so that the networks lie on the edge opposite the FFA vertex, slightly closer to FFC than FFB because the FFC component is larger.
4 adjectives, verbs and conjunctions, and that words of the same category are rarely adjacent. This is why the FFA and FFC components are suppressed, as it requires words B and C, which both can follow (or preceed) word A, to be able to appear adjacent as well. Furthermore, the FFB component is also enhanced by the presence of inserted words, such as adjectives, since it represents words which could be omitted without making the grammar invalid.
Electric circuits – Due to their specific design, these three circuits (N = 122, E = 189; N = 252, E = 399; N = 512, E = 819) from [12], which represent digital fractional multipliers, only contain feedback loops, placing them at the FB vertex of the clustering signature tetrahedron.
III.
Social networks – The five social networks represent a wide range of social interactions, from hyperlinks between political weblogs (N = 1491, E = 19090) [19], relationships between prison inmates (N = 67, E = 182) [20], selection of team partners (N = 32, E = 96) [21] and interactions in an African tailor shop at two different times (N = 39, E = 109; N = 39, E = 147) [22]. Many social networks are undirected, and the fact that the five directed social networks studied here are close to the neutral normalized clustering signature C˜N = (0.25, 0.25, 0.25, 0.25) is an indicator that even directed social networks are rather symmetric. To quantify this one can consider a measure of reciprocity introduced in the recent literature [23], which takes values between 1 and -1 indicating whether reciprocal links occur more or less often than expected by chance. The five social networks studied here have values of reciprocity between 0.11 and 0.49 which indicates a definite but not overwhelming presence of reciprocal links. The observation that social networks are approximately symmetric is not surprising as social interactions are typically reciprocal, and when they are not, the direction of a social interaction is often difficult to define. Therefore the direction of the edges in a directed social network has to be defined particularly carefully, as reversing the direction of all edges will swap the C˜FFA and C˜FFC components. In the five social networks studied here the direction of the edge can be understood as an imbalance of benefits between the two social agents. In the tailor shop this measures whether person B is more useful to person A than A to B. If so, the arrow points from A to B. In political weblogs, the owner of a site A chooses to link to another site B, representing a use of site B. In this case the edge would also go from A to B. In the prison where inmate A expresses positive sentiments towards prisoner B, the arrow too goes from A to B. Students choosing other students as co-workers on a team are an equivalent case. Overall the deviation of the social networks from the neutral point C˜N is small, and is most marked in the FFA component (with C˜FFA > 0.30). To understand this, consider a person A who names two others, B and C, as friends. If B or C themselves are popular, chances are that the less popular one of the two will choose the more popular one as their friend as well. This creates a feedforward loop with node A as the labelled node of an FFA loop (see Fig. 2). The suppressed FFC component, on the other hand, may represent popular individuals who are chosen by many, who in turn would not choose each other.
DISCUSSION
To demonstrate that the clustering signature depends only on the local connectivity of directed network edges and not on differences in the overall density of edges in the networks, we flip the direction of edges between all connected pairs of nodes, with probability one-half. This keeps the undirected connectivity (and thus the edge density) constant, while destroying the distinction between the four loops FB, FFA , FFB , and FFC . If clustering signatures are only dependent on the local connectivity of directed edges, then destroying the information about the direction of edges should move all randomized realworld networks to the centre of the tetrahedron. This prediction is indeed confirmed by the results for ten such randomizations on each of the 16 networks. After randomization all networks lie very close to the neutral point of C˜N = (0.25, 0.25, 0.25, 0.25) with averages always between 0.22 and 0.27, and in most cases between 0.24 and 0.26. The neutral point lies within one standard deviation in all cases. This confirms that the clustering signature tetrahedron is an effective way of measuring the differences in the local connectivity of directed networks. Note that, for the networks examined, the number of nodes and edges varies widely - both within the five groups of networks and between them. The fact that the types of networks are nevertheless clearly separated, together with the randomization test discussed above, suggests that the classification according to clustering signatures is independent of the network size. Only for very sparse, small graphs one would expect the size of the network to matter in the form of a visible discretization of clustering signature values, which may coarsen the classification. While the dimensional limitations mean that additional network features cannot easily be included in three dimensions, one could achieve such a combined analysis by constructing a larger feature vector - containing the clustering signature - which could then be analyzed using multivariate methods such as principal component analysis or canonical variable analysis [24]. Finally, clustering signatures can be generalized to weighted directed networks in a straightforward way by using the ensemble approach [25]. This requires a choice of mapping from weights wij to the unit interval: wij ∈ R → pij ∈ [0, 1], which depends on the nature of the weights. These pij replace the adjacency matrix entries aij in all seven expressions for M and N in eq. (1), in analogy to the ensemble clustering coefficient for undirected networks discussed in [25]. Note that in the case
5 of this weighted generalization, the individual clustering coefficients differ from those defined for the weighted case in [11]. In conclusion, our analysis reveals that different types of directed real-world networks are characterized by their clustering signature. The relative prevalence of the four components of the signature is an indicator of the way in which nodes connect to their neighbourhood. Thus clustering signatures offer an effective method for the classification of directed networks. They also provide an intuitive three-dimensional space in which the local
[1] R. Albert, A.-L. Barabasi Rev. Mod. Phys. 74, 47 (2002). [2] M. E. J. Newman, Proc. Natl. Acad. Sci. U.S.A. 98 404 (2001). [3] M. Faloutsos, P. Faloutsos and C. Faloutsos, Proc. ACM SIGCOMM, Computer Communication Review 29, 251 (1999). [4] S. Maslov and K. Sneppen, Science 296, 910 (2002). [5] A. Barrat, M. Barthelemy, R. Pastor-Sartorras, and A. Vespignani, Proc. Natl. Acad. Sci. U.S.A. 101, 3747 (2004). [6] A.-L. Barabasi, R. Albert Science 286, 509 (1999). [7] D. J. Watts and S. H. Strogatz, Nature 393, 440-(1998). [8] L. da Fontoura Costa, Phys. Rev. Lett. 93, 098702 (2004). [9] A. Capocci, V. D. P. Servedio, F. Colaiori, L. S. Buriol, D. Donato, S. Leonardi, and G. Caldarelli, Phys. Rev. E 74, 036116 (2006). [10] G. Fagiolo, Econ. Bull. 3 (34), 1 (2007). [11] G. Fagiolo, Phys. Rev. E 76, 026107 (2007). [12] R Milo, S Shen-Orr, S Itzkovitz, N Kashtan, D Chklovskii and U Alon, Science 298, 824 (2002). [13] R Milo, S Itzkovitz, N Kashtan, R Levitt, S Shen-Orr, I Ayzenshtat, M Sheffer and U Alon, Science 303, 1538 (2004). [14] The foodweb data can be downloaded from http://vlado.fmf.unilj.si/pub/networks/data/bio/foodweb/foodweb.htm. [15] D. Baird and R.E. Ulanowicz, Ecological Monographs 59 329 (1989).
connectivity of directed networks can be visualized and compared.
Acknowledgments
S.E.A. was supported by The Leverhulme Trust, UK. This work was funded in part by the Defense Advanced Research Projects Agency (DARPA) Fundamental Laws of Biology (FunBio) grant HR 0011-05-1-0057.
[16] R.E. Ulanowicz, J.J. Heymans, and M.S. Egnotovich, Ref. No. [UMCES] CBL 00-0176. Chesapeake Biological Laboratory, Solomons, MD 20688-0038 USA. (2000) [17] R.E. Ulanowicz, C. Bondavalli and M.S. Egnotovich Ref. No. [UMCES]CBL 98-123. Chesapeake Biological Laboratory, Solomons, MD 20688-0038 USA. (1998) [18] S Mangan and U Alon, Proc. Natl. Acad. Sci. U.S.A. 100, 11980 (2003). [19] L. A. Adamic and N. Glance, ”The political blogosphere and the 2004 US Election”, Proceedings of the WWW-2005 Workshop on the Weblogging Ecosystem (2005). [20] J. MacRae, Sociometry 23, 360 (1960). [21] L. D. Zeleny, Sociometry 13, 314 (1950). [22] B. Kapferer, ”Strategy and transaction in an African factory”, Manchester University Press (1972). [23] D. Garlaschelli and M. I. Loffredo, Phys. Rev. Lett. 93, 268701 (2004). [24] L. da F. Costa, F. A. Rodriguez, G. Travieso, and P. R. Villas Boas, Adv. Phys. 56, 167 (2007). [25] S. E. Ahnert, D. Garlaschelli, T. M. A. Fink, and G. Caldarelli, Phys. Rev. E 76, 016101 (2007).